Dunblane Airbnb Market Analysis 2025: Short Term Rental Data & Vacation Rental Statistics in Scotland, United Kingdom
Is Airbnb profitable in Dunblane in 2025? Explore comprehensive Airbnb analytics for Dunblane, Scotland, United Kingdom to uncover income potential. This 2025 STR market report for Dunblane, based on AirROI data from April 2024 to March 2025, reveals key trends in the niche market of 29 active listings.
Whether you're considering an Airbnb investment in Dunblane, optimizing your existing vacation rental, or exploring rental arbitrage opportunities, understanding the Dunblane Airbnb data is crucial. Navigating the high regulation landscape is key to maximizing your short term rental income potential. Let's dive into the specifics.
Key Dunblane Airbnb Performance Metrics Overview
Monthly Airbnb Revenue Variations & Income Potential in Dunblane (2025)
Understanding the monthly revenue variations for Airbnb listings in Dunblane is key to maximizing your short term rental income potential. Seasonality significantly impacts earnings. Our analysis, based on data from the past 12 months, shows that the peak revenue month for STRs in Dunblane is typically August, while February often presents the lowest earnings, highlighting opportunities for strategic pricing adjustments during shoulder and low seasons. Explore the typical Airbnb income in Dunblane across different performance tiers:
- Best-in-class properties (Top 10%) achieve $7,051+ monthly, often utilizing dynamic pricing and superior guest experiences.
- Strong performing properties (Top 25%) earn $3,901 or more, indicating effective management and desirable locations/amenities.
- Typical properties (Median) generate around $2,791 per month, representing the average market performance.
- Entry-level properties (Bottom 25%) see earnings around $2,070, often with potential for optimization.
Average Monthly Airbnb Earnings Trend in Dunblane
Dunblane Airbnb Occupancy Rate Trends (2025)
Maximize your bookings by understanding the Dunblane STR occupancy trends. Seasonal demand shifts significantly influence how often properties are booked. Typically, Augustsees the highest demand (peak season occupancy), while February experiences the lowest (low season). Effective strategies, like adjusting minimum stays or offering promotions, can boost occupancy during slower periods. Here's how different property tiers perform in Dunblane:
- Best-in-class properties (Top 10%) achieve 82%+ occupancy, indicating high desirability and potentially optimized availability.
- Strong performing properties (Top 25%) maintain 71% or higher occupancy, suggesting good market fit and guest satisfaction.
- Typical properties (Median) have an occupancy rate around 57%.
- Entry-level properties (Bottom 25%) average 41% occupancy, potentially facing higher vacancy.
Average Monthly Occupancy Rate Trend in Dunblane
Average Daily Rate (ADR) Airbnb Trends in Dunblane (2025)
Effective short term rental pricing strategy in Dunblane involves understanding monthly ADR fluctuations. The Average Daily Rate (ADR) for Airbnb in Dunblane typically peaks in July and dips lowest during February. Leveraging Airbnb dynamic pricing tools or strategies based on this seasonality can significantly boost revenue. Here's a look at the typical nightly rates achieved:
- Best-in-class properties (Top 10%) command rates of $425+ per night, often due to premium features or locations.
- Strong performing properties (Top 25%) achieve nightly rates of $207 or more.
- Typical properties (Median) charge around $148 per night.
- Entry-level properties (Bottom 25%) earn around $123 per night.
Average Daily Rate (ADR) Trend by Month in Dunblane
Get Live Dunblane Market Intelligence 👇

Explore Real-time Analytics
Airbnb Seasonality Analysis & Trends in Dunblane (2025)
Peak Season (August, July, June)
- Revenue averages $5,078 per month
- Occupancy rates average 78.1%
- Daily rates average $223
Shoulder Season
- Revenue averages $3,383 per month
- Occupancy maintains around 55.4%
- Daily rates hold near $213
Low Season (January, February, March)
- Revenue drops to average $1,963 per month
- Occupancy decreases to average 34.4%
- Daily rates adjust to average $197
Seasonality Insights for Dunblane
- The Airbnb seasonality in Dunblane shows highly seasonal trends requiring careful strategy. While the sections above show seasonal averages, it's also insightful to look at the extremes:
- During the high season, the absolute peak month showcases Dunblane's highest earning potential, with monthly revenues capable of climbing to $5,395, occupancy reaching a high of 81.6%, and ADRs peaking at $226.
- Conversely, the slowest single month of the year, typically falling within the low season, marks the market's lowest point. In this month, revenue might dip to $1,834, occupancy could drop to 32.1%, and ADRs may adjust down to $195.
- Understanding both the seasonal averages and these monthly peaks and troughs in revenue, occupancy, and ADR is crucial for maximizing your Airbnb profit potential in Dunblane.
Seasonal Strategies for Maximizing Profit
- Peak Season: Maximize revenue through premium pricing and potentially longer minimum stays. Ensure high availability.
- Low Season: Offer competitive pricing, special promotions (e.g., extended stay discounts), and flexible cancellation policies. Target off-season travelers like remote workers or budget-conscious guests.
- Shoulder Seasons: Implement dynamic pricing that balances peak and low rates. Target weekend travelers or specific events. Offer slightly more flexible terms than peak season.
- Regularly analyze your own performance against these Dunblane seasonality benchmarks and adjust your pricing and availability strategy accordingly.
Best Areas for Airbnb Investment in Dunblane (2025)
Exploring the top neighborhoods for short-term rentals in Dunblane? This section highlights key areas, outlining why they are attractive for hosts and guests, along with notable local attractions. Consider these locations based on your target guest profile and investment strategy.
| Neighborhood / Area | Why Host Here? (Target Guests & Appeal) | Key Attractions & Landmarks |
|---|---|---|
| Dunblane Cathedral | A stunning historic cathedral that attracts visitors for its architecture and history. Ideal for guests interested in Scottish heritage and culture. | Dunblane Cathedral, Dunblane Museum, The Old Town, The River Allan, Glenqouat Park |
| The Bridge | This area features picturesque views and easy access to outdoor activities, perfect for nature lovers and walkers. | The Old Bridge over the Allan, Scottish Scenic Routes, Dunblane Hydro, Local hiking trails, Picnic areas |
| Dunblane Sports Club | A hub for sports enthusiasts, this location attracts visitors year-round for tournaments and events. | Golf courses, Cricket grounds, Sports events, Fitness facilities |
| Dunblane's Main Street | The heart of the town, filled with charming shops, cafes and historical sites, popular among visitors and locals. | Local shops, Cafes and restaurants, Historical buildings, Local events and markets |
| The Wallace Monument | A short drive from Dunblane, this monument offers a historical experience and breathtaking views of the surrounding area. | Wallace Monument, Stirling Castle, Scenic viewpoints, Walking trails |
| The Trossachs | A nearby national park known for its stunning landscapes, ideal for guests seeking outdoor adventures. | Loch Lomond, Walking and biking trails, Nature reserves, Wildlife watching |
| The Stirling Area | Close to Dunblane, in one of Scotland's most historic cities, perfect for tourists wanting to explore Scottish history. | Stirling Castle, Battle of Bannockburn site, Stirling Old Town, The Stirling Smith Museum |
| Local Pubs and Restaurants | Famous for friendly atmospheres and delicious local food, making it appealing to food lovers and social visitors. | Local microbreweries, Gastronomic experiences, Traditional Scottish pubs, Live music events |
Understanding Airbnb License Requirements & STR Laws in Dunblane (2025)
Yes, Dunblane, Scotland, United Kingdom enforces high STR regulations. Obtaining a license and ensuring compliance is almost certainly required according to current 2025 STR laws. Always verify the latest short term rental regulations and Airbnb license requirements directly with local government authorities for Dunblane to ensure full compliance before hosting.
(Source: AirROI data, 2025, based on 41% licensed listings)
Top Performing Airbnb Properties in Dunblane (2025)
Benchmark your potential! Explore examples of top-performing Airbnb properties in Dunblanebased on Trailing Twelve Month (TTM) revenue. Analyze their characteristics, revenue, occupancy rate, and ADR to understand what drives success in this market.
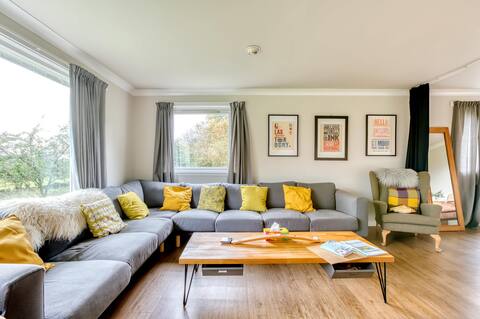
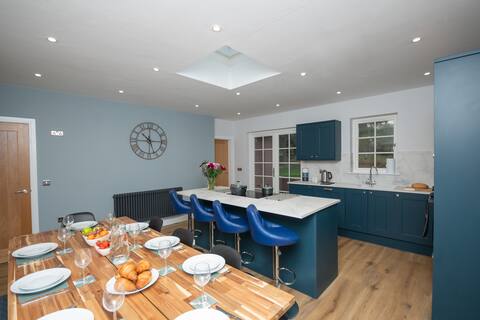
4 bedroom rural cottage with hot tub and sauna
Entire Place • 4 bedrooms
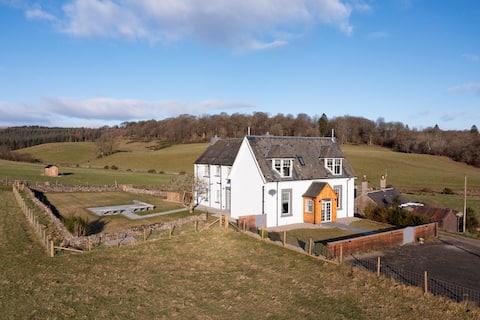
Glenwhilk Farmhouse
Entire Place • 5 bedrooms
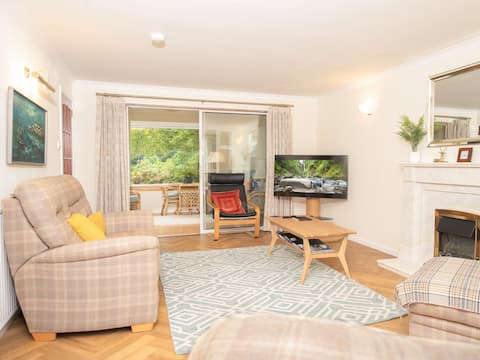
Argyle View
Entire Place • 3 bedrooms
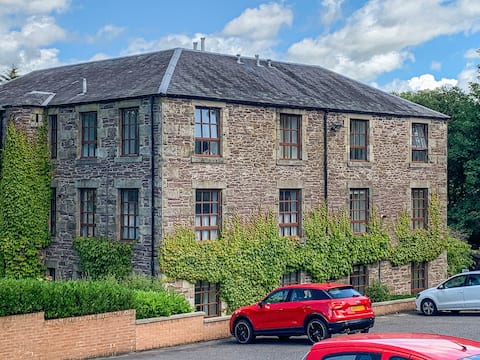
Mill Court
Entire Place • 2 bedrooms
*NEW* Historical Holmehill Lodge
Entire Place • 4 bedrooms
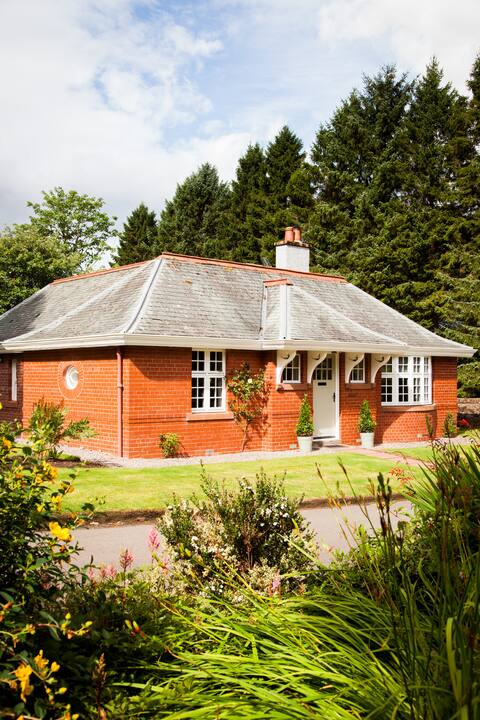
The Gardener's Cottage, Dunblane, Stirlingshire
Entire Place • 2 bedrooms
Note: Performance varies based on location, size, amenities, seasonality, and management quality. Data reflects the past 12 months.
Top Performing Airbnb Hosts in Dunblane (2025)
Learn from the best! This table showcases top-performing Airbnb hosts in Dunblane based on the number of properties managed and estimated total revenue over the past year. Analyze their scale and performance metrics.
| Host Name | Properties | Grossing Revenue | Stay Reviews | Avg Rating |
|---|---|---|---|---|
| Cottages | 2 | $136,660 | 23 | 4.79/5.0 |
| Carola | 4 | $126,395 | 506 | 4.90/5.0 |
| Andrew | 1 | $99,297 | 189 | 5.00/5.0 |
| Sakina | 2 | $80,689 | 40 | 4.76/5.0 |
| Sarah | 1 | $80,673 | 7 | 5.00/5.0 |
| Debbie | 1 | $42,279 | 44 | 4.95/5.0 |
| Edward | 1 | $40,319 | 33 | 5.00/5.0 |
| Erin | 1 | $35,784 | 196 | 4.65/5.0 |
| Graham | 1 | $35,612 | 88 | 4.90/5.0 |
| Val | 1 | $34,546 | 37 | 5.00/5.0 |
Analyzing the strategies of top hosts, such as their property selection, pricing, and guest communication, can offer valuable lessons for optimizing your own Airbnb operations in Dunblane.
Dive Deeper: Advanced Dunblane STR Market Data (2025)
Ready to unlock more insights? AirROI provides access to advanced metrics and comprehensive Airbnb data for Dunblane. Explore detailed analytics beyond this report to refine your investment strategy, optimize pricing, and maximize your vacation rental profits.
Explore Advanced MetricsDunblane Short-Term Rental Market Composition (2025): Property & Room Types
Room Type Distribution
Property Type Distribution
Market Composition Insights for Dunblane
- The Dunblane Airbnb market composition is heavily skewed towards Entire Home/Apt listings, which make up 100% of the 29 active rentals. This indicates strong guest preference for privacy and space.
- Looking at the property type distribution in Dunblane, House properties are the most common (55.2%), reflecting the local real estate landscape.
- Houses represent a significant 55.2% portion, catering likely to families or larger groups.
- Smaller segments like others (combined 3.4%) offer potential for unique stay experiences.
Dunblane Airbnb Room Capacity Analysis (2025): Bedroom Distribution
Distribution of Listings by Number of Bedrooms
Room Capacity Insights for Dunblane
- The dominant room capacity in Dunblane is 1 bedroom listings, making up 44.8% of the market. This suggests a strong demand for properties suitable for couples or solo travelers.
- Together, 1 bedroom and 2 bedrooms properties represent 82.7% of the active Airbnb listings in Dunblane, indicating a high concentration in these sizes.
Dunblane Vacation Rental Guest Capacity Trends (2025)
Distribution of Listings by Guest Capacity
Guest Capacity Insights for Dunblane
- The most common guest capacity trend in Dunblane vacation rentals is listings accommodating 4 guests (41.4%). This suggests the primary traveler segment is likely small families or groups.
- Properties designed for 4 guests and 2 guests dominate the Dunblane STR market, accounting for 75.9% of listings.
- 10.3% of properties accommodate 6+ guests, serving the market segment for larger families or group travel in Dunblane.
- On average, properties in Dunblane are equipped to host 3.7 guests.
Dunblane Airbnb Booking Patterns (2025): Available vs. Booked Days
Available Days Distribution
Booked Days Distribution
Booking Pattern Insights for Dunblane
- The most common availability pattern in Dunblane falls within the 91-180 days range, representing 58.6% of listings. This suggests many properties have significant open periods on their calendars.
- Approximately 37.9% of listings show high availability (181+ days open annually), indicating potential for increased bookings or specific owner usage patterns.
- For booked days, the 181-270 days range is most frequent in Dunblane (55.2%), reflecting common guest stay durations or potential owner blocking patterns.
- A notable 62.1% of properties secure long booking periods (181+ days booked per year), highlighting successful long-term rental strategies or significant owner usage.
Dunblane Airbnb Minimum Stay Requirements Analysis
Distribution of Listings by Minimum Night Requirement
1 Night
5 listings
17.9% of total
2 Nights
11 listings
39.3% of total
3 Nights
8 listings
28.6% of total
4-6 Nights
2 listings
7.1% of total
30+ Nights
2 listings
7.1% of total
Key Insights
- The most prevalent minimum stay requirement in Dunblane is 2 Nights, adopted by 39.3% of listings. This highlights the market's preference for shorter, flexible bookings.
Recommendations
- Align with the market by considering a 2 Nights minimum stay, as 39.3% of Dunblane hosts use this setting.
- If feasible, allowing 1-night stays, especially midweek or during low season, could capture last-minute bookings, as only 17.9% currently do.
- A 2-night minimum appears standard (39.3%). Consider this for weekends or peak periods.
- Explore offering discounts for stays of 30+ nights to attract the 7.1% of the market seeking extended stays.
- Adjust minimum nights based on seasonality – potentially shorter during low season and longer during peak demand periods in Dunblane.
Dunblane Airbnb Cancellation Policy Trends Analysis (2025)
Super Strict 60 Days
2 listings
7.7% of total
Flexible
4 listings
15.4% of total
Moderate
8 listings
30.8% of total
Firm
6 listings
23.1% of total
Strict
6 listings
23.1% of total
Cancellation Policy Insights for Dunblane
- The prevailing Airbnb cancellation policy trend in Dunblane is Moderate, used by 30.8% of listings.
- There's a relatively balanced mix between guest-friendly (46.2%) and stricter (46.2%) policies, offering choices for different guest needs.
Recommendations for Hosts
- Consider adopting a Moderate policy to align with the 30.8% market standard in Dunblane.
- Regularly review your cancellation policy against competitors and market demand shifts in Dunblane.
Dunblane STR Booking Lead Time Analysis (2025)
Average Booking Lead Time by Month
Booking Lead Time Insights for Dunblane
- The overall average booking lead time for vacation rentals in Dunblane is 71 days.
- Guests book furthest in advance for stays during July (average 116 days), likely coinciding with peak travel demand or local events.
- The shortest booking windows occur for stays in February (average 36 days), indicating more last-minute travel plans during this time.
- Seasonally, Summer (111 days avg.) sees the longest lead times, while Winter (41 days avg.) has the shortest, reflecting typical travel planning cycles.
Recommendations for Hosts
- Use the overall average lead time (71 days) as a baseline for your pricing and availability strategy in Dunblane.
- For July stays, consider implementing length-of-stay discounts or slightly higher rates for bookings made less than 116 days out to capitalize on advance planning.
- Target marketing efforts for the Summer season well in advance (at least 111 days) to capture early planners.
- Monitor your own booking lead times against these Dunblane averages to identify opportunities for dynamic pricing adjustments.
Popular & Essential Airbnb Amenities in Dunblane (2025)
Amenity Prevalence
Amenity Insights for Dunblane
- Essential amenities in Dunblane that guests expect include: Smoke alarm, Wifi, Kitchen, TV, Heating. Lacking these (any) could significantly impact bookings.
- Popular amenities like Washer, Refrigerator, Dishes and silverware are common but not universal. Offering these can provide a competitive edge.
Recommendations for Hosts
- Ensure your listing includes all essential amenities for Dunblane: Smoke alarm, Wifi, Kitchen, TV, Heating.
- Prioritize adding missing essentials: TV, Heating.
- Consider adding popular differentiators like Washer or Refrigerator to increase appeal.
- Highlight unique or less common amenities you offer (e.g., hot tub, dedicated workspace, EV charger) in your listing description and photos.
- Regularly check competitor amenities in Dunblane to stay competitive.
Dunblane Airbnb Guest Demographics & Profile Analysis (2025)
Guest Profile Summary for Dunblane
- The typical guest profile for Airbnb in Dunblane consists of a mix of domestic (57%) and international guests, often arriving from nearby England, typically belonging to the Post-2000s (Gen Z/Alpha) group (50%), primarily speaking English or German.
- Domestic travelers account for 57.1% of guests.
- Key international markets include United Kingdom (57.1%) and United States (16.7%).
- Top languages spoken are English (62.6%) followed by German (10.8%).
- A significant demographic segment is the Post-2000s (Gen Z/Alpha) group, representing 50% of guests.
Recommendations for Hosts
- Balance marketing efforts between domestic and international channels based on the guest mix.
- Tailor amenities and listing descriptions to appeal to the dominant Post-2000s (Gen Z/Alpha) demographic (e.g., highlight fast WiFi, smart home features, local guides).
- Highlight unique local experiences or amenities relevant to the primary guest profile.
- Consider seasonal promotions aligned with peak travel times for key origin markets.
Nearby Short-Term Rental Market Comparison
How does the Dunblane Airbnb market stack up against its neighbors? Compare key performance metrics like average monthly revenue, ADR, and occupancy rates in surrounding areas to understand the broader regional STR landscape.
| Market | Active Properties | Monthly Revenue | Daily Rate | Avg. Occupancy |
|---|---|---|---|---|
| Galston | 11 | $7,951 | $676.77 | 46% |
| Fearnan | 19 | $6,440 | $421.92 | 53% |
| Gorebridge | 12 | $6,209 | $493.62 | 54% |
| Bridge of Cally | 16 | $5,839 | $566.24 | 50% |
| Kirkhill | 10 | $5,719 | $700.26 | 44% |
| North Kessock | 10 | $5,421 | $380.62 | 58% |
| Foyers | 14 | $5,076 | $274.52 | 64% |
| Arrochar | 33 | $5,045 | $339.11 | 56% |
| Whitebridge | 10 | $4,907 | $417.35 | 42% |
| Acharn | 10 | $4,813 | $278.43 | 57% |