Dollar Airbnb Market Analysis 2025: Short Term Rental Data & Vacation Rental Statistics in Scotland, United Kingdom
Is Airbnb profitable in Dollar in 2025? Explore comprehensive Airbnb analytics for Dollar, Scotland, United Kingdom to uncover income potential. This 2025 STR market report for Dollar, based on AirROI data from April 2024 to March 2025, reveals key trends in the niche market of 27 active listings.
Whether you're considering an Airbnb investment in Dollar, optimizing your existing vacation rental, or exploring rental arbitrage opportunities, understanding the Dollar Airbnb data is crucial. Leveraging the low regulation environment is key to maximizing your short term rental income potential. Let's dive into the specifics.
Key Dollar Airbnb Performance Metrics Overview
Monthly Airbnb Revenue Variations & Income Potential in Dollar (2025)
Understanding the monthly revenue variations for Airbnb listings in Dollar is key to maximizing your short term rental income potential. Seasonality significantly impacts earnings. Our analysis, based on data from the past 12 months, shows that the peak revenue month for STRs in Dollar is typically July, while March often presents the lowest earnings, highlighting opportunities for strategic pricing adjustments during shoulder and low seasons. Explore the typical Airbnb income in Dollar across different performance tiers:
- Best-in-class properties (Top 10%) achieve $7,218+ monthly, often utilizing dynamic pricing and superior guest experiences.
- Strong performing properties (Top 25%) earn $5,214 or more, indicating effective management and desirable locations/amenities.
- Typical properties (Median) generate around $3,349 per month, representing the average market performance.
- Entry-level properties (Bottom 25%) see earnings around $1,938, often with potential for optimization.
Average Monthly Airbnb Earnings Trend in Dollar
Dollar Airbnb Occupancy Rate Trends (2025)
Maximize your bookings by understanding the Dollar STR occupancy trends. Seasonal demand shifts significantly influence how often properties are booked. Typically, Julysees the highest demand (peak season occupancy), while January experiences the lowest (low season). Effective strategies, like adjusting minimum stays or offering promotions, can boost occupancy during slower periods. Here's how different property tiers perform in Dollar:
- Best-in-class properties (Top 10%) achieve 87%+ occupancy, indicating high desirability and potentially optimized availability.
- Strong performing properties (Top 25%) maintain 75% or higher occupancy, suggesting good market fit and guest satisfaction.
- Typical properties (Median) have an occupancy rate around 56%.
- Entry-level properties (Bottom 25%) average 28% occupancy, potentially facing higher vacancy.
Average Monthly Occupancy Rate Trend in Dollar
Average Daily Rate (ADR) Airbnb Trends in Dollar (2025)
Effective short term rental pricing strategy in Dollar involves understanding monthly ADR fluctuations. The Average Daily Rate (ADR) for Airbnb in Dollar typically peaks in December and dips lowest during October. Leveraging Airbnb dynamic pricing tools or strategies based on this seasonality can significantly boost revenue. Here's a look at the typical nightly rates achieved:
- Best-in-class properties (Top 10%) command rates of $370+ per night, often due to premium features or locations.
- Strong performing properties (Top 25%) achieve nightly rates of $285 or more.
- Typical properties (Median) charge around $165 per night.
- Entry-level properties (Bottom 25%) earn around $136 per night.
Average Daily Rate (ADR) Trend by Month in Dollar
Get Live Dollar Market Intelligence 👇

Explore Real-time Analytics
Airbnb Seasonality Analysis & Trends in Dollar (2025)
Peak Season (July, August, October)
- Revenue averages $5,575 per month
- Occupancy rates average 67.0%
- Daily rates average $219
Shoulder Season
- Revenue averages $4,259 per month
- Occupancy maintains around 51.2%
- Daily rates hold near $218
Low Season (January, February, March)
- Revenue drops to average $2,788 per month
- Occupancy decreases to average 44.6%
- Daily rates adjust to average $226
Seasonality Insights for Dollar
- The Airbnb seasonality in Dollar shows highly seasonal trends requiring careful strategy. While the sections above show seasonal averages, it's also insightful to look at the extremes:
- During the high season, the absolute peak month showcases Dollar's highest earning potential, with monthly revenues capable of climbing to $6,176, occupancy reaching a high of 73.7%, and ADRs peaking at $237.
- Conversely, the slowest single month of the year, typically falling within the low season, marks the market's lowest point. In this month, revenue might dip to $2,622, occupancy could drop to 38.1%, and ADRs may adjust down to $208.
- Understanding both the seasonal averages and these monthly peaks and troughs in revenue, occupancy, and ADR is crucial for maximizing your Airbnb profit potential in Dollar.
Seasonal Strategies for Maximizing Profit
- Peak Season: Maximize revenue through premium pricing and potentially longer minimum stays. Ensure high availability.
- Low Season: Offer competitive pricing, special promotions (e.g., extended stay discounts), and flexible cancellation policies. Target off-season travelers like remote workers or budget-conscious guests.
- Shoulder Seasons: Implement dynamic pricing that balances peak and low rates. Target weekend travelers or specific events. Offer slightly more flexible terms than peak season.
- Regularly analyze your own performance against these Dollar seasonality benchmarks and adjust your pricing and availability strategy accordingly.
Best Areas for Airbnb Investment in Dollar (2025)
Exploring the top neighborhoods for short-term rentals in Dollar? This section highlights key areas, outlining why they are attractive for hosts and guests, along with notable local attractions. Consider these locations based on your target guest profile and investment strategy.
| Neighborhood / Area | Why Host Here? (Target Guests & Appeal) | Key Attractions & Landmarks |
|---|---|---|
| Dollar Village | A picturesque village known for its charming atmosphere and historical significance. Ideal for travelers looking for a peaceful retreat in the Scottish countryside, with access to nature and local heritage sites. | Dollar Glen, Castle Campbell, Old Mill, Dollar Park, The Clacks, Golf courses |
| Castle Campbell | Situated just above Dollar, this historic castle offers stunning views and attracts tourists interested in Scotland's rich history. A great spot for visitors who enjoy outdoor activities and historical exploration. | Castle Campbell, Dollar Glen, Nature walks, Historical tours, Photography spots |
| Stirling | A nearby city filled with history and culture, Stirling is a major attraction for tourists visiting ambitious sites such as Stirling Castle and the National Wallace Monument. | Stirling Castle, Wallace Monument, Old Town, Battle of Bannockburn Visitor Centre, Stirling Bridge |
| Alloa | A vibrant town with a mix of modern amenities and historic sites. Attracts guests interested in local experiences and is close to other notable attractions in Clackmannanshire. | Clackmannan Tower, Alloa Tower, Parks and gardens, Local breweries, Historical sites |
| Menstrie | Another charming village close to Dollar, known for its scenic views and peaceful environment. A perfect place for those seeking relaxation and outdoor pursuits. | Menstrie Glen, Local trails, Nature parks, Community festivals, Historic walks |
| Tullibody | Close to both Dollar and Stirling, Tullibody is a great spot for visitors who want to explore the region while enjoying a quieter atmosphere. | The River Alva, Local amenities, Small parks, Community events, Scenic views |
| Clackmannan | This small town provides a blend of heritage and natural beauty, attracting visitors looking for a more laid-back Scottish experience, with proximity to Dollar's attractions. | Clackmannan Tower, Nature reserves, Historic buildings, Community activities, Art installations |
| Bannockburn | Famous for its historical significance, this town is a key destination for history buffs, particularly those interested in Scottish battles and the fight for independence. | Battle of Bannockburn site, St. Ninians, Local historical trails, Scenic walks, Visitor Centre |
Understanding Airbnb License Requirements & STR Laws in Dollar (2025)
While Dollar, Scotland, United Kingdom currently shows low STR regulations, specific Airbnb license requirements might still exist or change. Always verify the latest short term rental regulations and Airbnb license requirements directly with local government authorities for Dollar to ensure full compliance before hosting.
(Source: AirROI data, 2025, based on 4% licensed listings)
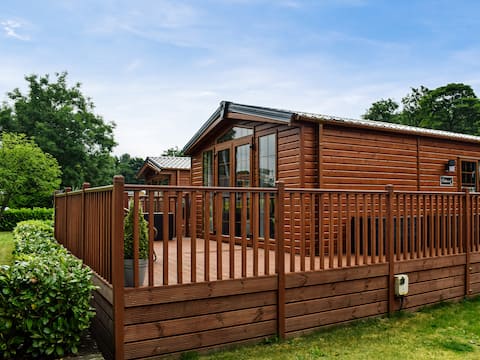
Top Performing Airbnb Properties in Dollar (2025)
Benchmark your potential! Explore examples of top-performing Airbnb properties in Dollarbased on Trailing Twelve Month (TTM) revenue. Analyze their characteristics, revenue, occupancy rate, and ADR to understand what drives success in this market.

DOLLARBEG CASTLE - The Tower - luxury 3 bed rental
Entire Place • 3 bedrooms

The Great Hall, Dollarbeg Castle
Entire Place • 2 bedrooms

the Orchard - uk7111
Entire Place • 3 bedrooms

'The Willows' on Dollarbeg Castle Estate
Entire Place • 3 bedrooms
Salmon Leap Lodge
Entire Place • 2 bedrooms

the Paddocks - uk7112
Entire Place • 2 bedrooms
Note: Performance varies based on location, size, amenities, seasonality, and management quality. Data reflects the past 12 months.
Top Performing Airbnb Hosts in Dollar (2025)
Learn from the best! This table showcases top-performing Airbnb hosts in Dollar based on the number of properties managed and estimated total revenue over the past year. Analyze their scale and performance metrics.
| Host Name | Properties | Grossing Revenue | Stay Reviews | Avg Rating |
|---|---|---|---|---|
| Cottages | 6 | $300,296 | 45 | 4.02/5.0 |
| Paul | 1 | $241,103 | 88 | 4.98/5.0 |
| Karen | 1 | $77,042 | 163 | 4.98/5.0 |
| Patrick | 2 | $70,045 | 173 | 4.98/5.0 |
| Kris | 1 | $61,068 | 43 | 4.98/5.0 |
| Pauline | 3 | $44,420 | 187 | 4.83/5.0 |
| Geoff & Marie | 1 | $41,950 | 229 | 4.97/5.0 |
| Caroline | 1 | $41,529 | 117 | 4.99/5.0 |
| Host #79824567 | 1 | $33,291 | 0 | 0.00/5.0 |
| Diane | 1 | $32,579 | 32 | 4.81/5.0 |
Analyzing the strategies of top hosts, such as their property selection, pricing, and guest communication, can offer valuable lessons for optimizing your own Airbnb operations in Dollar.
Dive Deeper: Advanced Dollar STR Market Data (2025)
Ready to unlock more insights? AirROI provides access to advanced metrics and comprehensive Airbnb data for Dollar. Explore detailed analytics beyond this report to refine your investment strategy, optimize pricing, and maximize your vacation rental profits.
Explore Advanced MetricsDollar Short-Term Rental Market Composition (2025): Property & Room Types
Room Type Distribution
Property Type Distribution
Market Composition Insights for Dollar
- The Dollar Airbnb market composition is heavily skewed towards Entire Home/Apt listings, which make up 92.6% of the 27 active rentals. This indicates strong guest preference for privacy and space.
- Looking at the property type distribution in Dollar, House properties are the most common (66.7%), reflecting the local real estate landscape.
- Houses represent a significant 66.7% portion, catering likely to families or larger groups.
- Smaller segments like others, outdoor/unique, hotel/boutique (combined 11.1%) offer potential for unique stay experiences.
Dollar Airbnb Room Capacity Analysis (2025): Bedroom Distribution
Distribution of Listings by Number of Bedrooms
Room Capacity Insights for Dollar
- The dominant room capacity in Dollar is 2 bedrooms listings, making up 51.9% of the market. This suggests a strong demand for properties suitable for couples or solo travelers.
- Together, 2 bedrooms and 3 bedrooms properties represent 74.1% of the active Airbnb listings in Dollar, indicating a high concentration in these sizes.
- A significant 25.9% of listings offer 3+ bedrooms, catering to larger groups and families seeking more space in Dollar.
Dollar Vacation Rental Guest Capacity Trends (2025)
Distribution of Listings by Guest Capacity
Guest Capacity Insights for Dollar
- The most common guest capacity trend in Dollar vacation rentals is listings accommodating 4 guests (40.7%). This suggests the primary traveler segment is likely small families or groups.
- Properties designed for 4 guests and 6 guests dominate the Dollar STR market, accounting for 62.9% of listings.
- 29.6% of properties accommodate 6+ guests, serving the market segment for larger families or group travel in Dollar.
- On average, properties in Dollar are equipped to host 4.1 guests.
Dollar Airbnb Booking Patterns (2025): Available vs. Booked Days
Available Days Distribution
Booked Days Distribution
Booking Pattern Insights for Dollar
- The most common availability pattern in Dollar falls within the 91-180 days range, representing 44.4% of listings. This suggests many properties have significant open periods on their calendars.
- Approximately 48.1% of listings show high availability (181+ days open annually), indicating potential for increased bookings or specific owner usage patterns.
- For booked days, the 181-270 days range is most frequent in Dollar (44.4%), reflecting common guest stay durations or potential owner blocking patterns.
- A notable 51.8% of properties secure long booking periods (181+ days booked per year), highlighting successful long-term rental strategies or significant owner usage.
Dollar Airbnb Minimum Stay Requirements Analysis
Distribution of Listings by Minimum Night Requirement
1 Night
7 listings
25.9% of total
2 Nights
8 listings
29.6% of total
3 Nights
5 listings
18.5% of total
4-6 Nights
2 listings
7.4% of total
30+ Nights
5 listings
18.5% of total
Key Insights
- The most prevalent minimum stay requirement in Dollar is 2 Nights, adopted by 29.6% of listings. This highlights the market's preference for shorter, flexible bookings.
- A significant segment (18.5%) caters to monthly stays (30+ nights) in Dollar, pointing to opportunities in the extended-stay market.
Recommendations
- Align with the market by considering a 2 Nights minimum stay, as 29.6% of Dollar hosts use this setting.
- If feasible, allowing 1-night stays, especially midweek or during low season, could capture last-minute bookings, as only 25.9% currently do.
- Explore offering discounts for stays of 30+ nights to attract the 18.5% of the market seeking extended stays.
- Adjust minimum nights based on seasonality – potentially shorter during low season and longer during peak demand periods in Dollar.
Dollar Airbnb Cancellation Policy Trends Analysis (2025)
Super Strict 60 Days
5 listings
20.8% of total
Flexible
2 listings
8.3% of total
Moderate
5 listings
20.8% of total
Firm
7 listings
29.2% of total
Strict
5 listings
20.8% of total
Cancellation Policy Insights for Dollar
- The prevailing Airbnb cancellation policy trend in Dollar is Firm, used by 29.2% of listings.
- There's a relatively balanced mix between guest-friendly (29.1%) and stricter (50.0%) policies, offering choices for different guest needs.
Recommendations for Hosts
- Consider adopting a Firm policy to align with the 29.2% market standard in Dollar.
- Regularly review your cancellation policy against competitors and market demand shifts in Dollar.
Dollar STR Booking Lead Time Analysis (2025)
Average Booking Lead Time by Month
Booking Lead Time Insights for Dollar
- The overall average booking lead time for vacation rentals in Dollar is 57 days.
- Guests book furthest in advance for stays during June (average 101 days), likely coinciding with peak travel demand or local events.
- The shortest booking windows occur for stays in March (average 41 days), indicating more last-minute travel plans during this time.
- Seasonally, Summer (93 days avg.) sees the longest lead times, while Winter (57 days avg.) has the shortest, reflecting typical travel planning cycles.
Recommendations for Hosts
- Use the overall average lead time (57 days) as a baseline for your pricing and availability strategy in Dollar.
- For June stays, consider implementing length-of-stay discounts or slightly higher rates for bookings made less than 101 days out to capitalize on advance planning.
- Target marketing efforts for the Summer season well in advance (at least 93 days) to capture early planners.
- Monitor your own booking lead times against these Dollar averages to identify opportunities for dynamic pricing adjustments.
Popular & Essential Airbnb Amenities in Dollar (2025)
Amenity Prevalence
Amenity Insights for Dollar
- Essential amenities in Dollar that guests expect include: Heating, Kitchen. Lacking these (any) could significantly impact bookings.
- Popular amenities like Smoke alarm, Wifi, Hangers are common but not universal. Offering these can provide a competitive edge.
- Warning: Wifi is not universally provided but is considered essential globally. Ensure reliable Wifi is offered.
Recommendations for Hosts
- Ensure your listing includes all essential amenities for Dollar: Heating, Kitchen.
- Prioritize adding missing essentials: Heating, Kitchen.
- Consider adding popular differentiators like Smoke alarm or Wifi to increase appeal.
- Highlight unique or less common amenities you offer (e.g., hot tub, dedicated workspace, EV charger) in your listing description and photos.
- Regularly check competitor amenities in Dollar to stay competitive.
Dollar Airbnb Guest Demographics & Profile Analysis (2025)
Guest Profile Summary for Dollar
- The typical guest profile for Airbnb in Dollar consists of a mix of domestic (49%) and international guests, with top international origins including United States, typically belonging to the Post-2000s (Gen Z/Alpha) group (50%), primarily speaking English or French.
- Domestic travelers account for 49.3% of guests.
- Key international markets include United Kingdom (49.3%) and United States (20.1%).
- Top languages spoken are English (56.5%) followed by French (10%).
- A significant demographic segment is the Post-2000s (Gen Z/Alpha) group, representing 50% of guests.
Recommendations for Hosts
- Balance marketing efforts between domestic and international channels based on the guest mix.
- Tailor amenities and listing descriptions to appeal to the dominant Post-2000s (Gen Z/Alpha) demographic (e.g., highlight fast WiFi, smart home features, local guides).
- Highlight unique local experiences or amenities relevant to the primary guest profile.
- Consider seasonal promotions aligned with peak travel times for key origin markets.
Nearby Short-Term Rental Market Comparison
How does the Dollar Airbnb market stack up against its neighbors? Compare key performance metrics like average monthly revenue, ADR, and occupancy rates in surrounding areas to understand the broader regional STR landscape.
| Market | Active Properties | Monthly Revenue | Daily Rate | Avg. Occupancy |
|---|---|---|---|---|
| Galston | 11 | $7,951 | $676.77 | 46% |
| Fearnan | 19 | $6,440 | $421.92 | 53% |
| Gorebridge | 12 | $6,209 | $493.62 | 54% |
| Bridge of Cally | 16 | $5,839 | $566.24 | 50% |
| Kirkhill | 10 | $5,719 | $700.26 | 44% |
| North Kessock | 10 | $5,421 | $380.62 | 58% |
| Foyers | 14 | $5,076 | $274.52 | 64% |
| Arrochar | 33 | $5,045 | $339.11 | 56% |
| Whitebridge | 10 | $4,907 | $417.35 | 42% |
| Acharn | 10 | $4,813 | $278.43 | 57% |