Cullen Airbnb Market Analysis 2025: Short Term Rental Data & Vacation Rental Statistics in Scotland, United Kingdom
Is Airbnb profitable in Cullen in 2025? Explore comprehensive Airbnb analytics for Cullen, Scotland, United Kingdom to uncover income potential. This 2025 STR market report for Cullen, based on AirROI data from April 2024 to March 2025, reveals key trends in the niche market of 37 active listings.
Whether you're considering an Airbnb investment in Cullen, optimizing your existing vacation rental, or exploring rental arbitrage opportunities, understanding the Cullen Airbnb data is crucial. Understanding the local regulations is key to maximizing your short term rental income potential. Let's dive into the specifics.
Key Cullen Airbnb Performance Metrics Overview
Monthly Airbnb Revenue Variations & Income Potential in Cullen (2025)
Understanding the monthly revenue variations for Airbnb listings in Cullen is key to maximizing your short term rental income potential. Seasonality significantly impacts earnings. Our analysis, based on data from the past 12 months, shows that the peak revenue month for STRs in Cullen is typically August, while November often presents the lowest earnings, highlighting opportunities for strategic pricing adjustments during shoulder and low seasons. Explore the typical Airbnb income in Cullen across different performance tiers:
- Best-in-class properties (Top 10%) achieve $4,952+ monthly, often utilizing dynamic pricing and superior guest experiences.
- Strong performing properties (Top 25%) earn $3,314 or more, indicating effective management and desirable locations/amenities.
- Typical properties (Median) generate around $2,157 per month, representing the average market performance.
- Entry-level properties (Bottom 25%) see earnings around $1,196, often with potential for optimization.
Average Monthly Airbnb Earnings Trend in Cullen
Cullen Airbnb Occupancy Rate Trends (2025)
Maximize your bookings by understanding the Cullen STR occupancy trends. Seasonal demand shifts significantly influence how often properties are booked. Typically, Augustsees the highest demand (peak season occupancy), while March experiences the lowest (low season). Effective strategies, like adjusting minimum stays or offering promotions, can boost occupancy during slower periods. Here's how different property tiers perform in Cullen:
- Best-in-class properties (Top 10%) achieve 71%+ occupancy, indicating high desirability and potentially optimized availability.
- Strong performing properties (Top 25%) maintain 57% or higher occupancy, suggesting good market fit and guest satisfaction.
- Typical properties (Median) have an occupancy rate around 40%.
- Entry-level properties (Bottom 25%) average 22% occupancy, potentially facing higher vacancy.
Average Monthly Occupancy Rate Trend in Cullen
Average Daily Rate (ADR) Airbnb Trends in Cullen (2025)
Effective short term rental pricing strategy in Cullen involves understanding monthly ADR fluctuations. The Average Daily Rate (ADR) for Airbnb in Cullen typically peaks in December and dips lowest during April. Leveraging Airbnb dynamic pricing tools or strategies based on this seasonality can significantly boost revenue. Here's a look at the typical nightly rates achieved:
- Best-in-class properties (Top 10%) command rates of $266+ per night, often due to premium features or locations.
- Strong performing properties (Top 25%) achieve nightly rates of $221 or more.
- Typical properties (Median) charge around $177 per night.
- Entry-level properties (Bottom 25%) earn around $132 per night.
Average Daily Rate (ADR) Trend by Month in Cullen
Get Live Cullen Market Intelligence 👇

Explore Real-time Analytics
Airbnb Seasonality Analysis & Trends in Cullen (2025)
Peak Season (August, July, June)
- Revenue averages $4,236 per month
- Occupancy rates average 62.7%
- Daily rates average $200
Shoulder Season
- Revenue averages $2,430 per month
- Occupancy maintains around 38.1%
- Daily rates hold near $196
Low Season (February, March, November)
- Revenue drops to average $1,542 per month
- Occupancy decreases to average 25.1%
- Daily rates adjust to average $196
Seasonality Insights for Cullen
- The Airbnb seasonality in Cullen shows highly seasonal trends requiring careful strategy. While the sections above show seasonal averages, it's also insightful to look at the extremes:
- During the high season, the absolute peak month showcases Cullen's highest earning potential, with monthly revenues capable of climbing to $4,532, occupancy reaching a high of 69.0%, and ADRs peaking at $207.
- Conversely, the slowest single month of the year, typically falling within the low season, marks the market's lowest point. In this month, revenue might dip to $1,404, occupancy could drop to 21.8%, and ADRs may adjust down to $186.
- Understanding both the seasonal averages and these monthly peaks and troughs in revenue, occupancy, and ADR is crucial for maximizing your Airbnb profit potential in Cullen.
Seasonal Strategies for Maximizing Profit
- Peak Season: Maximize revenue through premium pricing and potentially longer minimum stays. Ensure high availability.
- Low Season: Offer competitive pricing, special promotions (e.g., extended stay discounts), and flexible cancellation policies. Target off-season travelers like remote workers or budget-conscious guests.
- Shoulder Seasons: Implement dynamic pricing that balances peak and low rates. Target weekend travelers or specific events. Offer slightly more flexible terms than peak season.
- Regularly analyze your own performance against these Cullen seasonality benchmarks and adjust your pricing and availability strategy accordingly.
Best Areas for Airbnb Investment in Cullen (2025)
Exploring the top neighborhoods for short-term rentals in Cullen? This section highlights key areas, outlining why they are attractive for hosts and guests, along with notable local attractions. Consider these locations based on your target guest profile and investment strategy.
| Neighborhood / Area | Why Host Here? (Target Guests & Appeal) | Key Attractions & Landmarks |
|---|---|---|
| Cullen Beach | A beautiful sandy beach that attracts families and beachgoers during the summer. Perfect for hosts seeking to offer a relaxing coastal experience. | Cullen Beach, Cullen's historic fishing village, Cullen Harbour, Cullen Golf Club, The Bow Fiddle Rock |
| Cullen Village | A charming village atmosphere with local amenities. Great for travelers who want to explore the Scottish countryside and enjoy local hospitality. | Cullen Village Centre, Local pubs and restaurants, Historic architecture, Cullen's scenic coastal paths, Nearby hiking trails |
| Findlater Castle | Ruins of a medieval castle overlooking the sea, attracting history enthusiasts and explorers. Ideal for Airbnb hosts who want to provide a unique historical experience. | Findlater Castle ruins, Scenic coastal views, Hiking paths around the castle, Wildlife watching opportunities |
| Cullen Links Golf Course | A popular golf course offering stunning views of the Moray Firth. This attracts golf enthusiasts looking for a retreat with sporting activities. | Cullen Links Golf course, Golfing facilities, Local golf events, Scenic coastal scenery |
| Sandy Cove | A picturesque cove nearby, great for kayaking and other water sports. Ideal for adventure seekers and nature lovers. | Sandy Cove beach, Kayaking and water sports, Wildlife spotting, Walking paths along the coast |
| The Moray Coast Trail | A famous walking trail that runs along the coast, attracting walkers and nature lovers. Perfect for creating outdoor experiences for guests. | Moray Coast Trail, Breathtaking coastal views, Wildlife opportunities, Connecting local villages |
| Rathven | A nearby village with quiet charm and local character. Offers a more rural experience for tourists wanting to escape the hustle and bustle. | Rathven church, Rural landscapes, Local shops, Community events |
| Portknockie | Just a short distance from Cullen, offering stunning coastal scenery and attractions like the Bow Fiddle Rock. Popular with tourists looking to explore nearby areas. | Bow Fiddle Rock, Portknockie Harbour, Local eateries, Scenic walking routes |
Understanding Airbnb License Requirements & STR Laws in Cullen (2025)
With 16% of listings showing registration in 2025, understanding potential Airbnb license requirements is crucial in Cullen. Always verify the latest short term rental regulations and Airbnb license requirements directly with local government authorities for Cullen to ensure full compliance before hosting.
(Source: AirROI data, 2025, based on 16% licensed listings)
Top Performing Airbnb Properties in Cullen (2025)
Benchmark your potential! Explore examples of top-performing Airbnb properties in Cullenbased on Trailing Twelve Month (TTM) revenue. Analyze their characteristics, revenue, occupancy rate, and ADR to understand what drives success in this market.
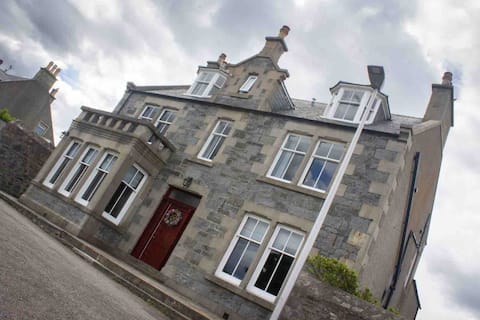
Crannoch Self Catering - 10 bedroom former hotel
Entire Place • 10 bedrooms
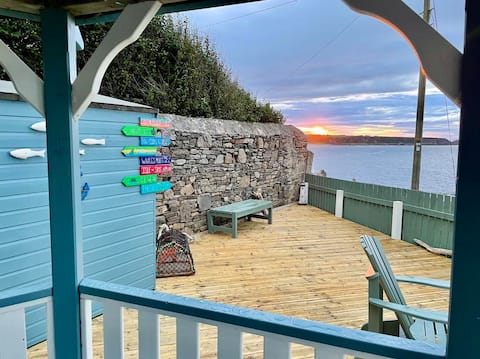
Hill Crest - cliff top cottage with stunning views
Entire Place • 4 bedrooms

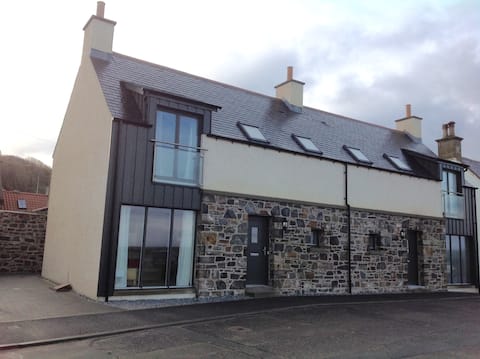
Renovated fishing cottage close to the beach
Entire Place • 3 bedrooms

Entire Place • 3 bedrooms

Sandpiper Cottage
Entire Place • 3 bedrooms
244 Seatown Cullen, Moray, Scotland.
Entire Place • 3 bedrooms
Note: Performance varies based on location, size, amenities, seasonality, and management quality. Data reflects the past 12 months.
Top Performing Airbnb Hosts in Cullen (2025)
Learn from the best! This table showcases top-performing Airbnb hosts in Cullen based on the number of properties managed and estimated total revenue over the past year. Analyze their scale and performance metrics.
| Host Name | Properties | Grossing Revenue | Stay Reviews | Avg Rating |
|---|---|---|---|---|
| David | 1 | $110,665 | 11 | 5.00/5.0 |
| Euan | 1 | $65,225 | 65 | 4.98/5.0 |
| Sykes Holiday Cottages Limited | 5 | $56,901 | 7 | 1.00/5.0 |
| Cottages | 4 | $54,320 | 51 | 4.78/5.0 |
| Lyndsay | 1 | $45,208 | 78 | 4.94/5.0 |
| Emily | 1 | $44,012 | 50 | 4.98/5.0 |
| Sandra | 1 | $41,744 | 47 | 4.98/5.0 |
| Simon | 1 | $37,793 | 7 | 5.00/5.0 |
| Sarah | 1 | $35,943 | 52 | 4.96/5.0 |
| Emma | 1 | $35,319 | 153 | 4.97/5.0 |
Analyzing the strategies of top hosts, such as their property selection, pricing, and guest communication, can offer valuable lessons for optimizing your own Airbnb operations in Cullen.
Dive Deeper: Advanced Cullen STR Market Data (2025)
Ready to unlock more insights? AirROI provides access to advanced metrics and comprehensive Airbnb data for Cullen. Explore detailed analytics beyond this report to refine your investment strategy, optimize pricing, and maximize your vacation rental profits.
Explore Advanced MetricsCullen Short-Term Rental Market Composition (2025): Property & Room Types
Room Type Distribution
Property Type Distribution
Market Composition Insights for Cullen
- The Cullen Airbnb market composition is heavily skewed towards Entire Home/Apt listings, which make up 97.3% of the 37 active rentals. This indicates strong guest preference for privacy and space.
- Looking at the property type distribution in Cullen, House properties are the most common (91.9%), reflecting the local real estate landscape.
- Houses represent a significant 91.9% portion, catering likely to families or larger groups.
Cullen Airbnb Room Capacity Analysis (2025): Bedroom Distribution
Distribution of Listings by Number of Bedrooms
Room Capacity Insights for Cullen
- The dominant room capacity in Cullen is 3 bedrooms listings, making up 48.6% of the market. This suggests a strong demand for properties suitable for families or small groups.
- Together, 3 bedrooms and 2 bedrooms properties represent 78.3% of the active Airbnb listings in Cullen, indicating a high concentration in these sizes.
- A significant 59.4% of listings offer 3+ bedrooms, catering to larger groups and families seeking more space in Cullen.
Cullen Vacation Rental Guest Capacity Trends (2025)
Distribution of Listings by Guest Capacity
Guest Capacity Insights for Cullen
- The most common guest capacity trend in Cullen vacation rentals is listings accommodating 6 guests (45.9%). This suggests the primary traveler segment is likely larger groups.
- Properties designed for 6 guests and 4 guests dominate the Cullen STR market, accounting for 67.5% of listings.
- 56.7% of properties accommodate 6+ guests, serving the market segment for larger families or group travel in Cullen.
- On average, properties in Cullen are equipped to host 5.3 guests.
Cullen Airbnb Booking Patterns (2025): Available vs. Booked Days
Available Days Distribution
Booked Days Distribution
Booking Pattern Insights for Cullen
- The most common availability pattern in Cullen falls within the 181-270 days range, representing 43.2% of listings. This suggests many properties have significant open periods on their calendars.
- Approximately 75.6% of listings show high availability (181+ days open annually), indicating potential for increased bookings or specific owner usage patterns.
- For booked days, the 91-180 days range is most frequent in Cullen (43.2%), reflecting common guest stay durations or potential owner blocking patterns.
- A notable 24.3% of properties secure long booking periods (181+ days booked per year), highlighting successful long-term rental strategies or significant owner usage.
Cullen Airbnb Minimum Stay Requirements Analysis
Distribution of Listings by Minimum Night Requirement
1 Night
5 listings
14.7% of total
2 Nights
4 listings
11.8% of total
3 Nights
12 listings
35.3% of total
4-6 Nights
3 listings
8.8% of total
7-29 Nights
2 listings
5.9% of total
30+ Nights
8 listings
23.5% of total
Key Insights
- The most prevalent minimum stay requirement in Cullen is 3 Nights, adopted by 35.3% of listings. This highlights the market's preference for longer commitments.
- A significant segment (23.5%) caters to monthly stays (30+ nights) in Cullen, pointing to opportunities in the extended-stay market.
Recommendations
- Align with the market by considering a 3 Nights minimum stay, as 35.3% of Cullen hosts use this setting.
- If feasible, allowing 1-night stays, especially midweek or during low season, could capture last-minute bookings, as only 14.7% currently do.
- Explore offering discounts for stays of 30+ nights to attract the 23.5% of the market seeking extended stays.
- Adjust minimum nights based on seasonality – potentially shorter during low season and longer during peak demand periods in Cullen.
Cullen Airbnb Cancellation Policy Trends Analysis (2025)
Super Strict 60 Days
5 listings
15.6% of total
Flexible
9 listings
28.1% of total
Moderate
3 listings
9.4% of total
Firm
6 listings
18.8% of total
Strict
9 listings
28.1% of total
Cancellation Policy Insights for Cullen
- The prevailing Airbnb cancellation policy trend in Cullen is Flexible, used by 28.1% of listings.
- There's a relatively balanced mix between guest-friendly (37.5%) and stricter (46.9%) policies, offering choices for different guest needs.
Recommendations for Hosts
- Consider adopting a Flexible policy to align with the 28.1% market standard in Cullen.
- Regularly review your cancellation policy against competitors and market demand shifts in Cullen.
Cullen STR Booking Lead Time Analysis (2025)
Average Booking Lead Time by Month
Booking Lead Time Insights for Cullen
- The overall average booking lead time for vacation rentals in Cullen is 66 days.
- Guests book furthest in advance for stays during July (average 152 days), likely coinciding with peak travel demand or local events.
- The shortest booking windows occur for stays in November (average 38 days), indicating more last-minute travel plans during this time.
- Seasonally, Summer (111 days avg.) sees the longest lead times, while Fall (46 days avg.) has the shortest, reflecting typical travel planning cycles.
Recommendations for Hosts
- Use the overall average lead time (66 days) as a baseline for your pricing and availability strategy in Cullen.
- For July stays, consider implementing length-of-stay discounts or slightly higher rates for bookings made less than 152 days out to capitalize on advance planning.
- Target marketing efforts for the Summer season well in advance (at least 111 days) to capture early planners.
- Monitor your own booking lead times against these Cullen averages to identify opportunities for dynamic pricing adjustments.
Popular & Essential Airbnb Amenities in Cullen (2025)
Amenity Prevalence
Amenity Insights for Cullen
- Essential amenities in Cullen that guests expect include: Smoke alarm, Heating, Wifi. Lacking these (any) could significantly impact bookings.
- Popular amenities like TV, Kitchen, Washer are common but not universal. Offering these can provide a competitive edge.
Recommendations for Hosts
- Ensure your listing includes all essential amenities for Cullen: Smoke alarm, Heating, Wifi.
- Prioritize adding missing essentials: Wifi.
- Consider adding popular differentiators like TV or Kitchen to increase appeal.
- Highlight unique or less common amenities you offer (e.g., hot tub, dedicated workspace, EV charger) in your listing description and photos.
- Regularly check competitor amenities in Cullen to stay competitive.
Cullen Airbnb Guest Demographics & Profile Analysis (2025)
Guest Profile Summary for Cullen
- The typical guest profile for Airbnb in Cullen consists of primarily domestic travelers (83%), often arriving from nearby Scotland, typically belonging to the Post-2000s (Gen Z/Alpha) group (50%), primarily speaking English or French.
- Domestic travelers account for 83.3% of guests.
- Key international markets include United Kingdom (83.3%) and United States (6.2%).
- Top languages spoken are English (69.6%) followed by French (8.7%).
- A significant demographic segment is the Post-2000s (Gen Z/Alpha) group, representing 50% of guests.
Recommendations for Hosts
- Target domestic marketing efforts towards travelers from Scotland and Edinburgh.
- Tailor amenities and listing descriptions to appeal to the dominant Post-2000s (Gen Z/Alpha) demographic (e.g., highlight fast WiFi, smart home features, local guides).
- Highlight unique local experiences or amenities relevant to the primary guest profile.
- Consider seasonal promotions aligned with peak travel times for key origin markets.
Nearby Short-Term Rental Market Comparison
How does the Cullen Airbnb market stack up against its neighbors? Compare key performance metrics like average monthly revenue, ADR, and occupancy rates in surrounding areas to understand the broader regional STR landscape.
| Market | Active Properties | Monthly Revenue | Daily Rate | Avg. Occupancy |
|---|---|---|---|---|
| Bridge of Cally | 16 | $5,839 | $566.24 | 50% |
| Kenmore | 10 | $4,507 | $430.34 | 41% |
| Insh | 14 | $4,473 | $289.96 | 63% |
| Auchtermuchty | 11 | $3,979 | $365.72 | 50% |
| Gleneagles | 10 | $3,964 | $284.15 | 45% |
| Leuchars | 16 | $3,949 | $400.90 | 43% |
| St Andrews | 359 | $3,908 | $373.13 | 50% |
| North Berwick | 94 | $3,893 | $330.02 | 52% |
| Gilmerton | 10 | $3,872 | $440.46 | 35% |
| Mount Melville | 15 | $3,842 | $264.66 | 46% |