Corran Airbnb Market Analysis 2025: Short Term Rental Data & Vacation Rental Statistics in Scotland, United Kingdom
Is Airbnb profitable in Corran in 2025? Explore comprehensive Airbnb analytics for Corran, Scotland, United Kingdom to uncover income potential. This 2025 STR market report for Corran, based on AirROI data from April 2024 to March 2025, reveals key trends in the niche market of 24 active listings.
Whether you're considering an Airbnb investment in Corran, optimizing your existing vacation rental, or exploring rental arbitrage opportunities, understanding the Corran Airbnb data is crucial. Navigating the high regulation landscape is key to maximizing your short term rental income potential. Let's dive into the specifics.
Key Corran Airbnb Performance Metrics Overview
Monthly Airbnb Revenue Variations & Income Potential in Corran (2025)
Understanding the monthly revenue variations for Airbnb listings in Corran is key to maximizing your short term rental income potential. Seasonality significantly impacts earnings. Our analysis, based on data from the past 12 months, shows that the peak revenue month for STRs in Corran is typically August, while January often presents the lowest earnings, highlighting opportunities for strategic pricing adjustments during shoulder and low seasons. Explore the typical Airbnb income in Corran across different performance tiers:
- Best-in-class properties (Top 10%) achieve $10,868+ monthly, often utilizing dynamic pricing and superior guest experiences.
- Strong performing properties (Top 25%) earn $7,249 or more, indicating effective management and desirable locations/amenities.
- Typical properties (Median) generate around $4,642 per month, representing the average market performance.
- Entry-level properties (Bottom 25%) see earnings around $2,852, often with potential for optimization.
Average Monthly Airbnb Earnings Trend in Corran
Corran Airbnb Occupancy Rate Trends (2025)
Maximize your bookings by understanding the Corran STR occupancy trends. Seasonal demand shifts significantly influence how often properties are booked. Typically, Augustsees the highest demand (peak season occupancy), while January experiences the lowest (low season). Effective strategies, like adjusting minimum stays or offering promotions, can boost occupancy during slower periods. Here's how different property tiers perform in Corran:
- Best-in-class properties (Top 10%) achieve 81%+ occupancy, indicating high desirability and potentially optimized availability.
- Strong performing properties (Top 25%) maintain 59% or higher occupancy, suggesting good market fit and guest satisfaction.
- Typical properties (Median) have an occupancy rate around 45%.
- Entry-level properties (Bottom 25%) average 34% occupancy, potentially facing higher vacancy.
Average Monthly Occupancy Rate Trend in Corran
Average Daily Rate (ADR) Airbnb Trends in Corran (2025)
Effective short term rental pricing strategy in Corran involves understanding monthly ADR fluctuations. The Average Daily Rate (ADR) for Airbnb in Corran typically peaks in August and dips lowest during April. Leveraging Airbnb dynamic pricing tools or strategies based on this seasonality can significantly boost revenue. Here's a look at the typical nightly rates achieved:
- Best-in-class properties (Top 10%) command rates of $573+ per night, often due to premium features or locations.
- Strong performing properties (Top 25%) achieve nightly rates of $482 or more.
- Typical properties (Median) charge around $348 per night.
- Entry-level properties (Bottom 25%) earn around $183 per night.
Average Daily Rate (ADR) Trend by Month in Corran
Get Live Corran Market Intelligence 👇

Explore Real-time Analytics
Airbnb Seasonality Analysis & Trends in Corran (2025)
Peak Season (August, July, May)
- Revenue averages $10,412 per month
- Occupancy rates average 78.5%
- Daily rates average $374
Shoulder Season
- Revenue averages $4,904 per month
- Occupancy maintains around 45.9%
- Daily rates hold near $340
Low Season (January, March, December)
- Revenue drops to average $2,561 per month
- Occupancy decreases to average 22.3%
- Daily rates adjust to average $333
Seasonality Insights for Corran
- The Airbnb seasonality in Corran shows highly seasonal trends requiring careful strategy. While the sections above show seasonal averages, it's also insightful to look at the extremes:
- During the high season, the absolute peak month showcases Corran's highest earning potential, with monthly revenues capable of climbing to $12,099, occupancy reaching a high of 86.5%, and ADRs peaking at $400.
- Conversely, the slowest single month of the year, typically falling within the low season, marks the market's lowest point. In this month, revenue might dip to $2,160, occupancy could drop to 16.3%, and ADRs may adjust down to $309.
- Understanding both the seasonal averages and these monthly peaks and troughs in revenue, occupancy, and ADR is crucial for maximizing your Airbnb profit potential in Corran.
Seasonal Strategies for Maximizing Profit
- Peak Season: Maximize revenue through premium pricing and potentially longer minimum stays. Ensure high availability.
- Low Season: Offer competitive pricing, special promotions (e.g., extended stay discounts), and flexible cancellation policies. Target off-season travelers like remote workers or budget-conscious guests.
- Shoulder Seasons: Implement dynamic pricing that balances peak and low rates. Target weekend travelers or specific events. Offer slightly more flexible terms than peak season.
- Regularly analyze your own performance against these Corran seasonality benchmarks and adjust your pricing and availability strategy accordingly.
Best Areas for Airbnb Investment in Corran (2025)
Exploring the top neighborhoods for short-term rentals in Corran? This section highlights key areas, outlining why they are attractive for hosts and guests, along with notable local attractions. Consider these locations based on your target guest profile and investment strategy.
| Neighborhood / Area | Why Host Here? (Target Guests & Appeal) | Key Attractions & Landmarks |
|---|---|---|
| Loch Corrib | A stunning freshwater lake surrounded by mountains, popular for fishing, boating, and outdoor activities. Ideal for guests seeking a serene nature escape. | Fishing on Loch Corrib, Nature trails, Picnic areas, Birdwatching, Boat rentals |
| Corran Point | A scenic viewpoint and local landmark, offering breathtaking views of the surrounding hills and lochs. Attracts visitors for photography and sightseeing. | Viewpoint, Walking trails, Picnic spots, Wildlife watching |
| Ardgour | A picturesque village that serves as a gateway to the beautiful highlands and ferry access to nearby areas, making it a great base for exploring. | Ferry to Morven, Hiking trails, Historic sites, Local pubs, Scenic drives |
| The Ardnamurchan Peninsula | One of the last great wildernesses in the UK, known for its stunning coastal scenery and outdoor adventure opportunities. | Ardnamurchan Lighthouse, Beaches, Wildlife tours, Hiking paths, Scenic views |
| Fort William | Known as the outdoor capital of the UK, it's close to Ben Nevis and draws adventure seekers year-round. | Ben Nevis, West Highland Way, Nevis Range Mountain Resort, Water sports on Loch Linnhe, Historic sites |
| Mallaig | A charming fishing village with ferry connections to the Isle of Skye. Attracts visitors for its coastal views and seafood. | Ferry to Skye, Harry Potter train route, Beaches, Local seafood restaurants, Fishing trips |
| Inverness | The capital of the Scottish Highlands, rich in history and culture, making it an ideal hub for exploring the Highlands. | Loch Ness, Urquhart Castle, Inverness Castle, Culloden Battlefield, Shopping and dining |
| Isle of Skye | Famous for its rugged landscapes and picturesque villages, it draws a large number of tourists seeking adventure and scenic beauty. | Fairy Pools, Portree, Old Man of Storr, Dunvegan Castle, Talisker Distillery |
Understanding Airbnb License Requirements & STR Laws in Corran (2025)
Yes, Corran, Scotland, United Kingdom enforces high STR regulations. Obtaining a license and ensuring compliance is almost certainly required according to current 2025 STR laws. Always verify the latest short term rental regulations and Airbnb license requirements directly with local government authorities for Corran to ensure full compliance before hosting.
(Source: AirROI data, 2025, based on 46% licensed listings)
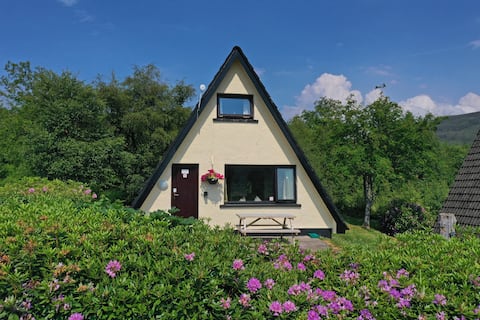
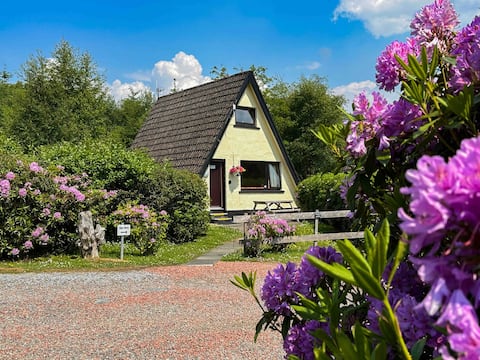
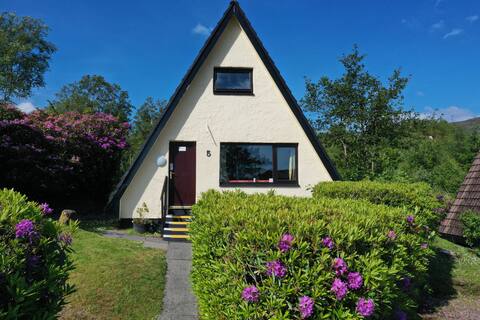
Top Performing Airbnb Properties in Corran (2025)
Benchmark your potential! Explore examples of top-performing Airbnb properties in Corranbased on Trailing Twelve Month (TTM) revenue. Analyze their characteristics, revenue, occupancy rate, and ADR to understand what drives success in this market.

Entire villa in stunning W Highland location.
Entire Place �• 4 bedrooms

Mill Cottage - Fort William
Entire Place • 5 bedrooms

Quiet Chalet near Glencoe, Loch & Mountain Views
Entire Place • 3 bedrooms
Quiet Chalet near Glencoe, Loch & Mountain Views
Entire Place • 3 bedrooms
Quiet Chalet near Glencoe, Loch & Mountain Views
Entire Place • 3 bedrooms
Quiet Chalet near Glencoe, Loch & Mountain Views
Entire Place • 3 bedrooms
Note: Performance varies based on location, size, amenities, seasonality, and management quality. Data reflects the past 12 months.
Top Performing Airbnb Hosts in Corran (2025)
Learn from the best! This table showcases top-performing Airbnb hosts in Corran based on the number of properties managed and estimated total revenue over the past year. Analyze their scale and performance metrics.
| Host Name | Properties | Grossing Revenue | Stay Reviews | Avg Rating |
|---|---|---|---|---|
| Justyna | 8 | $602,207 | 589 | 4.59/5.0 |
| Ben | 5 | $207,759 | 252 | 3.57/5.0 |
| Roberta | 1 | $183,863 | 107 | 4.94/5.0 |
| Pete | 2 | $154,999 | 369 | 4.66/5.0 |
| Cottages | 2 | $77,820 | 10 | 4.88/5.0 |
| Linda | 1 | $30,466 | 4 | 5.00/5.0 |
| James | 1 | $23,317 | 58 | 4.88/5.0 |
| Eileen | 1 | $15,143 | 128 | 4.85/5.0 |
| Rebekah | 1 | $14,692 | 3 | 5.00/5.0 |
| Jim | 2 | $7,704 | 20 | 4.90/5.0 |
Analyzing the strategies of top hosts, such as their property selection, pricing, and guest communication, can offer valuable lessons for optimizing your own Airbnb operations in Corran.
Dive Deeper: Advanced Corran STR Market Data (2025)
Ready to unlock more insights? AirROI provides access to advanced metrics and comprehensive Airbnb data for Corran. Explore detailed analytics beyond this report to refine your investment strategy, optimize pricing, and maximize your vacation rental profits.
Explore Advanced MetricsCorran Short-Term Rental Market Composition (2025): Property & Room Types
Room Type Distribution
Property Type Distribution
Market Composition Insights for Corran
- The Corran Airbnb market composition is heavily skewed towards Entire Home/Apt listings, which make up 75% of the 24 active rentals. This indicates strong guest preference for privacy and space.
- Looking at the property type distribution in Corran, House properties are the most common (54.2%), reflecting the local real estate landscape.
- Houses represent a significant 54.2% portion, catering likely to families or larger groups.
- The presence of 16.7% Hotel/Boutique listings indicates integration with traditional hospitality.
Corran Airbnb Room Capacity Analysis (2025): Bedroom Distribution
Distribution of Listings by Number of Bedrooms
Room Capacity Insights for Corran
- The dominant room capacity in Corran is 3 bedrooms listings, making up 37.5% of the market. This suggests a strong demand for properties suitable for families or small groups.
- Together, 3 bedrooms and 2 bedrooms properties represent 62.5% of the active Airbnb listings in Corran, indicating a high concentration in these sizes.
- A significant 50.0% of listings offer 3+ bedrooms, catering to larger groups and families seeking more space in Corran.
Corran Vacation Rental Guest Capacity Trends (2025)
Distribution of Listings by Guest Capacity
Guest Capacity Insights for Corran
- The most common guest capacity trend in Corran vacation rentals is listings accommodating 4 guests (29.2%). This suggests the primary traveler segment is likely small families or groups.
- Properties designed for 4 guests and 6 guests dominate the Corran STR market, accounting for 58.4% of listings.
- 45.9% of properties accommodate 6+ guests, serving the market segment for larger families or group travel in Corran.
- On average, properties in Corran are equipped to host 4.8 guests.
Corran Airbnb Booking Patterns (2025): Available vs. Booked Days
Available Days Distribution
Booked Days Distribution
Booking Pattern Insights for Corran
- The most common availability pattern in Corran falls within the 181-270 days range, representing 62.5% of listings. This suggests many properties have significant open periods on their calendars.
- Approximately 79.2% of listings show high availability (181+ days open annually), indicating potential for increased bookings or specific owner usage patterns.
- For booked days, the 91-180 days range is most frequent in Corran (58.3%), reflecting common guest stay durations or potential owner blocking patterns.
- A notable 25.0% of properties secure long booking periods (181+ days booked per year), highlighting successful long-term rental strategies or significant owner usage.
Corran Airbnb Minimum Stay Requirements Analysis
Distribution of Listings by Minimum Night Requirement
1 Night
16 listings
69.6% of total
2 Nights
3 listings
13% of total
3 Nights
3 listings
13% of total
30+ Nights
1 listings
4.3% of total
Key Insights
- The most prevalent minimum stay requirement in Corran is 1 Night, adopted by 69.6% of listings. This highlights the market's preference for shorter, flexible bookings.
- A strong majority (82.6%) of the Corran Airbnb data shows acceptance of very short stays (1-2 nights), indicating a dynamic, high-turnover market.
Recommendations
- Align with the market by considering a 1 Night minimum stay, as 69.6% of Corran hosts use this setting.
- Adjust minimum nights based on seasonality – potentially shorter during low season and longer during peak demand periods in Corran.
Corran Airbnb Cancellation Policy Trends Analysis (2025)
Super Strict 60 Days
2 listings
8.7% of total
Flexible
4 listings
17.4% of total
Moderate
5 listings
21.7% of total
Firm
1 listings
4.3% of total
Strict
11 listings
47.8% of total
Cancellation Policy Insights for Corran
- The prevailing Airbnb cancellation policy trend in Corran is Strict, used by 47.8% of listings.
- A majority (52.1%) of hosts in Corran utilize Firm or Strict policies, indicating a market where hosts prioritize booking security.
Recommendations for Hosts
- Consider adopting a Strict policy to align with the 47.8% market standard in Corran.
- With 47.8% using Strict terms, this is a viable option in Corran, particularly for high-value properties or during peak demand periods.
- Regularly review your cancellation policy against competitors and market demand shifts in Corran.
Corran STR Booking Lead Time Analysis (2025)
Average Booking Lead Time by Month
Booking Lead Time Insights for Corran
- The overall average booking lead time for vacation rentals in Corran is 69 days.
- Guests book furthest in advance for stays during November (average 104 days), likely coinciding with peak travel demand or local events.
- The shortest booking windows occur for stays in October (average 43 days), indicating more last-minute travel plans during this time.
- Seasonally, Summer (89 days avg.) sees the longest lead times, while Winter (55 days avg.) has the shortest, reflecting typical travel planning cycles.
Recommendations for Hosts
- Use the overall average lead time (69 days) as a baseline for your pricing and availability strategy in Corran.
- For November stays, consider implementing length-of-stay discounts or slightly higher rates for bookings made less than 104 days out to capitalize on advance planning.
- Target marketing efforts for the Summer season well in advance (at least 89 days) to capture early planners.
- Monitor your own booking lead times against these Corran averages to identify opportunities for dynamic pricing adjustments.
Popular & Essential Airbnb Amenities in Corran (2025)
Amenity Prevalence
Amenity Insights for Corran
- Essential amenities in Corran that guests expect include: Free parking on premises, Hangers, Washer, Heating, TV, Smoke alarm. Lacking these (any) could significantly impact bookings.
- Popular amenities like Cooking basics, Hot water, Wifi are common but not universal. Offering these can provide a competitive edge.
- Warning: Wifi is not universally provided but is considered essential globally. Ensure reliable Wifi is offered.
Recommendations for Hosts
- Ensure your listing includes all essential amenities for Corran: Free parking on premises, Hangers, Washer, Heating, TV, Smoke alarm.
- Prioritize adding missing essentials: Hangers, Washer, Heating, TV, Smoke alarm.
- Consider adding popular differentiators like Cooking basics or Hot water to increase appeal.
- Highlight unique or less common amenities you offer (e.g., hot tub, dedicated workspace, EV charger) in your listing description and photos.
- Regularly check competitor amenities in Corran to stay competitive.
Corran Airbnb Guest Demographics & Profile Analysis (2025)
Guest Profile Summary for Corran
- The typical guest profile for Airbnb in Corran consists of a mix of domestic (38%) and international guests, with top international origins including United States, typically belonging to the Post-2000s (Gen Z/Alpha) group (50%), primarily speaking English or French.
- Domestic travelers account for 38.4% of guests.
- Key international markets include United Kingdom (38.4%) and United States (16.8%).
- Top languages spoken are English (48.6%) followed by French (10.4%).
- A significant demographic segment is the Post-2000s (Gen Z/Alpha) group, representing 50% of guests.
Recommendations for Hosts
- Focus marketing internationally, particularly towards travelers from United States.
- Tailor amenities and listing descriptions to appeal to the dominant Post-2000s (Gen Z/Alpha) demographic (e.g., highlight fast WiFi, smart home features, local guides).
- Highlight unique local experiences or amenities relevant to the primary guest profile.
- Consider seasonal promotions aligned with peak travel times for key origin markets.
Nearby Short-Term Rental Market Comparison
How does the Corran Airbnb market stack up against its neighbors? Compare key performance metrics like average monthly revenue, ADR, and occupancy rates in surrounding areas to understand the broader regional STR landscape.
| Market | Active Properties | Monthly Revenue | Daily Rate | Avg. Occupancy |
|---|---|---|---|---|
| Galston | 11 | $7,951 | $676.77 | 46% |
| Fearnan | 19 | $6,440 | $421.92 | 53% |
| Kirkhill | 10 | $5,719 | $700.26 | 44% |
| Glenachulish | 33 | $5,609 | $424.51 | 46% |
| North Kessock | 10 | $5,421 | $380.62 | 58% |
| Carbost | 26 | $5,209 | $324.31 | 62% |
| Foyers | 14 | $5,076 | $274.52 | 64% |
| Arrochar | 33 | $5,045 | $339.11 | 56% |
| Whitebridge | 10 | $4,907 | $417.35 | 42% |
| Port Failthe | 14 | $4,832 | $301.12 | 57% |