Comrie Airbnb Market Analysis 2025: Short Term Rental Data & Vacation Rental Statistics in Scotland, United Kingdom
Is Airbnb profitable in Comrie in 2025? Explore comprehensive Airbnb analytics for Comrie, Scotland, United Kingdom to uncover income potential. This 2025 STR market report for Comrie, based on AirROI data from April 2024 to March 2025, reveals key trends in the niche market of 37 active listings.
Whether you're considering an Airbnb investment in Comrie, optimizing your existing vacation rental, or exploring rental arbitrage opportunities, understanding the Comrie Airbnb data is crucial. Navigating the high regulation landscape is key to maximizing your short term rental income potential. Let's dive into the specifics.
Key Comrie Airbnb Performance Metrics Overview
Monthly Airbnb Revenue Variations & Income Potential in Comrie (2025)
Understanding the monthly revenue variations for Airbnb listings in Comrie is key to maximizing your short term rental income potential. Seasonality significantly impacts earnings. Our analysis, based on data from the past 12 months, shows that the peak revenue month for STRs in Comrie is typically August, while November often presents the lowest earnings, highlighting opportunities for strategic pricing adjustments during shoulder and low seasons. Explore the typical Airbnb income in Comrie across different performance tiers:
- Best-in-class properties (Top 10%) achieve $5,964+ monthly, often utilizing dynamic pricing and superior guest experiences.
- Strong performing properties (Top 25%) earn $4,376 or more, indicating effective management and desirable locations/amenities.
- Typical properties (Median) generate around $2,781 per month, representing the average market performance.
- Entry-level properties (Bottom 25%) see earnings around $1,504, often with potential for optimization.
Average Monthly Airbnb Earnings Trend in Comrie
Comrie Airbnb Occupancy Rate Trends (2025)
Maximize your bookings by understanding the Comrie STR occupancy trends. Seasonal demand shifts significantly influence how often properties are booked. Typically, Septembersees the highest demand (peak season occupancy), while March experiences the lowest (low season). Effective strategies, like adjusting minimum stays or offering promotions, can boost occupancy during slower periods. Here's how different property tiers perform in Comrie:
- Best-in-class properties (Top 10%) achieve 84%+ occupancy, indicating high desirability and potentially optimized availability.
- Strong performing properties (Top 25%) maintain 64% or higher occupancy, suggesting good market fit and guest satisfaction.
- Typical properties (Median) have an occupancy rate around 41%.
- Entry-level properties (Bottom 25%) average 18% occupancy, potentially facing higher vacancy.
Average Monthly Occupancy Rate Trend in Comrie
Average Daily Rate (ADR) Airbnb Trends in Comrie (2025)
Effective short term rental pricing strategy in Comrie involves understanding monthly ADR fluctuations. The Average Daily Rate (ADR) for Airbnb in Comrie typically peaks in December and dips lowest during April. Leveraging Airbnb dynamic pricing tools or strategies based on this seasonality can significantly boost revenue. Here's a look at the typical nightly rates achieved:
- Best-in-class properties (Top 10%) command rates of $404+ per night, often due to premium features or locations.
- Strong performing properties (Top 25%) achieve nightly rates of $309 or more.
- Typical properties (Median) charge around $222 per night.
- Entry-level properties (Bottom 25%) earn around $148 per night.
Average Daily Rate (ADR) Trend by Month in Comrie
Get Live Comrie Market Intelligence 👇

Explore Real-time Analytics
Airbnb Seasonality Analysis & Trends in Comrie (2025)
Peak Season (August, July, May)
- Revenue averages $4,134 per month
- Occupancy rates average 50.7%
- Daily rates average $240
Shoulder Season
- Revenue averages $3,174 per month
- Occupancy maintains around 43.5%
- Daily rates hold near $240
Low Season (February, March, November)
- Revenue drops to average $2,190 per month
- Occupancy decreases to average 34.5%
- Daily rates adjust to average $252
Seasonality Insights for Comrie
- The Airbnb seasonality in Comrie shows moderate seasonality with distinct peak and low periods. While the sections above show seasonal averages, it's also insightful to look at the extremes:
- During the high season, the absolute peak month showcases Comrie's highest earning potential, with monthly revenues capable of climbing to $4,254, occupancy reaching a high of 54.1%, and ADRs peaking at $270.
- Conversely, the slowest single month of the year, typically falling within the low season, marks the market's lowest point. In this month, revenue might dip to $2,086, occupancy could drop to 33.2%, and ADRs may adjust down to $223.
- Understanding both the seasonal averages and these monthly peaks and troughs in revenue, occupancy, and ADR is crucial for maximizing your Airbnb profit potential in Comrie.
Seasonal Strategies for Maximizing Profit
- Peak Season: Maximize revenue through premium pricing and potentially longer minimum stays. Ensure high availability.
- Low Season: Offer competitive pricing, special promotions (e.g., extended stay discounts), and flexible cancellation policies. Target off-season travelers like remote workers or budget-conscious guests.
- Shoulder Seasons: Implement dynamic pricing that balances peak and low rates. Target weekend travelers or specific events. Offer slightly more flexible terms than peak season.
- Regularly analyze your own performance against these Comrie seasonality benchmarks and adjust your pricing and availability strategy accordingly.
Best Areas for Airbnb Investment in Comrie (2025)
Exploring the top neighborhoods for short-term rentals in Comrie? This section highlights key areas, outlining why they are attractive for hosts and guests, along with notable local attractions. Consider these locations based on your target guest profile and investment strategy.
| Neighborhood / Area | Why Host Here? (Target Guests & Appeal) | Key Attractions & Landmarks |
|---|---|---|
| Comrie Village | A picturesque Scottish village known for its stunning surroundings, historical architecture, and community feel. It's a great spot for travelers looking to experience local culture and nature. | Comrie Croft, Dunkeld and Birnam, The Comrie Heritage Centre, Crieff Hydro Resort, Drummond Castle Gardens |
| The Meadows | The Meadows offers beautiful green spaces and is ideal for families and outdoor enthusiasts. It’s situated near walking trails and parks, attracting visitors who appreciate nature and leisure activities. | Meadows Park, Walking and cycling paths, River Earn, Local nature reserves, Birdwatching opportunities |
| Dunkeld | A charming town close to Comrie, Dunkeld features stunning architecture and access to the River Tay. It attracts visitors interested in history, nature, and outdoor sports. | Dunkeld Cathedral, Hermitage Forest, River Tay walks, Beatrix Potter Exhibition, Atholl Palce Museum |
| Crieff | Crieff is known for its Victorian architecture and is a hub for outdoor activities. It's a popular destination for those looking for leisure and wellness retreats, particularly in mid-range to luxury segments. | Crieff Hydro Spa, The Glenturret Distillery, Crieff Visitor Centre, Nature trails, Local shops and restaurants |
| The Trossachs National Park | Located a short drive from Comrie, this national park is an outdoor paradise, appealing to adventure travelers and families alike with its stunning landscapes and recreational opportunities. | Loch Katrine, Ben A’an, The Great Trossachs Forest, Water sports on the loch, Hiking trails |
| St Fillans | A beautiful village by Loch Earn, attractive to couples and nature lovers, known for its romantic settings and tranquil environment, ideal for a getaway. | Loch Earn, St Fillans Village Hall, Water sports, Fishing, Local cafes and restaurants |
| Muthill | A small village with historical significance, Muthill offers a quiet retreat for guests seeking a rural experience while being close to Crieff and other attractions. | Muthill Parish Church, Historical ruins, Local walking trails, Community events, Scenic countryside |
| Aberfeldy | A vibrant town with a historic center, Aberfeldy offers a mix of culture, history and outdoor pursuits, appealing to a broad demographic of travelers. | Birks of Aberfeldy, Highland Perthshire Cycling, Dewar’s Aberfeldy Distillery, Local arts and crafts shops, River Tay walks |
Understanding Airbnb License Requirements & STR Laws in Comrie (2025)
Yes, Comrie, Scotland, United Kingdom enforces high STR regulations. Obtaining a license and ensuring compliance is almost certainly required according to current 2025 STR laws. Always verify the latest short term rental regulations and Airbnb license requirements directly with local government authorities for Comrie to ensure full compliance before hosting.
(Source: AirROI data, 2025, based on 41% licensed listings)
Top Performing Airbnb Properties in Comrie (2025)
Benchmark your potential! Explore examples of top-performing Airbnb properties in Comriebased on Trailing Twelve Month (TTM) revenue. Analyze their characteristics, revenue, occupancy rate, and ADR to understand what drives success in this market.

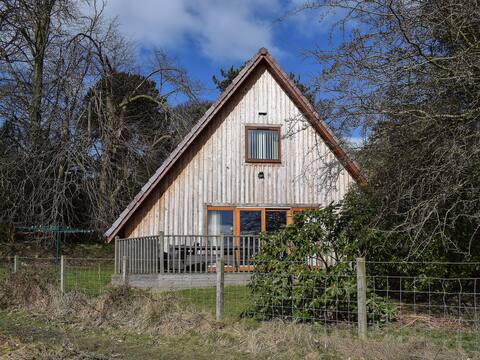
Spacious, Secluded Cottage in Peaceful Perthshire
Entire Place • 4 bedrooms
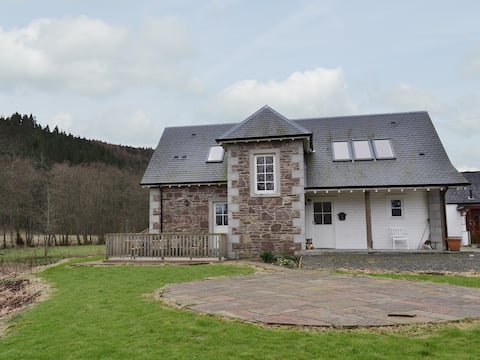
Lime Tree Cottage
Entire Place • 3 bedrooms
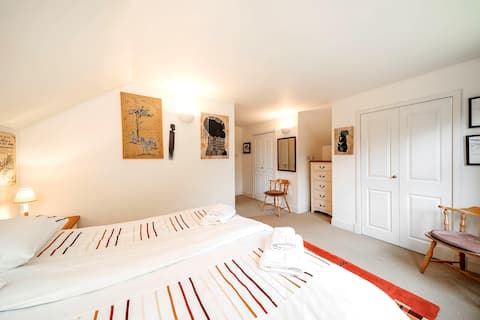
Mill Cottage
Entire Place • 3 bedrooms
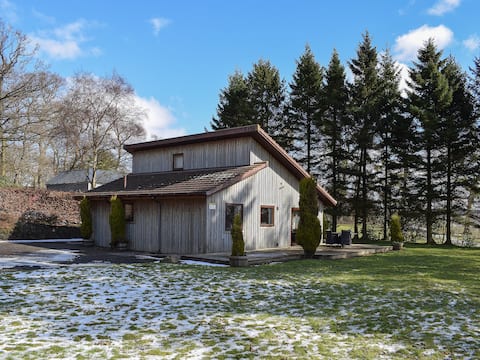
Earnside Cottage, with charming riverside views
Entire Place • 3 bedrooms
Inzievar
Entire Place • 3 bedrooms
Newcroft Cottage, by the river in heart of Comrie
Entire Place • 3 bedrooms
Note: Performance varies based on location, size, amenities, seasonality, and management quality. Data reflects the past 12 months.
Top Performing Airbnb Hosts in Comrie (2025)
Learn from the best! This table showcases top-performing Airbnb hosts in Comrie based on the number of properties managed and estimated total revenue over the past year. Analyze their scale and performance metrics.
| Host Name | Properties | Grossing Revenue | Stay Reviews | Avg Rating |
|---|---|---|---|---|
| Cottages | 9 | $354,259 | 149 | 3.84/5.0 |
| Elizabeth | 4 | $121,649 | 178 | 4.95/5.0 |
| Laura | 1 | $72,450 | 40 | 4.88/5.0 |
| Shirley | 2 | $60,424 | 17 | 5.00/5.0 |
| Shona | 1 | $57,709 | 49 | 4.86/5.0 |
| Marianne | 1 | $45,106 | 36 | 4.97/5.0 |
| Grant | 5 | $41,294 | 112 | 4.83/5.0 |
| Marc | 1 | $35,624 | 116 | 4.97/5.0 |
| Jaine | 1 | $34,697 | 39 | 4.97/5.0 |
| Alice | 1 | $34,346 | 61 | 4.98/5.0 |
Analyzing the strategies of top hosts, such as their property selection, pricing, and guest communication, can offer valuable lessons for optimizing your own Airbnb operations in Comrie.
Dive Deeper: Advanced Comrie STR Market Data (2025)
Ready to unlock more insights? AirROI provides access to advanced metrics and comprehensive Airbnb data for Comrie. Explore detailed analytics beyond this report to refine your investment strategy, optimize pricing, and maximize your vacation rental profits.
Explore Advanced MetricsComrie Short-Term Rental Market Composition (2025): Property & Room Types
Room Type Distribution
Property Type Distribution
Market Composition Insights for Comrie
- The Comrie Airbnb market composition is heavily skewed towards Entire Home/Apt listings, which make up 89.2% of the 37 active rentals. This indicates strong guest preference for privacy and space.
- Looking at the property type distribution in Comrie, House properties are the most common (83.8%), reflecting the local real estate landscape.
- Houses represent a significant 83.8% portion, catering likely to families or larger groups.
- The presence of 8.1% Hotel/Boutique listings indicates integration with traditional hospitality.
- Smaller segments like apartment/condo (combined 2.7%) offer potential for unique stay experiences.
Comrie Airbnb Room Capacity Analysis (2025): Bedroom Distribution
Distribution of Listings by Number of Bedrooms
Room Capacity Insights for Comrie
- The dominant room capacity in Comrie is 3 bedrooms listings, making up 37.8% of the market. This suggests a strong demand for properties suitable for families or small groups.
- Together, 3 bedrooms and 2 bedrooms properties represent 67.5% of the active Airbnb listings in Comrie, indicating a high concentration in these sizes.
- A significant 48.6% of listings offer 3+ bedrooms, catering to larger groups and families seeking more space in Comrie.
Comrie Vacation Rental Guest Capacity Trends (2025)
Distribution of Listings by Guest Capacity
Guest Capacity Insights for Comrie
- The most common guest capacity trend in Comrie vacation rentals is listings accommodating 6 guests (29.7%). This suggests the primary traveler segment is likely larger groups.
- Properties designed for 6 guests and 2 guests dominate the Comrie STR market, accounting for 56.7% of listings.
- 37.8% of properties accommodate 6+ guests, serving the market segment for larger families or group travel in Comrie.
- On average, properties in Comrie are equipped to host 4.4 guests.
Comrie Airbnb Booking Patterns (2025): Available vs. Booked Days
Available Days Distribution
Booked Days Distribution
Booking Pattern Insights for Comrie
- The most common availability pattern in Comrie falls within the 271-366 days range, representing 48.6% of listings. This suggests many properties have significant open periods on their calendars.
- Approximately 62.1% of listings show high availability (181+ days open annually), indicating potential for increased bookings or specific owner usage patterns.
- For booked days, the 181-270 days range is most frequent in Comrie (29.7%), reflecting common guest stay durations or potential owner blocking patterns.
- A notable 37.8% of properties secure long booking periods (181+ days booked per year), highlighting successful long-term rental strategies or significant owner usage.
Comrie Airbnb Minimum Stay Requirements Analysis
Distribution of Listings by Minimum Night Requirement
1 Night
11 listings
29.7% of total
2 Nights
10 listings
27% of total
3 Nights
7 listings
18.9% of total
4-6 Nights
1 listings
2.7% of total
30+ Nights
8 listings
21.6% of total
Key Insights
- The most prevalent minimum stay requirement in Comrie is 1 Night, adopted by 29.7% of listings. This highlights the market's preference for shorter, flexible bookings.
- A significant segment (21.6%) caters to monthly stays (30+ nights) in Comrie, pointing to opportunities in the extended-stay market.
Recommendations
- Align with the market by considering a 1 Night minimum stay, as 29.7% of Comrie hosts use this setting.
- If feasible, allowing 1-night stays, especially midweek or during low season, could capture last-minute bookings, as only 29.7% currently do.
- Explore offering discounts for stays of 30+ nights to attract the 21.6% of the market seeking extended stays.
- Adjust minimum nights based on seasonality – potentially shorter during low season and longer during peak demand periods in Comrie.
Comrie Airbnb Cancellation Policy Trends Analysis (2025)
Super Strict 60 Days
8 listings
24.2% of total
Super Strict 30 Days
5 listings
15.2% of total
Flexible
4 listings
12.1% of total
Moderate
6 listings
18.2% of total
Firm
6 listings
18.2% of total
Strict
4 listings
12.1% of total
Cancellation Policy Insights for Comrie
- The prevailing Airbnb cancellation policy trend in Comrie is Super Strict 60 Days, used by 24.2% of listings.
- There's a relatively balanced mix between guest-friendly (30.3%) and stricter (30.3%) policies, offering choices for different guest needs.
Recommendations for Hosts
- Consider adopting a Super Strict 60 Days policy to align with the 24.2% market standard in Comrie.
- Using a Strict policy might deter some guests, as only 12.1% of listings use it. Evaluate if potential revenue protection outweighs possible lower booking rates.
- Regularly review your cancellation policy against competitors and market demand shifts in Comrie.
Comrie STR Booking Lead Time Analysis (2025)
Average Booking Lead Time by Month
Booking Lead Time Insights for Comrie
- The overall average booking lead time for vacation rentals in Comrie is 57 days.
- Guests book furthest in advance for stays during May (average 79 days), likely coinciding with peak travel demand or local events.
- The shortest booking windows occur for stays in February (average 43 days), indicating more last-minute travel plans during this time.
- Seasonally, Spring (64 days avg.) sees the longest lead times, while Winter (56 days avg.) has the shortest, reflecting typical travel planning cycles.
Recommendations for Hosts
- Use the overall average lead time (57 days) as a baseline for your pricing and availability strategy in Comrie.
- For May stays, consider implementing length-of-stay discounts or slightly higher rates for bookings made less than 79 days out to capitalize on advance planning.
- Target marketing efforts for the Spring season well in advance (at least 64 days) to capture early planners.
- Monitor your own booking lead times against these Comrie averages to identify opportunities for dynamic pricing adjustments.
Popular & Essential Airbnb Amenities in Comrie (2025)
Amenity Prevalence
Amenity Insights for Comrie
- Essential amenities in Comrie that guests expect include: Heating, Wifi, Smoke alarm. Lacking these (any) could significantly impact bookings.
- Popular amenities like TV, Kitchen, Hangers are common but not universal. Offering these can provide a competitive edge.
Recommendations for Hosts
- Ensure your listing includes all essential amenities for Comrie: Heating, Wifi, Smoke alarm.
- Prioritize adding missing essentials: Heating, Wifi, Smoke alarm.
- Consider adding popular differentiators like TV or Kitchen to increase appeal.
- Highlight unique or less common amenities you offer (e.g., hot tub, dedicated workspace, EV charger) in your listing description and photos.
- Regularly check competitor amenities in Comrie to stay competitive.
Comrie Airbnb Guest Demographics & Profile Analysis (2025)
Guest Profile Summary for Comrie
- The typical guest profile for Airbnb in Comrie consists of primarily domestic travelers (81%), often arriving from nearby England, typically belonging to the Post-2000s (Gen Z/Alpha) group (50%), primarily speaking English or French.
- Domestic travelers account for 81.4% of guests.
- Key international markets include United Kingdom (81.4%) and United States (4.2%).
- Top languages spoken are English (72.4%) followed by French (9.2%).
- A significant demographic segment is the Post-2000s (Gen Z/Alpha) group, representing 50% of guests.
Recommendations for Hosts
- Target domestic marketing efforts towards travelers from England and Edinburgh.
- Tailor amenities and listing descriptions to appeal to the dominant Post-2000s (Gen Z/Alpha) demographic (e.g., highlight fast WiFi, smart home features, local guides).
- Highlight unique local experiences or amenities relevant to the primary guest profile.
- Consider seasonal promotions aligned with peak travel times for key origin markets.
Nearby Short-Term Rental Market Comparison
How does the Comrie Airbnb market stack up against its neighbors? Compare key performance metrics like average monthly revenue, ADR, and occupancy rates in surrounding areas to understand the broader regional STR landscape.
| Market | Active Properties | Monthly Revenue | Daily Rate | Avg. Occupancy |
|---|---|---|---|---|
| Galston | 11 | $7,951 | $676.77 | 46% |
| Fearnan | 19 | $6,440 | $421.92 | 53% |
| Gorebridge | 12 | $6,209 | $493.62 | 54% |
| Bridge of Cally | 16 | $5,839 | $566.24 | 50% |
| Kirkhill | 10 | $5,719 | $700.26 | 44% |
| North Kessock | 10 | $5,421 | $380.62 | 58% |
| Foyers | 14 | $5,076 | $274.52 | 64% |
| Arrochar | 33 | $5,045 | $339.11 | 56% |
| Whitebridge | 10 | $4,907 | $417.35 | 42% |
| Acharn | 10 | $4,813 | $278.43 | 57% |