Charleston Airbnb Market Analysis 2025: Short Term Rental Data & Vacation Rental Statistics in Scotland, United Kingdom
Is Airbnb profitable in Charleston in 2025? Explore comprehensive Airbnb analytics for Charleston, Scotland, United Kingdom to uncover income potential. This 2025 STR market report for Charleston, based on AirROI data from April 2024 to March 2025, reveals key trends in the niche market of 19 active listings.
Whether you're considering an Airbnb investment in Charleston, optimizing your existing vacation rental, or exploring rental arbitrage opportunities, understanding the Charleston Airbnb data is crucial. Understanding the local regulations is key to maximizing your short term rental income potential. Let's dive into the specifics.
Key Charleston Airbnb Performance Metrics Overview
Monthly Airbnb Revenue Variations & Income Potential in Charleston (2025)
Understanding the monthly revenue variations for Airbnb listings in Charleston is key to maximizing your short term rental income potential. Seasonality significantly impacts earnings. Our analysis, based on data from the past 12 months, shows that the peak revenue month for STRs in Charleston is typically August, while February often presents the lowest earnings, highlighting opportunities for strategic pricing adjustments during shoulder and low seasons. Explore the typical Airbnb income in Charleston across different performance tiers:
- Best-in-class properties (Top 10%) achieve $7,053+ monthly, often utilizing dynamic pricing and superior guest experiences.
- Strong performing properties (Top 25%) earn $4,506 or more, indicating effective management and desirable locations/amenities.
- Typical properties (Median) generate around $2,927 per month, representing the average market performance.
- Entry-level properties (Bottom 25%) see earnings around $1,814, often with potential for optimization.
Average Monthly Airbnb Earnings Trend in Charleston
Charleston Airbnb Occupancy Rate Trends (2025)
Maximize your bookings by understanding the Charleston STR occupancy trends. Seasonal demand shifts significantly influence how often properties are booked. Typically, Augustsees the highest demand (peak season occupancy), while January experiences the lowest (low season). Effective strategies, like adjusting minimum stays or offering promotions, can boost occupancy during slower periods. Here's how different property tiers perform in Charleston:
- Best-in-class properties (Top 10%) achieve 81%+ occupancy, indicating high desirability and potentially optimized availability.
- Strong performing properties (Top 25%) maintain 70% or higher occupancy, suggesting good market fit and guest satisfaction.
- Typical properties (Median) have an occupancy rate around 53%.
- Entry-level properties (Bottom 25%) average 39% occupancy, potentially facing higher vacancy.
Average Monthly Occupancy Rate Trend in Charleston
Average Daily Rate (ADR) Airbnb Trends in Charleston (2025)
Effective short term rental pricing strategy in Charleston involves understanding monthly ADR fluctuations. The Average Daily Rate (ADR) for Airbnb in Charleston typically peaks in December and dips lowest during April. Leveraging Airbnb dynamic pricing tools or strategies based on this seasonality can significantly boost revenue. Here's a look at the typical nightly rates achieved:
- Best-in-class properties (Top 10%) command rates of $314+ per night, often due to premium features or locations.
- Strong performing properties (Top 25%) achieve nightly rates of $203 or more.
- Typical properties (Median) charge around $170 per night.
- Entry-level properties (Bottom 25%) earn around $124 per night.
Average Daily Rate (ADR) Trend by Month in Charleston
Get Live Charleston Market Intelligence 👇

Explore Real-time Analytics
Airbnb Seasonality Analysis & Trends in Charleston (2025)
Peak Season (August, July, September)
- Revenue averages $5,215 per month
- Occupancy rates average 78.4%
- Daily rates average $184
Shoulder Season
- Revenue averages $3,499 per month
- Occupancy maintains around 54.0%
- Daily rates hold near $181
Low Season (January, February, March)
- Revenue drops to average $1,720 per month
- Occupancy decreases to average 32.1%
- Daily rates adjust to average $182
Seasonality Insights for Charleston
- The Airbnb seasonality in Charleston shows highly seasonal trends requiring careful strategy. While the sections above show seasonal averages, it's also insightful to look at the extremes:
- During the high season, the absolute peak month showcases Charleston's highest earning potential, with monthly revenues capable of climbing to $5,644, occupancy reaching a high of 80.8%, and ADRs peaking at $191.
- Conversely, the slowest single month of the year, typically falling within the low season, marks the market's lowest point. In this month, revenue might dip to $1,618, occupancy could drop to 27.1%, and ADRs may adjust down to $169.
- Understanding both the seasonal averages and these monthly peaks and troughs in revenue, occupancy, and ADR is crucial for maximizing your Airbnb profit potential in Charleston.
Seasonal Strategies for Maximizing Profit
- Peak Season: Maximize revenue through premium pricing and potentially longer minimum stays. Ensure high availability.
- Low Season: Offer competitive pricing, special promotions (e.g., extended stay discounts), and flexible cancellation policies. Target off-season travelers like remote workers or budget-conscious guests.
- Shoulder Seasons: Implement dynamic pricing that balances peak and low rates. Target weekend travelers or specific events. Offer slightly more flexible terms than peak season.
- Regularly analyze your own performance against these Charleston seasonality benchmarks and adjust your pricing and availability strategy accordingly.
Best Areas for Airbnb Investment in Charleston (2025)
Exploring the top neighborhoods for short-term rentals in Charleston? This section highlights key areas, outlining why they are attractive for hosts and guests, along with notable local attractions. Consider these locations based on your target guest profile and investment strategy.
| Neighborhood / Area | Why Host Here? (Target Guests & Appeal) | Key Attractions & Landmarks |
|---|---|---|
| Historic City Centre | The heart of Charleston, bursting with history, beautiful architecture, and Southern charm. It's a prime destination for tourists seeking to explore the rich history of the city and enjoy its vibrant culture. | Charleston City Market, Rainbow Row, The Battery, Fort Sumter, Waterfront Park, South Carolina Aquarium |
| French Quarter | Known for its cobblestone streets and historic buildings, the French Quarter is a cultural gem of Charleston, ideal for visitors wanting to experience art galleries, dining, and nightlife in an atmospheric setting. | St. Philip's Church, The Governor's House, Charleston Museum, Dock Street Theatre, Old Slave Mart Museum |
| King Street | A bustling shopping and dining destination, King Street attracts visitors looking for a mix of upscale boutiques, trendy restaurants, and vibrant nightlife, making it a lucrative area for short-term rentals. | King Street Shopping District, The Cocktail Club, FIG Restaurant, The Gin Joint, The Powder Magazine |
| Battery and White Point Garden | This picturesque area offers stunning views of the harbor and historic mansions, appealing to tourists interested in a scenic and relaxed atmosphere alongside historical significance. | White Point Garden, The Battery, Fort Moultrie, Calhoun Mansion, Edmondston-Alston House |
| Mount Pleasant | Just across the Cooper River, Mount Pleasant is a family-friendly area with beautiful parks and beaches, and close proximity to the historic downtown Charleston, perfect for visitors seeking a quieter stay. | Patriots Point, Shem Creek, Isle of Palms Beach, Mount Pleasant Pier, Old Village |
| Folly Beach | A laid-back beach town known for its stunning coastline and local surf culture. Folly Beach attracts beachgoers and outdoor enthusiasts, making it a popular choice for vacation rentals. | Folly Beach County Park, Morris Island Lighthouse, Folly Beach Pier, Turtle Point, The Washout |
| West Ashley | This residential area is evolving with new dining and shopping options, close to downtown Charleston and offers a more suburban feel, great for families and long-term visitors. | The Venue at Wilkins Park, West Ashley Greenway, Magnolia Plantation and Gardens, South Windermere Shopping Village |
| James Island | Offering a mix of parks, local restaurants, and close access to Folly Beach, James Island is a growing area with a community vibe, appealing to families and groups looking for a mix of comfort and adventure. | Folly River Park, James Island County Park, The Battery, Folly Beach, Mitchell's Dock |
Understanding Airbnb License Requirements & STR Laws in Charleston (2025)
With 16% of listings showing registration in 2025, understanding potential Airbnb license requirements is crucial in Charleston. Always verify the latest short term rental regulations and Airbnb license requirements directly with local government authorities for Charleston to ensure full compliance before hosting.
(Source: AirROI data, 2025, based on 16% licensed listings)
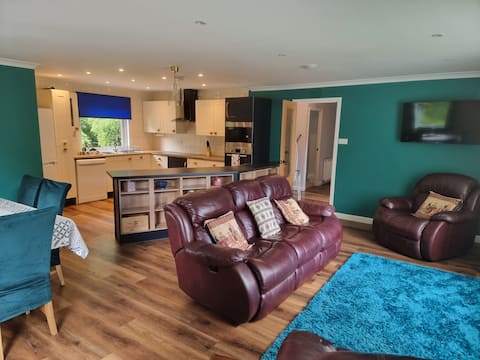
Top Performing Airbnb Properties in Charleston (2025)
Benchmark your potential! Explore examples of top-performing Airbnb properties in Charlestonbased on Trailing Twelve Month (TTM) revenue. Analyze their characteristics, revenue, occupancy rate, and ADR to understand what drives success in this market.

Garden Cottage with hot tub, castle & sea views
Entire Place • 2 bedrooms

Spacious Sea View Home 5 miles from Inverness
Entire Place • 5 bedrooms

Druid House Lodge. Romantic, countryside Lodge.
Entire Place • 1 bedroom

Drumsmittal Croft, North Kessock, Highland
Entire Place • 1 bedroom

Peaceful Sea View Home only 5 miles from Inverness
Entire Place • 3 bedrooms
Rowanlea Cosy country cottage
Entire Place • 3 bedrooms
Note: Performance varies based on location, size, amenities, seasonality, and management quality. Data reflects the past 12 months.
Top Performing Airbnb Hosts in Charleston (2025)
Learn from the best! This table showcases top-performing Airbnb hosts in Charleston based on the number of properties managed and estimated total revenue over the past year. Analyze their scale and performance metrics.
| Host Name | Properties | Grossing Revenue | Stay Reviews | Avg Rating |
|---|---|---|---|---|
| Isabella | 6 | $249,020 | 633 | 4.87/5.0 |
| Katie | 1 | $102,179 | 90 | 4.97/5.0 |
| Julie | 2 | $64,560 | 40 | 5.00/5.0 |
| Kimberley | 1 | $56,039 | 216 | 4.94/5.0 |
| Donnie And Ellie | 2 | $47,776 | 179 | 5.00/5.0 |
| Emma | 1 | $47,086 | 379 | 4.98/5.0 |
| Cottages | 1 | $27,149 | 3 | 5.00/5.0 |
| Paul | 1 | $26,665 | 340 | 4.93/5.0 |
| Alicia | 2 | $26,308 | 611 | 4.88/5.0 |
| Louise | 1 | $22,738 | 150 | 4.93/5.0 |
Analyzing the strategies of top hosts, such as their property selection, pricing, and guest communication, can offer valuable lessons for optimizing your own Airbnb operations in Charleston.
Dive Deeper: Advanced Charleston STR Market Data (2025)
Ready to unlock more insights? AirROI provides access to advanced metrics and comprehensive Airbnb data for Charleston. Explore detailed analytics beyond this report to refine your investment strategy, optimize pricing, and maximize your vacation rental profits.
Explore Advanced MetricsCharleston Short-Term Rental Market Composition (2025): Property & Room Types
Room Type Distribution
Property Type Distribution
Market Composition Insights for Charleston
- The Charleston Airbnb market composition is heavily skewed towards Entire Home/Apt listings, which make up 94.7% of the 19 active rentals. This indicates strong guest preference for privacy and space.
- Looking at the property type distribution in Charleston, House properties are the most common (68.4%), reflecting the local real estate landscape.
- Houses represent a significant 68.4% portion, catering likely to families or larger groups.
- The presence of 5.3% Hotel/Boutique listings indicates integration with traditional hospitality.
Charleston Airbnb Room Capacity Analysis (2025): Bedroom Distribution
Distribution of Listings by Number of Bedrooms
Room Capacity Insights for Charleston
- The dominant room capacity in Charleston is 1 bedroom listings, making up 36.8% of the market. This suggests a strong demand for properties suitable for couples or solo travelers.
- Together, 1 bedroom and 2 bedrooms properties represent 68.4% of the active Airbnb listings in Charleston, indicating a high concentration in these sizes.
- A significant 31.6% of listings offer 3+ bedrooms, catering to larger groups and families seeking more space in Charleston.
Charleston Vacation Rental Guest Capacity Trends (2025)
Distribution of Listings by Guest Capacity
Guest Capacity Insights for Charleston
- The most common guest capacity trend in Charleston vacation rentals is listings accommodating 4 guests (36.8%). This suggests the primary traveler segment is likely small families or groups.
- Properties designed for 4 guests and 6 guests dominate the Charleston STR market, accounting for 68.4% of listings.
- 36.9% of properties accommodate 6+ guests, serving the market segment for larger families or group travel in Charleston.
- On average, properties in Charleston are equipped to host 4.3 guests.
Charleston Airbnb Booking Patterns (2025): Available vs. Booked Days
Available Days Distribution
Booked Days Distribution
Booking Pattern Insights for Charleston
- The most common availability pattern in Charleston falls within the 91-180 days range, representing 47.4% of listings. This suggests many properties have significant open periods on their calendars.
- Approximately 52.6% of listings show high availability (181+ days open annually), indicating potential for increased bookings or specific owner usage patterns.
- For booked days, the 181-270 days range is most frequent in Charleston (47.4%), reflecting common guest stay durations or potential owner blocking patterns.
- A notable 52.7% of properties secure long booking periods (181+ days booked per year), highlighting successful long-term rental strategies or significant owner usage.
Charleston Airbnb Minimum Stay Requirements Analysis
Distribution of Listings by Minimum Night Requirement
1 Night
3 listings
15.8% of total
2 Nights
5 listings
26.3% of total
3 Nights
6 listings
31.6% of total
4-6 Nights
2 listings
10.5% of total
30+ Nights
3 listings
15.8% of total
Key Insights
- The most prevalent minimum stay requirement in Charleston is 3 Nights, adopted by 31.6% of listings. This highlights the market's preference for longer commitments.
- A significant segment (15.8%) caters to monthly stays (30+ nights) in Charleston, pointing to opportunities in the extended-stay market.
Recommendations
- Align with the market by considering a 3 Nights minimum stay, as 31.6% of Charleston hosts use this setting.
- If feasible, allowing 1-night stays, especially midweek or during low season, could capture last-minute bookings, as only 15.8% currently do.
- Explore offering discounts for stays of 30+ nights to attract the 15.8% of the market seeking extended stays.
- Adjust minimum nights based on seasonality – potentially shorter during low season and longer during peak demand periods in Charleston.
Charleston Airbnb Cancellation Policy Trends Analysis (2025)
Super Strict 60 Days
1 listings
5.3% of total
Super Strict 30 Days
1 listings
5.3% of total
Flexible
7 listings
36.8% of total
Moderate
1 listings
5.3% of total
Firm
2 listings
10.5% of total
Strict
7 listings
36.8% of total
Cancellation Policy Insights for Charleston
- The prevailing Airbnb cancellation policy trend in Charleston is Flexible, used by 36.8% of listings.
- There's a relatively balanced mix between guest-friendly (42.1%) and stricter (47.3%) policies, offering choices for different guest needs.
Recommendations for Hosts
- Consider adopting a Flexible policy to align with the 36.8% market standard in Charleston.
- With 36.8% using Strict terms, this is a viable option in Charleston, particularly for high-value properties or during peak demand periods.
- Regularly review your cancellation policy against competitors and market demand shifts in Charleston.
Charleston STR Booking Lead Time Analysis (2025)
Average Booking Lead Time by Month
Booking Lead Time Insights for Charleston
- The overall average booking lead time for vacation rentals in Charleston is 71 days.
- Guests book furthest in advance for stays during December (average 105 days), likely coinciding with peak travel demand or local events.
- The shortest booking windows occur for stays in February (average 28 days), indicating more last-minute travel plans during this time.
- Seasonally, Summer (90 days avg.) sees the longest lead times, while Spring (62 days avg.) has the shortest, reflecting typical travel planning cycles.
Recommendations for Hosts
- Use the overall average lead time (71 days) as a baseline for your pricing and availability strategy in Charleston.
- For December stays, consider implementing length-of-stay discounts or slightly higher rates for bookings made less than 105 days out to capitalize on advance planning.
- Target marketing efforts for the Summer season well in advance (at least 90 days) to capture early planners.
- Monitor your own booking lead times against these Charleston averages to identify opportunities for dynamic pricing adjustments.
Popular & Essential Airbnb Amenities in Charleston (2025)
Amenity Prevalence
Amenity Insights for Charleston
- Essential amenities in Charleston that guests expect include: Wifi, TV, Heating, Smoke alarm, Free parking on premises. Lacking these (any) could significantly impact bookings.
- Popular amenities like Kitchen, Hot water, Hangers are common but not universal. Offering these can provide a competitive edge.
Recommendations for Hosts
- Ensure your listing includes all essential amenities for Charleston: Wifi, TV, Heating, Smoke alarm, Free parking on premises.
- Consider adding popular differentiators like Kitchen or Hot water to increase appeal.
- Highlight unique or less common amenities you offer (e.g., hot tub, dedicated workspace, EV charger) in your listing description and photos.
- Regularly check competitor amenities in Charleston to stay competitive.
Charleston Airbnb Guest Demographics & Profile Analysis (2025)
Guest Profile Summary for Charleston
- The typical guest profile for Airbnb in Charleston consists of a mix of domestic (44%) and international guests, with top international origins including United States, typically belonging to the Post-2000s (Gen Z/Alpha) group (50%), primarily speaking English or French.
- Domestic travelers account for 43.8% of guests.
- Key international markets include United Kingdom (43.8%) and United States (28.6%).
- Top languages spoken are English (62.5%) followed by French (7%).
- A significant demographic segment is the Post-2000s (Gen Z/Alpha) group, representing 50% of guests.
Recommendations for Hosts
- Balance marketing efforts between domestic and international channels based on the guest mix.
- Tailor amenities and listing descriptions to appeal to the dominant Post-2000s (Gen Z/Alpha) demographic (e.g., highlight fast WiFi, smart home features, local guides).
- Highlight unique local experiences or amenities relevant to the primary guest profile.
- Consider seasonal promotions aligned with peak travel times for key origin markets.
Nearby Short-Term Rental Market Comparison
How does the Charleston Airbnb market stack up against its neighbors? Compare key performance metrics like average monthly revenue, ADR, and occupancy rates in surrounding areas to understand the broader regional STR landscape.
| Market | Active Properties | Monthly Revenue | Daily Rate | Avg. Occupancy |
|---|---|---|---|---|
| Fearnan | 19 | $6,440 | $421.92 | 53% |
| Bridge of Cally | 16 | $5,839 | $566.24 | 50% |
| Kirkhill | 10 | $5,719 | $700.26 | 44% |
| Glenachulish | 33 | $5,609 | $424.51 | 46% |
| North Kessock | 10 | $5,421 | $380.62 | 58% |
| Foyers | 14 | $5,076 | $274.52 | 64% |
| Arrochar | 33 | $5,045 | $339.11 | 56% |
| Whitebridge | 10 | $4,907 | $417.35 | 42% |
| Acharn | 10 | $4,813 | $278.43 | 57% |
| Camuscross | 11 | $4,649 | $300.59 | 61% |