Carbost Airbnb Market Analysis 2025: Short Term Rental Data & Vacation Rental Statistics in Scotland, United Kingdom
Is Airbnb profitable in Carbost in 2025? Explore comprehensive Airbnb analytics for Carbost, Scotland, United Kingdom to uncover income potential. This 2025 STR market report for Carbost, based on AirROI data from April 2024 to March 2025, reveals key trends in the niche market of 26 active listings.
Whether you're considering an Airbnb investment in Carbost, optimizing your existing vacation rental, or exploring rental arbitrage opportunities, understanding the Carbost Airbnb data is crucial. Navigating the high regulation landscape is key to maximizing your short term rental income potential. Let's dive into the specifics.
Key Carbost Airbnb Performance Metrics Overview
Monthly Airbnb Revenue Variations & Income Potential in Carbost (2025)
Understanding the monthly revenue variations for Airbnb listings in Carbost is key to maximizing your short term rental income potential. Seasonality significantly impacts earnings. Our analysis, based on data from the past 12 months, shows that the peak revenue month for STRs in Carbost is typically June, while February often presents the lowest earnings, highlighting opportunities for strategic pricing adjustments during shoulder and low seasons. Explore the typical Airbnb income in Carbost across different performance tiers:
- Best-in-class properties (Top 10%) achieve $14,253+ monthly, often utilizing dynamic pricing and superior guest experiences.
- Strong performing properties (Top 25%) earn $6,657 or more, indicating effective management and desirable locations/amenities.
- Typical properties (Median) generate around $4,275 per month, representing the average market performance.
- Entry-level properties (Bottom 25%) see earnings around $2,620, often with potential for optimization.
Average Monthly Airbnb Earnings Trend in Carbost
Carbost Airbnb Occupancy Rate Trends (2025)
Maximize your bookings by understanding the Carbost STR occupancy trends. Seasonal demand shifts significantly influence how often properties are booked. Typically, Maysees the highest demand (peak season occupancy), while February experiences the lowest (low season). Effective strategies, like adjusting minimum stays or offering promotions, can boost occupancy during slower periods. Here's how different property tiers perform in Carbost:
- Best-in-class properties (Top 10%) achieve 91%+ occupancy, indicating high desirability and potentially optimized availability.
- Strong performing properties (Top 25%) maintain 80% or higher occupancy, suggesting good market fit and guest satisfaction.
- Typical properties (Median) have an occupancy rate around 67%.
- Entry-level properties (Bottom 25%) average 43% occupancy, potentially facing higher vacancy.
Average Monthly Occupancy Rate Trend in Carbost
Average Daily Rate (ADR) Airbnb Trends in Carbost (2025)
Effective short term rental pricing strategy in Carbost involves understanding monthly ADR fluctuations. The Average Daily Rate (ADR) for Airbnb in Carbost typically peaks in December and dips lowest during October. Leveraging Airbnb dynamic pricing tools or strategies based on this seasonality can significantly boost revenue. Here's a look at the typical nightly rates achieved:
- Best-in-class properties (Top 10%) command rates of $750+ per night, often due to premium features or locations.
- Strong performing properties (Top 25%) achieve nightly rates of $277 or more.
- Typical properties (Median) charge around $160 per night.
- Entry-level properties (Bottom 25%) earn around $127 per night.
Average Daily Rate (ADR) Trend by Month in Carbost
Get Live Carbost Market Intelligence 👇
Explore Real-time Analytics
Airbnb Seasonality Analysis & Trends in Carbost (2025)
Peak Season (June, May, July)
- Revenue averages $9,600 per month
- Occupancy rates average 82.3%
- Daily rates average $260
Shoulder Season
- Revenue averages $5,760 per month
- Occupancy maintains around 62.4%
- Daily rates hold near $267
Low Season (January, February, March)
- Revenue drops to average $2,471 per month
- Occupancy decreases to average 39.6%
- Daily rates adjust to average $273
Seasonality Insights for Carbost
- The Airbnb seasonality in Carbost shows highly seasonal trends requiring careful strategy. While the sections above show seasonal averages, it's also insightful to look at the extremes:
- During the high season, the absolute peak month showcases Carbost's highest earning potential, with monthly revenues capable of climbing to $9,759, occupancy reaching a high of 83.4%, and ADRs peaking at $292.
- Conversely, the slowest single month of the year, typically falling within the low season, marks the market's lowest point. In this month, revenue might dip to $2,305, occupancy could drop to 39.3%, and ADRs may adjust down to $235.
- Understanding both the seasonal averages and these monthly peaks and troughs in revenue, occupancy, and ADR is crucial for maximizing your Airbnb profit potential in Carbost.
Seasonal Strategies for Maximizing Profit
- Peak Season: Maximize revenue through premium pricing and potentially longer minimum stays. Ensure high availability.
- Low Season: Offer competitive pricing, special promotions (e.g., extended stay discounts), and flexible cancellation policies. Target off-season travelers like remote workers or budget-conscious guests.
- Shoulder Seasons: Implement dynamic pricing that balances peak and low rates. Target weekend travelers or specific events. Offer slightly more flexible terms than peak season.
- Regularly analyze your own performance against these Carbost seasonality benchmarks and adjust your pricing and availability strategy accordingly.
Best Areas for Airbnb Investment in Carbost (2025)
Exploring the top neighborhoods for short-term rentals in Carbost? This section highlights key areas, outlining why they are attractive for hosts and guests, along with notable local attractions. Consider these locations based on your target guest profile and investment strategy.
| Neighborhood / Area | Why Host Here? (Target Guests & Appeal) | Key Attractions & Landmarks |
|---|---|---|
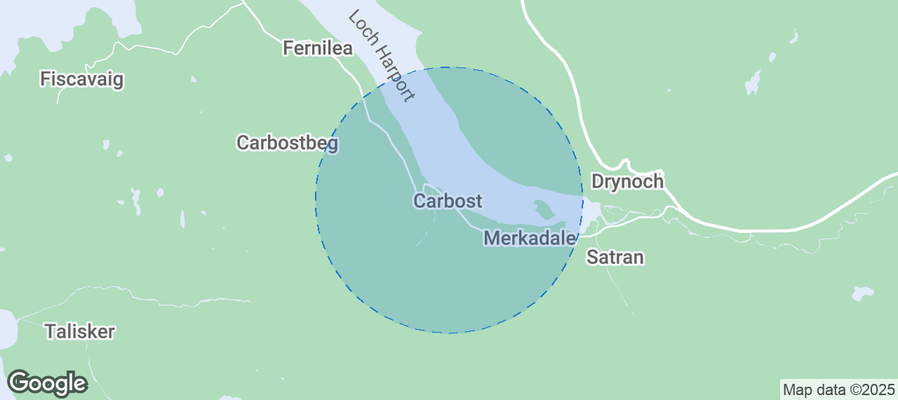
| Carbost Village | Charming village known for its picturesque landscapes and proximity to the famous Talisker Distillery. Ideal for travelers seeking a traditional Scottish experience with stunning views of the Isle of Skye. | Talisker Distillery, Loch Harport, The Old Man of Storr, Dunvegan Castle, Fairy Pools |
| Dunvegan | Home to the historic Dunvegan Castle, this area attracts visitors interested in Scottish heritage and breathtaking coastal scenery. A great location for hosting guests interested in culture and history. | Dunvegan Castle, Neist Point, Coral Beach, Dunvegan Harbour, Skye's Historic Sites |
| Portree | The largest town on the Isle of Skye with a vibrant harbor and plenty of amenities. A convenient base for tourists exploring the island, with various shops and restaurants. | Portree Harbour, The Old Man of Storr, Isle of Skye Museum of Island Life, Skye Candle Company, Raasay Distillery |
| Uig | Known for its ferry terminal to the Outer Hebrides, Uig offers beautiful coastal views and hiking opportunities. A perfect spot for adventurers and those looking to explore the Hebrides. | Uig Sands, Fairy Glen, Uig Pottery, Neist Point Lighthouse, Rugged Coastline |
| Elgol | A small village with stunning views of the Cuillin mountains and close proximity to boat trips to explore the surrounding islands. Attractive to nature lovers and photographers. | Elgol Beach, Cuillin Mountains, Boat trips to Loch Coruisk, Best sunset views, Hiking trails |
| Sleat | Known as the 'Garden of Skye', Sleat features lush landscapes and beautiful gardens. Perfect for guests seeking tranquility and scenic beauty. | Culinary gardens, Isle of Skye Community Hub, Botanical gardens, Historical sites, Walking trails |
| Kyleakin | A quaint village linked to the Isle of Skye by the Skye Bridge, it offers charming scenery and historical significance, making it appealing to a variety of travelers. | Skye Bridge, Castle Moil, Kyleakin Harbour, Eilean Ban, Local pubs and restaurants |
| Broadford | The second largest village on Skye provides easy access to both the north and south of the island, with shops, restaurants, and beautiful views. Popular among tourists seeking convenience. | Broadford Bay, Boreraig, Skye Serpentarium, Explore the outdoors, Local art shops |
Understanding Airbnb License Requirements & STR Laws in Carbost (2025)
Yes, Carbost, Scotland, United Kingdom enforces high STR regulations. Obtaining a license and ensuring compliance is almost certainly required according to current 2025 STR laws. Always verify the latest short term rental regulations and Airbnb license requirements directly with local government authorities for Carbost to ensure full compliance before hosting.
(Source: AirROI data, 2025, based on 42% licensed listings)
Top Performing Airbnb Properties in Carbost (2025)
Benchmark your potential! Explore examples of top-performing Airbnb properties in Carbostbased on Trailing Twelve Month (TTM) revenue. Analyze their characteristics, revenue, occupancy rate, and ADR to understand what drives success in this market.
Luxury 4 BdRm Seaview Cottage by the Fairy Pools
Entire Place • 4 bedrooms

Luxury Cottage With Stunning Views by Fairy Pools!
Entire Place • 2 bedrooms
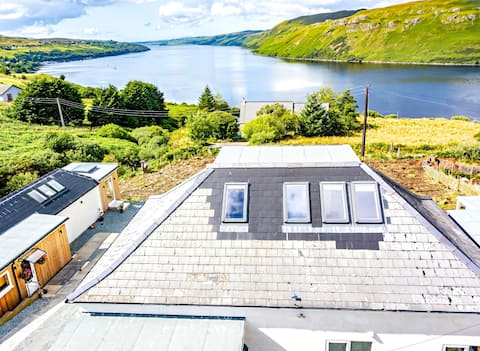
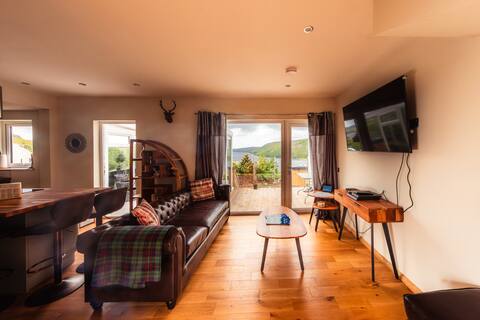
Hector’s Retreat - Lovely 4 bed self-catering
Entire Place • 4 bedrooms
Luxury 3 BdRm Seaview Cottage by the Fairy Pools
Entire Place • 3 bedrooms
Luxury Cottage/ Stunning views by Fairy Pools 4
Entire Place • 3 bedrooms
This must be the place - Skye, Carbost
Entire Place • 2 bedrooms
Note: Performance varies based on location, size, amenities, seasonality, and management quality. Data reflects the past 12 months.
Top Performing Airbnb Hosts in Carbost (2025)
Learn from the best! This table showcases top-performing Airbnb hosts in Carbost based on the number of properties managed and estimated total revenue over the past year. Analyze their scale and performance metrics.
| Host Name | Properties | Grossing Revenue | Stay Reviews | Avg Rating |
|---|---|---|---|---|
| Hany | 2 | $333,258 | 62 | 4.75/5.0 |
| Hany | 3 | $265,981 | 25 | 3.17/5.0 |
| Danielle | 1 | $158,312 | 85 | 4.73/5.0 |
| Ann | 2 | $109,968 | 32 | 4.97/5.0 |
| Dani | 3 | $101,820 | 935 | 4.95/5.0 |
| Ari | 1 | $80,382 | 42 | 4.93/5.0 |
| Tom And Lynsey | 1 | $70,773 | 370 | 4.94/5.0 |
| Juliet | 1 | $68,542 | 38 | 4.97/5.0 |
| Ruud | 1 | $61,590 | 75 | 4.97/5.0 |
| William | 2 | $57,868 | 230 | 5.00/5.0 |
Analyzing the strategies of top hosts, such as their property selection, pricing, and guest communication, can offer valuable lessons for optimizing your own Airbnb operations in Carbost.
Dive Deeper: Advanced Carbost STR Market Data (2025)
Ready to unlock more insights? AirROI provides access to advanced metrics and comprehensive Airbnb data for Carbost. Explore detailed analytics beyond this report to refine your investment strategy, optimize pricing, and maximize your vacation rental profits.
Explore Advanced MetricsCarbost Short-Term Rental Market Composition (2025): Property & Room Types
Room Type Distribution
Property Type Distribution
Market Composition Insights for Carbost
- The Carbost Airbnb market composition is heavily skewed towards Entire Home/Apt listings, which make up 88.5% of the 26 active rentals. This indicates strong guest preference for privacy and space.
- Looking at the property type distribution in Carbost, House properties are the most common (73.1%), reflecting the local real estate landscape.
- Houses represent a significant 73.1% portion, catering likely to families or larger groups.
- The presence of 11.5% Hotel/Boutique listings indicates integration with traditional hospitality.
- Smaller segments like others (combined 3.8%) offer potential for unique stay experiences.
Carbost Airbnb Room Capacity Analysis (2025): Bedroom Distribution
Distribution of Listings by Number of Bedrooms
Room Capacity Insights for Carbost
- The dominant room capacity in Carbost is 1 bedroom listings, making up 34.6% of the market. This suggests a strong demand for properties suitable for couples or solo travelers.
- Together, 1 bedroom and 3 bedrooms properties represent 57.7% of the active Airbnb listings in Carbost, indicating a high concentration in these sizes.
- A significant 34.6% of listings offer 3+ bedrooms, catering to larger groups and families seeking more space in Carbost.
Carbost Vacation Rental Guest Capacity Trends (2025)
Distribution of Listings by Guest Capacity
Guest Capacity Insights for Carbost
- The most common guest capacity trend in Carbost vacation rentals is listings accommodating 2 guests (34.6%). This suggests the primary traveler segment is likely couples or solo travelers.
- Properties designed for 2 guests and 4 guests dominate the Carbost STR market, accounting for 50.0% of listings.
- 26.9% of properties accommodate 6+ guests, serving the market segment for larger families or group travel in Carbost.
- On average, properties in Carbost are equipped to host 3.8 guests.
Carbost Airbnb Booking Patterns (2025): Available vs. Booked Days
Available Days Distribution
Booked Days Distribution
Booking Pattern Insights for Carbost
- The most common availability pattern in Carbost falls within the 91-180 days range, representing 34.6% of listings. This suggests many properties have significant open periods on their calendars.
- Approximately 38.4% of listings show high availability (181+ days open annually), indicating potential for increased bookings or specific owner usage patterns.
- For booked days, the 181-270 days range is most frequent in Carbost (38.5%), reflecting common guest stay durations or potential owner blocking patterns.
- A notable 65.4% of properties secure long booking periods (181+ days booked per year), highlighting successful long-term rental strategies or significant owner usage.
Carbost Airbnb Minimum Stay Requirements Analysis
Distribution of Listings by Minimum Night Requirement
2 Nights
11 listings
44% of total
3 Nights
5 listings
20% of total
4-6 Nights
2 listings
8% of total
30+ Nights
7 listings
28% of total
Key Insights
- The most prevalent minimum stay requirement in Carbost is 2 Nights, adopted by 44% of listings. This highlights the market's preference for shorter, flexible bookings.
- A significant segment (28%) caters to monthly stays (30+ nights) in Carbost, pointing to opportunities in the extended-stay market.
Recommendations
- Align with the market by considering a 2 Nights minimum stay, as 44% of Carbost hosts use this setting.
- A 2-night minimum appears standard (44%). Consider this for weekends or peak periods.
- Explore offering discounts for stays of 30+ nights to attract the 28% of the market seeking extended stays.
- Adjust minimum nights based on seasonality – potentially shorter during low season and longer during peak demand periods in Carbost.
Carbost Airbnb Cancellation Policy Trends Analysis (2025)
Flexible
5 listings
20% of total
Moderate
9 listings
36% of total
Firm
2 listings
8% of total
Strict
9 listings
36% of total
Cancellation Policy Insights for Carbost
- The prevailing Airbnb cancellation policy trend in Carbost is Moderate, used by 36% of listings.
- There's a relatively balanced mix between guest-friendly (56.0%) and stricter (44.0%) policies, offering choices for different guest needs.
Recommendations for Hosts
- Consider adopting a Moderate policy to align with the 36% market standard in Carbost.
- With 36% using Strict terms, this is a viable option in Carbost, particularly for high-value properties or during peak demand periods.
- Regularly review your cancellation policy against competitors and market demand shifts in Carbost.
Carbost STR Booking Lead Time Analysis (2025)
Average Booking Lead Time by Month
Booking Lead Time Insights for Carbost
- The overall average booking lead time for vacation rentals in Carbost is 83 days.
- Guests book furthest in advance for stays during July (average 171 days), likely coinciding with peak travel demand or local events.
- The shortest booking windows occur for stays in February (average 31 days), indicating more last-minute travel plans during this time.
- Seasonally, Summer (147 days avg.) sees the longest lead times, while Winter (61 days avg.) has the shortest, reflecting typical travel planning cycles.
Recommendations for Hosts
- Use the overall average lead time (83 days) as a baseline for your pricing and availability strategy in Carbost.
- For July stays, consider implementing length-of-stay discounts or slightly higher rates for bookings made less than 171 days out to capitalize on advance planning.
- Target marketing efforts for the Summer season well in advance (at least 147 days) to capture early planners.
- Monitor your own booking lead times against these Carbost averages to identify opportunities for dynamic pricing adjustments.
Popular & Essential Airbnb Amenities in Carbost (2025)
Amenity Prevalence
Amenity Insights for Carbost
- Essential amenities in Carbost that guests expect include: Hangers, Smoke alarm, Heating, Free parking on premises, Essentials, Hot water, Wifi, TV. Lacking these (any) could significantly impact bookings.
- Popular amenities like Hair dryer, Backyard are common but not universal. Offering these can provide a competitive edge.
Recommendations for Hosts
- Ensure your listing includes all essential amenities for Carbost: Hangers, Smoke alarm, Heating, Free parking on premises, Essentials, Hot water, Wifi, TV.
- Prioritize adding missing essentials: Wifi, TV.
- Consider adding popular differentiators like Hair dryer or Backyard to increase appeal.
- Highlight unique or less common amenities you offer (e.g., hot tub, dedicated workspace, EV charger) in your listing description and photos.
- Regularly check competitor amenities in Carbost to stay competitive.
Carbost Airbnb Guest Demographics & Profile Analysis (2025)
Guest Profile Summary for Carbost
- The typical guest profile for Airbnb in Carbost consists of predominantly international visitors (70%), with top international origins including United States, typically belonging to the Post-2000s (Gen Z/Alpha) group (50%), primarily speaking English or German.
- Domestic travelers account for 30.5% of guests.
- Key international markets include United Kingdom (30.5%) and United States (27.1%).
- Top languages spoken are English (54.9%) followed by German (11.8%).
- A significant demographic segment is the Post-2000s (Gen Z/Alpha) group, representing 50% of guests.
Recommendations for Hosts
- Focus marketing internationally, particularly towards travelers from United States.
- Tailor amenities and listing descriptions to appeal to the dominant Post-2000s (Gen Z/Alpha) demographic (e.g., highlight fast WiFi, smart home features, local guides).
- Highlight unique local experiences or amenities relevant to the primary guest profile.
- Consider seasonal promotions aligned with peak travel times for key origin markets.
Nearby Short-Term Rental Market Comparison
How does the Carbost Airbnb market stack up against its neighbors? Compare key performance metrics like average monthly revenue, ADR, and occupancy rates in surrounding areas to understand the broader regional STR landscape.
| Market | Active Properties | Monthly Revenue | Daily Rate | Avg. Occupancy |
|---|---|---|---|---|
| Glenachulish | 33 | $5,609 | $424.51 | 46% |
| Port Failthe | 14 | $4,832 | $301.12 | 57% |
| Camuscross | 11 | $4,649 | $300.59 | 61% |
| Culnacnoc | 16 | $4,576 | $299.16 | 60% |
| Corran | 24 | $4,576 | $370.68 | 45% |
| Portree | 190 | $4,227 | $258.97 | 60% |
| Benderloch | 14 | $4,218 | $364.53 | 55% |
| Stein | 14 | $4,160 | $249.21 | 72% |
| North Ballachulish | 34 | $4,144 | $288.28 | 47% |
| Teangue | 16 | $4,109 | $239.94 | 61% |