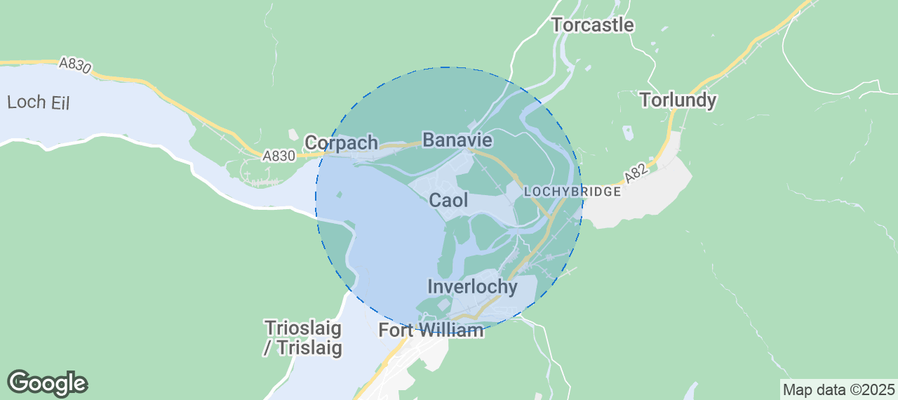
Caol Airbnb Market Analysis 2025: Short Term Rental Data & Vacation Rental Statistics in Scotland, United Kingdom
Is Airbnb profitable in Caol in 2025? Explore comprehensive Airbnb analytics for Caol, Scotland, United Kingdom to uncover income potential. This 2025 STR market report for Caol, based on AirROI data from April 2024 to March 2025, reveals key trends in the niche market of 41 active listings.
Whether you're considering an Airbnb investment in Caol, optimizing your existing vacation rental, or exploring rental arbitrage opportunities, understanding the Caol Airbnb data is crucial. Navigating the high regulation landscape is key to maximizing your short term rental income potential. Let's dive into the specifics.
Key Caol Airbnb Performance Metrics Overview
Monthly Airbnb Revenue Variations & Income Potential in Caol (2025)
Understanding the monthly revenue variations for Airbnb listings in Caol is key to maximizing your short term rental income potential. Seasonality significantly impacts earnings. Our analysis, based on data from the past 12 months, shows that the peak revenue month for STRs in Caol is typically May, while January often presents the lowest earnings, highlighting opportunities for strategic pricing adjustments during shoulder and low seasons. Explore the typical Airbnb income in Caol across different performance tiers:
- Best-in-class properties (Top 10%) achieve $4,412+ monthly, often utilizing dynamic pricing and superior guest experiences.
- Strong performing properties (Top 25%) earn $3,450 or more, indicating effective management and desirable locations/amenities.
- Typical properties (Median) generate around $2,548 per month, representing the average market performance.
- Entry-level properties (Bottom 25%) see earnings around $1,695, often with potential for optimization.
Average Monthly Airbnb Earnings Trend in Caol
Caol Airbnb Occupancy Rate Trends (2025)
Maximize your bookings by understanding the Caol STR occupancy trends. Seasonal demand shifts significantly influence how often properties are booked. Typically, Julysees the highest demand (peak season occupancy), while January experiences the lowest (low season). Effective strategies, like adjusting minimum stays or offering promotions, can boost occupancy during slower periods. Here's how different property tiers perform in Caol:
- Best-in-class properties (Top 10%) achieve 79%+ occupancy, indicating high desirability and potentially optimized availability.
- Strong performing properties (Top 25%) maintain 68% or higher occupancy, suggesting good market fit and guest satisfaction.
- Typical properties (Median) have an occupancy rate around 54%.
- Entry-level properties (Bottom 25%) average 35% occupancy, potentially facing higher vacancy.
Average Monthly Occupancy Rate Trend in Caol
Average Daily Rate (ADR) Airbnb Trends in Caol (2025)
Effective short term rental pricing strategy in Caol involves understanding monthly ADR fluctuations. The Average Daily Rate (ADR) for Airbnb in Caol typically peaks in July and dips lowest during February. Leveraging Airbnb dynamic pricing tools or strategies based on this seasonality can significantly boost revenue. Here's a look at the typical nightly rates achieved:
- Best-in-class properties (Top 10%) command rates of $257+ per night, often due to premium features or locations.
- Strong performing properties (Top 25%) achieve nightly rates of $191 or more.
- Typical properties (Median) charge around $153 per night.
- Entry-level properties (Bottom 25%) earn around $121 per night.
Average Daily Rate (ADR) Trend by Month in Caol
Get Live Caol Market Intelligence 👇
Explore Real-time Analytics
Airbnb Seasonality Analysis & Trends in Caol (2025)
Peak Season (May, August, July)
- Revenue averages $4,241 per month
- Occupancy rates average 74.8%
- Daily rates average $179
Shoulder Season
- Revenue averages $3,061 per month
- Occupancy maintains around 51.8%
- Daily rates hold near $170
Low Season (January, February, March)
- Revenue drops to average $1,100 per month
- Occupancy decreases to average 27.4%
- Daily rates adjust to average $162
Seasonality Insights for Caol
- The Airbnb seasonality in Caol shows highly seasonal trends requiring careful strategy. While the sections above show seasonal averages, it's also insightful to look at the extremes:
- During the high season, the absolute peak month showcases Caol's highest earning potential, with monthly revenues capable of climbing to $4,329, occupancy reaching a high of 77.3%, and ADRs peaking at $181.
- Conversely, the slowest single month of the year, typically falling within the low season, marks the market's lowest point. In this month, revenue might dip to $998, occupancy could drop to 23.8%, and ADRs may adjust down to $160.
- Understanding both the seasonal averages and these monthly peaks and troughs in revenue, occupancy, and ADR is crucial for maximizing your Airbnb profit potential in Caol.
Seasonal Strategies for Maximizing Profit
- Peak Season: Maximize revenue through premium pricing and potentially longer minimum stays. Ensure high availability.
- Low Season: Offer competitive pricing, special promotions (e.g., extended stay discounts), and flexible cancellation policies. Target off-season travelers like remote workers or budget-conscious guests.
- Shoulder Seasons: Implement dynamic pricing that balances peak and low rates. Target weekend travelers or specific events. Offer slightly more flexible terms than peak season.
- Regularly analyze your own performance against these Caol seasonality benchmarks and adjust your pricing and availability strategy accordingly.
Best Areas for Airbnb Investment in Caol (2025)
Exploring the top neighborhoods for short-term rentals in Caol? This section highlights key areas, outlining why they are attractive for hosts and guests, along with notable local attractions. Consider these locations based on your target guest profile and investment strategy.
| Neighborhood / Area | Why Host Here? (Target Guests & Appeal) | Key Attractions & Landmarks |
|---|---|---|
| Inverness | Gateway to the Scottish Highlands, Inverness is a popular destination for tourists seeking natural beauty and historical sites. Its proximity to Loch Ness adds to its allure. | Loch Ness, Inverness Castle, Culloden Battlefield, Moray Firth, Fort George |
| Edinburgh | The capital city of Scotland, known for its rich history, festivals and stunning architecture. Ideal for year-round tourism, particularly during the Edinburgh Festival. | Edinburgh Castle, Royal Mile, Arthur's Seat, Holyrood Palace, Edinburgh Festival Fringe |
| Glasgow | Scotland's largest city, known for its vibrant culture, art scene, and shopping. A great choice for both business and leisure travelers. | Kelvingrove Art Gallery and Museum, Glasgow Science Centre, Riverside Museum, Buchanan Street, The SSE Hydro |
| Stirling | Home to the historic Stirling Castle and the Wallace Monument, Stirling is a city steeped in Scottish history, attracting visitors interested in the past. | Stirling Castle, Wallace Monument, Battlefield of Bannockburn, Stirling Old Town, The Church of the Holy Rude |
| Oban | A picturesque coastal town known as the gateway to the Isles. Perfect for tourists looking to explore the beautiful Scottish islands and seafood cuisine. | Oban Distillery, McCaig's Tower, Oban Harbour, Dunollie Castle, Nearby islands of Mull and Iona |
| Aberfeldy | Located near the stunning landscapes of the Scottish Highlands, Aberfeldy offers a peaceful retreat with plenty of outdoor activities, appealing to nature enthusiasts. | Birks of Aberfeldy, Black Watch Castle, Dunkeld Cathedral, River Tay, Loch Tay |
| Pitlochry | A charming town situated in the heart of Scotland, known for its Victorian architecture and as a hub for outdoor adventures, attracting nature lovers. | Pitlochry Festival Theatre, Salmon Ladder, Edradour Distillery, Blair Athol Distillery, Ben Vrackie |
| Isle of Skye | Famous for its rugged landscapes and natural beauty, the Isle of Skye is a top destination for photographers and nature lovers, ideal for unique Airbnb experiences. | Fairy Pools, Quiraing, Old Man of Storr, Dunvegan Castle, Portree |
Understanding Airbnb License Requirements & STR Laws in Caol (2025)
Yes, Caol, Scotland, United Kingdom enforces high STR regulations. Obtaining a license and ensuring compliance is almost certainly required according to current 2025 STR laws. Always verify the latest short term rental regulations and Airbnb license requirements directly with local government authorities for Caol to ensure full compliance before hosting.
(Source: AirROI data, 2025, based on 54% licensed listings)
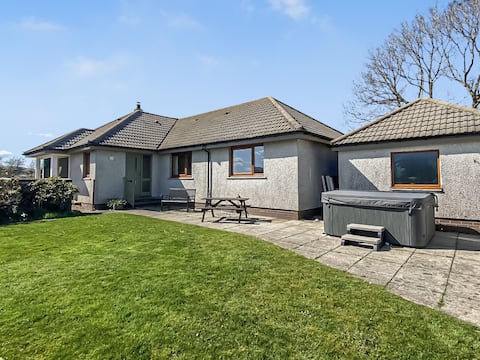
Top Performing Airbnb Properties in Caol (2025)
Benchmark your potential! Explore examples of top-performing Airbnb properties in Caolbased on Trailing Twelve Month (TTM) revenue. Analyze their characteristics, revenue, occupancy rate, and ADR to understand what drives success in this market.

18 Glenmallie Road, Caol , fort William
Entire Place • 3 bedrooms

Annie's Corner -Caol, Fort William
Entire Place • 3 bedrooms
Lapwing Rise
Entire Place • 4 bedrooms

Trabeag..Banavie..self catering 1 bedroom unit...❤
Entire Place • 1 bedroom

Enjoy Heron Lodge at Carmichael Croft Holidays
Entire Place • 1 bedroom

2 bed house in Fort William
Entire Place • 2 bedrooms
Note: Performance varies based on location, size, amenities, seasonality, and management quality. Data reflects the past 12 months.
Top Performing Airbnb Hosts in Caol (2025)
Learn from the best! This table showcases top-performing Airbnb hosts in Caol based on the number of properties managed and estimated total revenue over the past year. Analyze their scale and performance metrics.
| Host Name | Properties | Grossing Revenue | Stay Reviews | Avg Rating |
|---|---|---|---|---|
| Archie | 4 | $99,464 | 1251 | 4.79/5.0 |
| Lisa | 1 | $75,517 | 257 | 4.82/5.0 |
| Deborah | 2 | $70,054 | 115 | 4.96/5.0 |
| Peggy | 2 | $62,430 | 359 | 4.93/5.0 |
| Cottages | 2 | $61,553 | 15 | 4.96/5.0 |
| Gail | 1 | $47,639 | 82 | 4.87/5.0 |
| Corrina | 1 | $44,186 | 193 | 5.00/5.0 |
| Jade | 1 | $35,729 | 44 | 4.77/5.0 |
| Kelsey | 1 | $35,454 | 13 | 4.69/5.0 |
| Elaine | 1 | $35,434 | 32 | 4.94/5.0 |
Analyzing the strategies of top hosts, such as their property selection, pricing, and guest communication, can offer valuable lessons for optimizing your own Airbnb operations in Caol.
Dive Deeper: Advanced Caol STR Market Data (2025)
Ready to unlock more insights? AirROI provides access to advanced metrics and comprehensive Airbnb data for Caol. Explore detailed analytics beyond this report to refine your investment strategy, optimize pricing, and maximize your vacation rental profits.
Explore Advanced MetricsCaol Short-Term Rental Market Composition (2025): Property & Room Types
Room Type Distribution
Property Type Distribution
Market Composition Insights for Caol
- The Caol Airbnb market composition is heavily skewed towards Entire Home/Apt listings, which make up 63.4% of the 41 active rentals. This indicates strong guest preference for privacy and space.
- However, a notable 36.6% share for Private Rooms suggests opportunities for budget-conscious travelers or hosts renting out spare rooms.
- Looking at the property type distribution in Caol, House properties are the most common (65.9%), reflecting the local real estate landscape.
- Houses represent a significant 65.9% portion, catering likely to families or larger groups.
- Smaller segments like outdoor/unique, hotel/boutique (combined 9.8%) offer potential for unique stay experiences.
Caol Airbnb Room Capacity Analysis (2025): Bedroom Distribution
Distribution of Listings by Number of Bedrooms
Room Capacity Insights for Caol
- The dominant room capacity in Caol is 1 bedroom listings, making up 43.9% of the market. This suggests a strong demand for properties suitable for couples or solo travelers.
- Together, 1 bedroom and 2 bedrooms properties represent 58.5% of the active Airbnb listings in Caol, indicating a high concentration in these sizes.
- Listings with 3+ bedrooms (7.3%) represent a smaller niche, potentially indicating an underserved market for larger group accommodations in Caol.
Caol Vacation Rental Guest Capacity Trends (2025)
Distribution of Listings by Guest Capacity
Guest Capacity Insights for Caol
- The most common guest capacity trend in Caol vacation rentals is listings accommodating 2 guests (36.6%). This suggests the primary traveler segment is likely couples or solo travelers.
- Properties designed for 2 guests and 4 guests dominate the Caol STR market, accounting for 53.7% of listings.
- Listings for large groups (6+ guests) are relatively rare (4.8%), potentially indicating an opportunity for hosts targeting this segment in Caol.
- On average, properties in Caol are equipped to host 2.0 guests.
Caol Airbnb Booking Patterns (2025): Available vs. Booked Days
Available Days Distribution
Booked Days Distribution
Booking Pattern Insights for Caol
- The most common availability pattern in Caol falls within the 91-180 days range, representing 41.5% of listings. This suggests many properties have significant open periods on their calendars.
- Approximately 58.5% of listings show high availability (181+ days open annually), indicating potential for increased bookings or specific owner usage patterns.
- For booked days, the 91-180 days range is most frequent in Caol (39%), reflecting common guest stay durations or potential owner blocking patterns.
- A notable 41.4% of properties secure long booking periods (181+ days booked per year), highlighting successful long-term rental strategies or significant owner usage.
Caol Airbnb Minimum Stay Requirements Analysis
Distribution of Listings by Minimum Night Requirement
1 Night
16 listings
40% of total
2 Nights
13 listings
32.5% of total
3 Nights
4 listings
10% of total
30+ Nights
7 listings
17.5% of total
Key Insights
- The most prevalent minimum stay requirement in Caol is 1 Night, adopted by 40% of listings. This highlights the market's preference for shorter, flexible bookings.
- A strong majority (72.5%) of the Caol Airbnb data shows acceptance of very short stays (1-2 nights), indicating a dynamic, high-turnover market.
- A significant segment (17.5%) caters to monthly stays (30+ nights) in Caol, pointing to opportunities in the extended-stay market.
Recommendations
- Align with the market by considering a 1 Night minimum stay, as 40% of Caol hosts use this setting.
- Explore offering discounts for stays of 30+ nights to attract the 17.5% of the market seeking extended stays.
- Adjust minimum nights based on seasonality – potentially shorter during low season and longer during peak demand periods in Caol.
Caol Airbnb Cancellation Policy Trends Analysis (2025)
Super Strict 30 Days
1 listings
2.5% of total
Super Strict 60 Days
2 listings
5% of total
Flexible
7 listings
17.5% of total
Moderate
13 listings
32.5% of total
Firm
7 listings
17.5% of total
Strict
10 listings
25% of total
Cancellation Policy Insights for Caol
- The prevailing Airbnb cancellation policy trend in Caol is Moderate, used by 32.5% of listings.
- There's a relatively balanced mix between guest-friendly (50.0%) and stricter (42.5%) policies, offering choices for different guest needs.
Recommendations for Hosts
- Consider adopting a Moderate policy to align with the 32.5% market standard in Caol.
- Regularly review your cancellation policy against competitors and market demand shifts in Caol.
Caol STR Booking Lead Time Analysis (2025)
Average Booking Lead Time by Month
Booking Lead Time Insights for Caol
- The overall average booking lead time for vacation rentals in Caol is 64 days.
- Guests book furthest in advance for stays during May (average 95 days), likely coinciding with peak travel demand or local events.
- The shortest booking windows occur for stays in March (average 45 days), indicating more last-minute travel plans during this time.
- Seasonally, Summer (84 days avg.) sees the longest lead times, while Winter (55 days avg.) has the shortest, reflecting typical travel planning cycles.
Recommendations for Hosts
- Use the overall average lead time (64 days) as a baseline for your pricing and availability strategy in Caol.
- For May stays, consider implementing length-of-stay discounts or slightly higher rates for bookings made less than 95 days out to capitalize on advance planning.
- Target marketing efforts for the Summer season well in advance (at least 84 days) to capture early planners.
- Monitor your own booking lead times against these Caol averages to identify opportunities for dynamic pricing adjustments.
Popular & Essential Airbnb Amenities in Caol (2025)
Amenity Prevalence
Amenity Insights for Caol
- Essential amenities in Caol that guests expect include: Wifi, Smoke alarm, Heating. Lacking these (any) could significantly impact bookings.
- Popular amenities like TV, Hot water, Essentials are common but not universal. Offering these can provide a competitive edge.
Recommendations for Hosts
- Ensure your listing includes all essential amenities for Caol: Wifi, Smoke alarm, Heating.
- Prioritize adding missing essentials: Heating.
- Consider adding popular differentiators like TV or Hot water to increase appeal.
- Highlight unique or less common amenities you offer (e.g., hot tub, dedicated workspace, EV charger) in your listing description and photos.
- Regularly check competitor amenities in Caol to stay competitive.
Caol Airbnb Guest Demographics & Profile Analysis (2025)
Guest Profile Summary for Caol
- The typical guest profile for Airbnb in Caol consists of predominantly international visitors (70%), with top international origins including United States, typically belonging to the Post-2000s (Gen Z/Alpha) group (50%), primarily speaking English or German.
- Domestic travelers account for 30.4% of guests.
- Key international markets include United Kingdom (30.4%) and United States (18%).
- Top languages spoken are English (52.5%) followed by German (10.7%).
- A significant demographic segment is the Post-2000s (Gen Z/Alpha) group, representing 50% of guests.
Recommendations for Hosts
- Focus marketing internationally, particularly towards travelers from United States.
- Tailor amenities and listing descriptions to appeal to the dominant Post-2000s (Gen Z/Alpha) demographic (e.g., highlight fast WiFi, smart home features, local guides).
- Highlight unique local experiences or amenities relevant to the primary guest profile.
- Consider seasonal promotions aligned with peak travel times for key origin markets.
Nearby Short-Term Rental Market Comparison
How does the Caol Airbnb market stack up against its neighbors? Compare key performance metrics like average monthly revenue, ADR, and occupancy rates in surrounding areas to understand the broader regional STR landscape.
| Market | Active Properties | Monthly Revenue | Daily Rate | Avg. Occupancy |
|---|---|---|---|---|
| Galston | 11 | $7,951 | $676.77 | 46% |
| Fearnan | 19 | $6,440 | $421.92 | 53% |
| Kirkhill | 10 | $5,719 | $700.26 | 44% |
| Glenachulish | 33 | $5,609 | $424.51 | 46% |
| North Kessock | 10 | $5,421 | $380.62 | 58% |
| Carbost | 26 | $5,209 | $324.31 | 62% |
| Foyers | 14 | $5,076 | $274.52 | 64% |
| Arrochar | 33 | $5,045 | $339.11 | 56% |
| Whitebridge | 10 | $4,907 | $417.35 | 42% |
| Port Failthe | 14 | $4,832 | $301.12 | 57% |