Bridgend Airbnb Market Analysis 2025: Short Term Rental Data & Vacation Rental Statistics in Scotland, United Kingdom
Is Airbnb profitable in Bridgend in 2025? Explore comprehensive Airbnb analytics for Bridgend, Scotland, United Kingdom to uncover income potential. This 2025 STR market report for Bridgend, based on AirROI data from April 2024 to March 2025, reveals key trends in the niche market of 17 active listings.
Whether you're considering an Airbnb investment in Bridgend, optimizing your existing vacation rental, or exploring rental arbitrage opportunities, understanding the Bridgend Airbnb data is crucial. Understanding the local regulations is key to maximizing your short term rental income potential. Let's dive into the specifics.
Key Bridgend Airbnb Performance Metrics Overview
Monthly Airbnb Revenue Variations & Income Potential in Bridgend (2025)
Understanding the monthly revenue variations for Airbnb listings in Bridgend is key to maximizing your short term rental income potential. Seasonality significantly impacts earnings. Our analysis, based on data from the past 12 months, shows that the peak revenue month for STRs in Bridgend is typically August, while January often presents the lowest earnings, highlighting opportunities for strategic pricing adjustments during shoulder and low seasons. Explore the typical Airbnb income in Bridgend across different performance tiers:
- Best-in-class properties (Top 10%) achieve $5,134+ monthly, often utilizing dynamic pricing and superior guest experiences.
- Strong performing properties (Top 25%) earn $3,461 or more, indicating effective management and desirable locations/amenities.
- Typical properties (Median) generate around $2,457 per month, representing the average market performance.
- Entry-level properties (Bottom 25%) see earnings around $1,514, often with potential for optimization.
Average Monthly Airbnb Earnings Trend in Bridgend
Bridgend Airbnb Occupancy Rate Trends (2025)
Maximize your bookings by understanding the Bridgend STR occupancy trends. Seasonal demand shifts significantly influence how often properties are booked. Typically, Augustsees the highest demand (peak season occupancy), while January experiences the lowest (low season). Effective strategies, like adjusting minimum stays or offering promotions, can boost occupancy during slower periods. Here's how different property tiers perform in Bridgend:
- Best-in-class properties (Top 10%) achieve 70%+ occupancy, indicating high desirability and potentially optimized availability.
- Strong performing properties (Top 25%) maintain 63% or higher occupancy, suggesting good market fit and guest satisfaction.
- Typical properties (Median) have an occupancy rate around 45%.
- Entry-level properties (Bottom 25%) average 30% occupancy, potentially facing higher vacancy.
Average Monthly Occupancy Rate Trend in Bridgend
Average Daily Rate (ADR) Airbnb Trends in Bridgend (2025)
Effective short term rental pricing strategy in Bridgend involves understanding monthly ADR fluctuations. The Average Daily Rate (ADR) for Airbnb in Bridgend typically peaks in December and dips lowest during April. Leveraging Airbnb dynamic pricing tools or strategies based on this seasonality can significantly boost revenue. Here's a look at the typical nightly rates achieved:
- Best-in-class properties (Top 10%) command rates of $338+ per night, often due to premium features or locations.
- Strong performing properties (Top 25%) achieve nightly rates of $210 or more.
- Typical properties (Median) charge around $162 per night.
- Entry-level properties (Bottom 25%) earn around $129 per night.
Average Daily Rate (ADR) Trend by Month in Bridgend
Get Live Bridgend Market Intelligence 👇
Explore Real-time Analytics
Airbnb Seasonality Analysis & Trends in Bridgend (2025)
Peak Season (August, July, June)
- Revenue averages $4,015 per month
- Occupancy rates average 65.1%
- Daily rates average $180
Shoulder Season
- Revenue averages $2,655 per month
- Occupancy maintains around 45.4%
- Daily rates hold near $181
Low Season (January, February, December)
- Revenue drops to average $1,518 per month
- Occupancy decreases to average 27.5%
- Daily rates adjust to average $195
Seasonality Insights for Bridgend
- The Airbnb seasonality in Bridgend shows highly seasonal trends requiring careful strategy. While the sections above show seasonal averages, it's also insightful to look at the extremes:
- During the high season, the absolute peak month showcases Bridgend's highest earning potential, with monthly revenues capable of climbing to $4,559, occupancy reaching a high of 75.0%, and ADRs peaking at $200.
- Conversely, the slowest single month of the year, typically falling within the low season, marks the market's lowest point. In this month, revenue might dip to $1,243, occupancy could drop to 20.3%, and ADRs may adjust down to $173.
- Understanding both the seasonal averages and these monthly peaks and troughs in revenue, occupancy, and ADR is crucial for maximizing your Airbnb profit potential in Bridgend.
Seasonal Strategies for Maximizing Profit
- Peak Season: Maximize revenue through premium pricing and potentially longer minimum stays. Ensure high availability.
- Low Season: Offer competitive pricing, special promotions (e.g., extended stay discounts), and flexible cancellation policies. Target off-season travelers like remote workers or budget-conscious guests.
- Shoulder Seasons: Implement dynamic pricing that balances peak and low rates. Target weekend travelers or specific events. Offer slightly more flexible terms than peak season.
- Regularly analyze your own performance against these Bridgend seasonality benchmarks and adjust your pricing and availability strategy accordingly.
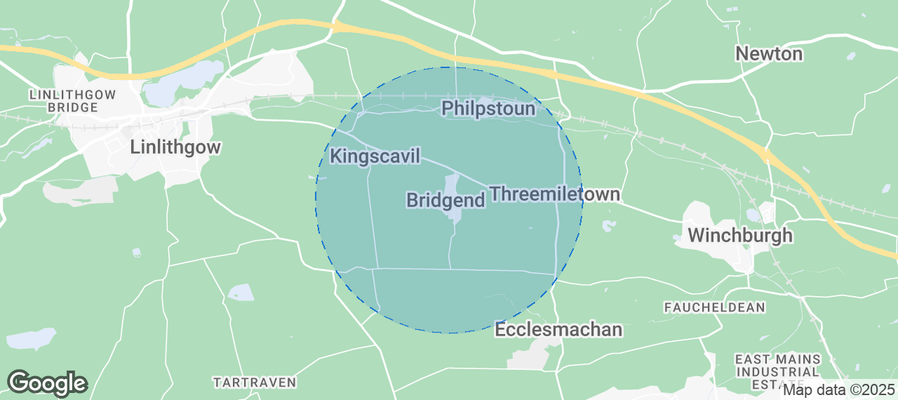
Best Areas for Airbnb Investment in Bridgend (2025)
Exploring the top neighborhoods for short-term rentals in Bridgend? This section highlights key areas, outlining why they are attractive for hosts and guests, along with notable local attractions. Consider these locations based on your target guest profile and investment strategy.
| Neighborhood / Area | Why Host Here? (Target Guests & Appeal) | Key Attractions & Landmarks |
|---|---|---|
| Porthcawl | A popular seaside resort known for its beautiful beaches and vibrant entertainment options. Ideal for tourists seeking a classic British seaside experience with easy access to coastal walks and attractions. | Coney Beach, Rest Bay, The Grand Pavilion, Porthcawl Harbour, Merthyr Mawr Sand Dunes, Porthcawl Lighthouse |
| Bridgend Town Centre | The heart of Bridgend, offering a mix of shopping, dining, and entertainment. Attracts both locals and visitors, making it a convenient and accessible area for tourists. | St. John the Baptist Parish Church, Newcastle Hill, Bridgend Shopping Centre, Hannah's at Dr. Who Experience, Ogmore Castle |
| Ogmore-by-Sea | A quaint coastal village with stunning views and natural beauty. Ideal for those looking for a peaceful retreat and outdoor activities like hiking and beach walks. | Ogmore Beach, Ogmore Castle, Merthyr Mawr Sand Dunes, River Ogmore, The Glamorgan Heritage Coast |
| Cwm Taf | Known for its rich history and scenic landscapes, Cwm Taf is ideal for nature lovers and families looking for a mix of outdoor activities and historical exploration. | Cwm Taf Forest Park, The Brecon Beacons, The River Taff, Local walking trails, Cultural heritage sites |
| Royal Porthcawl Golf Club | One of the top golf courses in Wales attracting golf enthusiasts from all over. The area offers stunning coastal views and is perfect for golf lovers on holiday. | Porthcawl Golf Club, Views of the Bristol Channel, Nearby beaches, Golf tournaments, Local dining spots |
| Bridgend Industrial Estate | A hub of business and logistics with numerous corporate travelers. Ideal for hosting short-term business accommodations. | Local workplaces, Transport hubs, Nearby warehouses and commercial properties, Amenities for business travelers |
| Trecco Bay | A family-friendly holiday park destination that attracts visitors looking for fun and entertainment. This is a great area for those hosting families and groups. | Trecco Bay Holiday Park, Beach amenities, Amusement arcade, Water parks, Family-friendly pubs |
| Kenfig Nature Reserve | A stunning natural reserve that offers beautiful landscapes and wildlife. Attracts eco-tourists and those seeking tranquility in nature. | Kenfig Pool, Nature trails, Diverse wildlife, Historical sites, Panoramic views from the dunes |
Understanding Airbnb License Requirements & STR Laws in Bridgend (2025)
With 12% of listings showing registration in 2025, understanding potential Airbnb license requirements is crucial in Bridgend. Always verify the latest short term rental regulations and Airbnb license requirements directly with local government authorities for Bridgend to ensure full compliance before hosting.
(Source: AirROI data, 2025, based on 12% licensed listings)
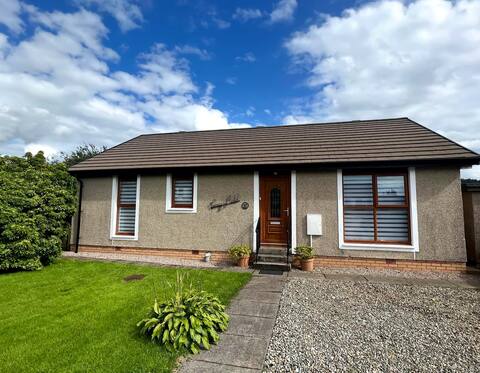
Top Performing Airbnb Properties in Bridgend (2025)
Benchmark your potential! Explore examples of top-performing Airbnb properties in Bridgendbased on Trailing Twelve Month (TTM) revenue. Analyze their characteristics, revenue, occupancy rate, and ADR to understand what drives success in this market.

Idyllic Royal hillfort - stunning views
Entire Place • 3 bedrooms

Cross House East - Cottage by the Beach
Entire Place • 3 bedrooms
Craig Add -WiFi, private garden and king beds
Entire Place • 3 bedrooms

Cross House West - Cottage Close to the Beach
Entire Place • 3 bedrooms

Octovullin Byre
Entire Place • 4 bedrooms

Kings Reach - Dunadd Cottage
Entire Place • 2 bedrooms
Note: Performance varies based on location, size, amenities, seasonality, and management quality. Data reflects the past 12 months.
Top Performing Airbnb Hosts in Bridgend (2025)
Learn from the best! This table showcases top-performing Airbnb hosts in Bridgend based on the number of properties managed and estimated total revenue over the past year. Analyze their scale and performance metrics.
| Host Name | Properties | Grossing Revenue | Stay Reviews | Avg Rating |
|---|---|---|---|---|
| Iain | 2 | $86,981 | 85 | 4.96/5.0 |
| Kirsty | 2 | $71,003 | 54 | 4.87/5.0 |
| Emily | 3 | $65,771 | 36 | 4.61/5.0 |
| Adrian | 1 | $55,661 | 212 | 4.93/5.0 |
| Fiona Graham And Calum | 2 | $40,699 | 229 | 4.88/5.0 |
| Ela | 1 | $39,419 | 42 | 4.98/5.0 |
| Theresa-Marie | 1 | $32,364 | 30 | 4.77/5.0 |
| Lindsey | 1 | $27,503 | 72 | 4.99/5.0 |
| Iona & Andrew | 1 | $25,470 | 112 | 4.99/5.0 |
| Isla | 1 | $18,687 | 72 | 4.88/5.0 |
Analyzing the strategies of top hosts, such as their property selection, pricing, and guest communication, can offer valuable lessons for optimizing your own Airbnb operations in Bridgend.
Dive Deeper: Advanced Bridgend STR Market Data (2025)
Ready to unlock more insights? AirROI provides access to advanced metrics and comprehensive Airbnb data for Bridgend. Explore detailed analytics beyond this report to refine your investment strategy, optimize pricing, and maximize your vacation rental profits.
Explore Advanced MetricsBridgend Short-Term Rental Market Composition (2025): Property & Room Types
Room Type Distribution
Property Type Distribution
Market Composition Insights for Bridgend
- The Bridgend Airbnb market composition is heavily skewed towards Entire Home/Apt listings, which make up 82.4% of the 17 active rentals. This indicates strong guest preference for privacy and space.
- Looking at the property type distribution in Bridgend, House properties are the most common (82.4%), reflecting the local real estate landscape.
- Houses represent a significant 82.4% portion, catering likely to families or larger groups.
- The presence of 11.8% Hotel/Boutique listings indicates integration with traditional hospitality.
Bridgend Airbnb Room Capacity Analysis (2025): Bedroom Distribution
Distribution of Listings by Number of Bedrooms
Room Capacity Insights for Bridgend
- The dominant room capacity in Bridgend is 2 bedrooms listings, making up 35.3% of the market. This suggests a strong demand for properties suitable for couples or solo travelers.
- Together, 2 bedrooms and 3 bedrooms properties represent 64.7% of the active Airbnb listings in Bridgend, indicating a high concentration in these sizes.
- A significant 41.2% of listings offer 3+ bedrooms, catering to larger groups and families seeking more space in Bridgend.
Bridgend Vacation Rental Guest Capacity Trends (2025)
Distribution of Listings by Guest Capacity
Guest Capacity Insights for Bridgend
- The most common guest capacity trend in Bridgend vacation rentals is listings accommodating 6 guests (29.4%). This suggests the primary traveler segment is likely larger groups.
- Properties designed for 6 guests and 4 guests dominate the Bridgend STR market, accounting for 52.9% of listings.
- 47.1% of properties accommodate 6+ guests, serving the market segment for larger families or group travel in Bridgend.
- On average, properties in Bridgend are equipped to host 4.3 guests.
Bridgend Airbnb Booking Patterns (2025): Available vs. Booked Days
Available Days Distribution
Booked Days Distribution
Booking Pattern Insights for Bridgend
- The most common availability pattern in Bridgend falls within the 91-180 days range, representing 47.1% of listings. This suggests many properties have significant open periods on their calendars.
- Approximately 52.9% of listings show high availability (181+ days open annually), indicating potential for increased bookings or specific owner usage patterns.
- For booked days, the 181-270 days range is most frequent in Bridgend (47.1%), reflecting common guest stay durations or potential owner blocking patterns.
- A notable 47.1% of properties secure long booking periods (181+ days booked per year), highlighting successful long-term rental strategies or significant owner usage.
Bridgend Airbnb Minimum Stay Requirements Analysis
Distribution of Listings by Minimum Night Requirement
1 Night
2 listings
11.8% of total
2 Nights
6 listings
35.3% of total
3 Nights
3 listings
17.6% of total
4-6 Nights
1 listings
5.9% of total
7-29 Nights
3 listings
17.6% of total
30+ Nights
2 listings
11.8% of total
Key Insights
- The most prevalent minimum stay requirement in Bridgend is 2 Nights, adopted by 35.3% of listings. This highlights the market's preference for shorter, flexible bookings.
- A significant segment (11.8%) caters to monthly stays (30+ nights) in Bridgend, pointing to opportunities in the extended-stay market.
Recommendations
- Align with the market by considering a 2 Nights minimum stay, as 35.3% of Bridgend hosts use this setting.
- If feasible, allowing 1-night stays, especially midweek or during low season, could capture last-minute bookings, as only 11.8% currently do.
- A 2-night minimum appears standard (35.3%). Consider this for weekends or peak periods.
- Explore offering discounts for stays of 30+ nights to attract the 11.8% of the market seeking extended stays.
- Adjust minimum nights based on seasonality – potentially shorter during low season and longer during peak demand periods in Bridgend.
Bridgend Airbnb Cancellation Policy Trends Analysis (2025)
Super Strict 60 Days
1 listings
5.9% of total
Flexible
5 listings
29.4% of total
Moderate
1 listings
5.9% of total
Firm
3 listings
17.6% of total
Strict
7 listings
41.2% of total
Cancellation Policy Insights for Bridgend
- The prevailing Airbnb cancellation policy trend in Bridgend is Strict, used by 41.2% of listings.
- A majority (58.8%) of hosts in Bridgend utilize Firm or Strict policies, indicating a market where hosts prioritize booking security.
Recommendations for Hosts
- Consider adopting a Strict policy to align with the 41.2% market standard in Bridgend.
- With 41.2% using Strict terms, this is a viable option in Bridgend, particularly for high-value properties or during peak demand periods.
- Regularly review your cancellation policy against competitors and market demand shifts in Bridgend.
Bridgend STR Booking Lead Time Analysis (2025)
Average Booking Lead Time by Month
Booking Lead Time Insights for Bridgend
- The overall average booking lead time for vacation rentals in Bridgend is 68 days.
- Guests book furthest in advance for stays during October (average 104 days), likely coinciding with peak travel demand or local events.
- The shortest booking windows occur for stays in November (average 17 days), indicating more last-minute travel plans during this time.
- Seasonally, Summer (88 days avg.) sees the longest lead times, while Winter (39 days avg.) has the shortest, reflecting typical travel planning cycles.
Recommendations for Hosts
- Use the overall average lead time (68 days) as a baseline for your pricing and availability strategy in Bridgend.
- For October stays, consider implementing length-of-stay discounts or slightly higher rates for bookings made less than 104 days out to capitalize on advance planning.
- Target marketing efforts for the Summer season well in advance (at least 88 days) to capture early planners.
- Monitor your own booking lead times against these Bridgend averages to identify opportunities for dynamic pricing adjustments.
Popular & Essential Airbnb Amenities in Bridgend (2025)
Amenity Prevalence
Amenity Insights for Bridgend
- Essential amenities in Bridgend that guests expect include: TV. Lacking these (this) could significantly impact bookings.
- Popular amenities like Free parking on premises, Smoke alarm, Heating are common but not universal. Offering these can provide a competitive edge.
- Warning: Wifi is not universally provided but is considered essential globally. Ensure reliable Wifi is offered.
Recommendations for Hosts
- Ensure your listing includes all essential amenities for Bridgend: TV.
- Consider adding popular differentiators like Free parking on premises or Smoke alarm to increase appeal.
- Highlight unique or less common amenities you offer (e.g., hot tub, dedicated workspace, EV charger) in your listing description and photos.
- Regularly check competitor amenities in Bridgend to stay competitive.
Bridgend Airbnb Guest Demographics & Profile Analysis (2025)
Guest Profile Summary for Bridgend
- The typical guest profile for Airbnb in Bridgend consists of primarily domestic travelers (66%), often arriving from nearby Glasgow, typically belonging to the Post-2000s (Gen Z/Alpha) group (50%), primarily speaking English or Spanish.
- Domestic travelers account for 65.8% of guests.
- Key international markets include United Kingdom (65.8%) and United States (7.6%).
- Top languages spoken are English (52.3%) followed by Spanish (7.8%).
- A significant demographic segment is the Post-2000s (Gen Z/Alpha) group, representing 50% of guests.
Recommendations for Hosts
- Target domestic marketing efforts towards travelers from Glasgow and Edinburgh.
- Tailor amenities and listing descriptions to appeal to the dominant Post-2000s (Gen Z/Alpha) demographic (e.g., highlight fast WiFi, smart home features, local guides).
- Highlight unique local experiences or amenities relevant to the primary guest profile.
- Consider seasonal promotions aligned with peak travel times for key origin markets.
Nearby Short-Term Rental Market Comparison
How does the Bridgend Airbnb market stack up against its neighbors? Compare key performance metrics like average monthly revenue, ADR, and occupancy rates in surrounding areas to understand the broader regional STR landscape.
| Market | Active Properties | Monthly Revenue | Daily Rate | Avg. Occupancy |
|---|---|---|---|---|
| Galston | 11 | $7,951 | $676.77 | 46% |
| Fearnan | 19 | $6,440 | $421.92 | 53% |
| Glenachulish | 33 | $5,609 | $424.51 | 46% |
| Arrochar | 33 | $5,045 | $339.11 | 56% |
| Acharn | 10 | $4,813 | $278.43 | 57% |
| Croftamie | 19 | $4,609 | $267.39 | 52% |
| Carrick Castle | 11 | $4,591 | $586.01 | 42% |
| Corran | 24 | $4,576 | $370.68 | 45% |
| Gartocharn | 15 | $4,426 | $354.91 | 46% |
| Bruichladdich | 17 | $4,306 | $295.85 | 58% |