Braemar Airbnb Market Analysis 2025: Short Term Rental Data & Vacation Rental Statistics in Scotland, United Kingdom
Is Airbnb profitable in Braemar in 2025? Explore comprehensive Airbnb analytics for Braemar, Scotland, United Kingdom to uncover income potential. This 2025 STR market report for Braemar, based on AirROI data from April 2024 to March 2025, reveals key trends in the niche market of 32 active listings.
Whether you're considering an Airbnb investment in Braemar, optimizing your existing vacation rental, or exploring rental arbitrage opportunities, understanding the Braemar Airbnb data is crucial. Understanding the local regulations is key to maximizing your short term rental income potential. Let's dive into the specifics.
Key Braemar Airbnb Performance Metrics Overview
Monthly Airbnb Revenue Variations & Income Potential in Braemar (2025)
Understanding the monthly revenue variations for Airbnb listings in Braemar is key to maximizing your short term rental income potential. Seasonality significantly impacts earnings. Our analysis, based on data from the past 12 months, shows that the peak revenue month for STRs in Braemar is typically June, while March often presents the lowest earnings, highlighting opportunities for strategic pricing adjustments during shoulder and low seasons. Explore the typical Airbnb income in Braemar across different performance tiers:
- Best-in-class properties (Top 10%) achieve $6,109+ monthly, often utilizing dynamic pricing and superior guest experiences.
- Strong performing properties (Top 25%) earn $4,236 or more, indicating effective management and desirable locations/amenities.
- Typical properties (Median) generate around $3,026 per month, representing the average market performance.
- Entry-level properties (Bottom 25%) see earnings around $1,797, often with potential for optimization.
Average Monthly Airbnb Earnings Trend in Braemar
Braemar Airbnb Occupancy Rate Trends (2025)
Maximize your bookings by understanding the Braemar STR occupancy trends. Seasonal demand shifts significantly influence how often properties are booked. Typically, Augustsees the highest demand (peak season occupancy), while January experiences the lowest (low season). Effective strategies, like adjusting minimum stays or offering promotions, can boost occupancy during slower periods. Here's how different property tiers perform in Braemar:
- Best-in-class properties (Top 10%) achieve 84%+ occupancy, indicating high desirability and potentially optimized availability.
- Strong performing properties (Top 25%) maintain 70% or higher occupancy, suggesting good market fit and guest satisfaction.
- Typical properties (Median) have an occupancy rate around 54%.
- Entry-level properties (Bottom 25%) average 27% occupancy, potentially facing higher vacancy.
Average Monthly Occupancy Rate Trend in Braemar
Average Daily Rate (ADR) Airbnb Trends in Braemar (2025)
Effective short term rental pricing strategy in Braemar involves understanding monthly ADR fluctuations. The Average Daily Rate (ADR) for Airbnb in Braemar typically peaks in December and dips lowest during October. Leveraging Airbnb dynamic pricing tools or strategies based on this seasonality can significantly boost revenue. Here's a look at the typical nightly rates achieved:
- Best-in-class properties (Top 10%) command rates of $439+ per night, often due to premium features or locations.
- Strong performing properties (Top 25%) achieve nightly rates of $283 or more.
- Typical properties (Median) charge around $184 per night.
- Entry-level properties (Bottom 25%) earn around $138 per night.
Average Daily Rate (ADR) Trend by Month in Braemar
Get Live Braemar Market Intelligence 👇

Explore Real-time Analytics
Airbnb Seasonality Analysis & Trends in Braemar (2025)
Peak Season (June, August, July)
- Revenue averages $4,930 per month
- Occupancy rates average 64.3%
- Daily rates average $243
Shoulder Season
- Revenue averages $3,469 per month
- Occupancy maintains around 50.7%
- Daily rates hold near $249
Low Season (January, February, March)
- Revenue drops to average $1,964 per month
- Occupancy decreases to average 35.6%
- Daily rates adjust to average $276
Seasonality Insights for Braemar
- The Airbnb seasonality in Braemar shows highly seasonal trends requiring careful strategy. While the sections above show seasonal averages, it's also insightful to look at the extremes:
- During the high season, the absolute peak month showcases Braemar's highest earning potential, with monthly revenues capable of climbing to $5,639, occupancy reaching a high of 72.1%, and ADRs peaking at $285.
- Conversely, the slowest single month of the year, typically falling within the low season, marks the market's lowest point. In this month, revenue might dip to $1,794, occupancy could drop to 32.6%, and ADRs may adjust down to $234.
- Understanding both the seasonal averages and these monthly peaks and troughs in revenue, occupancy, and ADR is crucial for maximizing your Airbnb profit potential in Braemar.
Seasonal Strategies for Maximizing Profit
- Peak Season: Maximize revenue through premium pricing and potentially longer minimum stays. Ensure high availability.
- Low Season: Offer competitive pricing, special promotions (e.g., extended stay discounts), and flexible cancellation policies. Target off-season travelers like remote workers or budget-conscious guests.
- Shoulder Seasons: Implement dynamic pricing that balances peak and low rates. Target weekend travelers or specific events. Offer slightly more flexible terms than peak season.
- Regularly analyze your own performance against these Braemar seasonality benchmarks and adjust your pricing and availability strategy accordingly.
Best Areas for Airbnb Investment in Braemar (2025)
Exploring the top neighborhoods for short-term rentals in Braemar? This section highlights key areas, outlining why they are attractive for hosts and guests, along with notable local attractions. Consider these locations based on your target guest profile and investment strategy.
| Neighborhood / Area | Why Host Here? (Target Guests & Appeal) | Key Attractions & Landmarks |
|---|---|---|
| Braemar Village | Charming village in the heart of the Scottish Highlands, known for its picturesque scenery and historical significance. A popular base for outdoor activities like hiking and mountain biking. | Braemar Castle, The Braemar Gathering, The Old Packhorse Bridge, Loch Callater, Clova Hill, Royal Lochnagar Distillery |
| Cairngorms National Park | Scotland's largest national park, offering stunning landscapes and diverse wildlife. A hotspot for nature lovers, outdoor enthusiasts, and those seeking tranquility in nature. | Loch Morlich, Cairn Gorm Mountain, Avon Valley, Rothiemurchus Estate, Highland Wildlife Park, The Speyside Way |
| Glenshee Ski Centre | One of Scotland's top locations for skiing and snowboarding. Attracts winter sports enthusiasts and provides year-round outdoor activities. | Glenshee Ski Centre, The UK’s largest ski area, Various ski slopes and trails, Walking and hiking paths in summer |
| Mar Lodge Estate | A stunning natural estate with beautiful landscapes and rich wildlife. Ideal for hiking and enjoying the secluded beauty of the Highlands. | Mar Lodge, The River Dee, Wildlife watching, Cairngorms hiking trails |
| Royal Deeside | Famous for its scenic beauty and royal connections, this area is perfect for visitors interested in history and nature. | Balmoral Castle, The Dee River, Dinnet National Nature Reserve, Aboyne Castle |
| Deeside Railway Line | A historic railway path that has been transformed into a walking and cycling route. Great for leisure activities and exploring the picturesque Deeside area. | Deeside Railway Path, Panoramic views of the surrounding countryside, Wildlife and nature watching |
| Ballater | A charming village close to Braemar, known for its Victorian architecture and whisky distilleries. A gateway to exploring the Cairngorms. | Ballater Highland Games, Victorian heritage buildings, Loch Muick, Craigendarroch Hill Viewpoint |
| Tomintoul | Known as Scotland's highest village, it offers a unique highland experience with access to beautiful landscapes and outdoor adventures. | Tomintoul Distillery, Glenshee, Wildlife trails, Local arts and crafts shops |
Understanding Airbnb License Requirements & STR Laws in Braemar (2025)
With 28% of listings showing registration in 2025, understanding potential Airbnb license requirements is crucial in Braemar. Always verify the latest short term rental regulations and Airbnb license requirements directly with local government authorities for Braemar to ensure full compliance before hosting.
(Source: AirROI data, 2025, based on 28% licensed listings)
Top Performing Airbnb Properties in Braemar (2025)
Benchmark your potential! Explore examples of top-performing Airbnb properties in Braemarbased on Trailing Twelve Month (TTM) revenue. Analyze their characteristics, revenue, occupancy rate, and ADR to understand what drives success in this market.
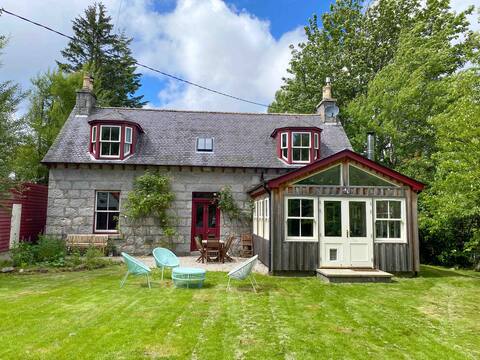
Grampian Cottage
Entire Place • 4 bedrooms
Traditional and modern cottage in Royal Deeside
Entire Place • 4 bedrooms
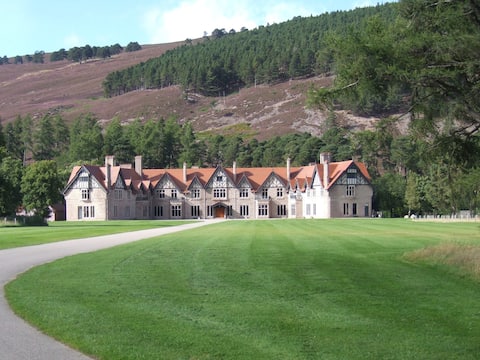
Bynack - Mar Lodge Estate
Entire Place • 8 bedrooms
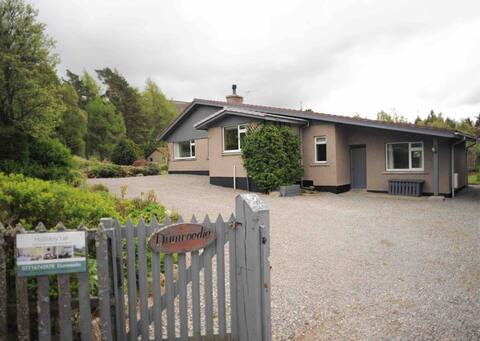
Dunwoodie, Braemar 3 Bedroom Home with a View
Entire Place • 3 bedrooms

2 bed cabin with on site parking and great views
Entire Place • 2 bedrooms
Chalets 2 minutes walk Braemar
Entire Place • 3 bedrooms
Note: Performance varies based on location, size, amenities, seasonality, and management quality. Data reflects the past 12 months.
Top Performing Airbnb Hosts in Braemar (2025)
Learn from the best! This table showcases top-performing Airbnb hosts in Braemar based on the number of properties managed and estimated total revenue over the past year. Analyze their scale and performance metrics.
| Host Name | Properties | Grossing Revenue | Stay Reviews | Avg Rating |
|---|---|---|---|---|
| Sykes Holiday Cottages Limited | 3 | $89,475 | 7 | 3.00/5.0 |
| Jenny And Fergus | 1 | $83,908 | 125 | 4.98/5.0 |
| Gail | 1 | $75,180 | 57 | 4.95/5.0 |
| Anna | 4 | $70,312 | 59 | 3.46/5.0 |
| Nicola | 1 | $54,045 | 84 | 4.99/5.0 |
| Julie | 1 | $50,658 | 162 | 4.83/5.0 |
| Malcolm | 1 | $50,017 | 27 | 4.85/5.0 |
| Elaine | 1 | $46,691 | 108 | 4.96/5.0 |
| Mark And Lesley | 1 | $41,714 | 300 | 4.71/5.0 |
| Natalie | 3 | $40,850 | 571 | 4.90/5.0 |
Analyzing the strategies of top hosts, such as their property selection, pricing, and guest communication, can offer valuable lessons for optimizing your own Airbnb operations in Braemar.
Dive Deeper: Advanced Braemar STR Market Data (2025)
Ready to unlock more insights? AirROI provides access to advanced metrics and comprehensive Airbnb data for Braemar. Explore detailed analytics beyond this report to refine your investment strategy, optimize pricing, and maximize your vacation rental profits.
Explore Advanced MetricsBraemar Short-Term Rental Market Composition (2025): Property & Room Types
Room Type Distribution
Property Type Distribution
Market Composition Insights for Braemar
- The Braemar Airbnb market composition is heavily skewed towards Entire Home/Apt listings, which make up 90.6% of the 32 active rentals. This indicates strong guest preference for privacy and space.
- Looking at the property type distribution in Braemar, House properties are the most common (62.5%), reflecting the local real estate landscape.
- Houses represent a significant 62.5% portion, catering likely to families or larger groups.
- The presence of 12.5% Hotel/Boutique listings indicates integration with traditional hospitality.
- Smaller segments like others (combined 3.1%) offer potential for unique stay experiences.
Braemar Airbnb Room Capacity Analysis (2025): Bedroom Distribution
Distribution of Listings by Number of Bedrooms
Room Capacity Insights for Braemar
- The dominant room capacity in Braemar is 2 bedrooms listings, making up 31.3% of the market. This suggests a strong demand for properties suitable for couples or solo travelers.
- Together, 2 bedrooms and 3 bedrooms properties represent 56.3% of the active Airbnb listings in Braemar, indicating a high concentration in these sizes.
- A significant 46.9% of listings offer 3+ bedrooms, catering to larger groups and families seeking more space in Braemar.
Braemar Vacation Rental Guest Capacity Trends (2025)
Distribution of Listings by Guest Capacity
Guest Capacity Insights for Braemar
- The most common guest capacity trend in Braemar vacation rentals is listings accommodating 4 guests (28.1%). This suggests the primary traveler segment is likely small families or groups.
- Properties designed for 4 guests and 8+ guests dominate the Braemar STR market, accounting for 46.9% of listings.
- 43.9% of properties accommodate 6+ guests, serving the market segment for larger families or group travel in Braemar.
- On average, properties in Braemar are equipped to host 4.8 guests.
Braemar Airbnb Booking Patterns (2025): Available vs. Booked Days
Available Days Distribution
Booked Days Distribution
Booking Pattern Insights for Braemar
- The most common availability pattern in Braemar falls within the 271-366 days range, representing 37.5% of listings. This suggests many properties have significant open periods on their calendars.
- Approximately 62.5% of listings show high availability (181+ days open annually), indicating potential for increased bookings or specific owner usage patterns.
- For booked days, the 181-270 days range is most frequent in Braemar (31.3%), reflecting common guest stay durations or potential owner blocking patterns.
- A notable 37.6% of properties secure long booking periods (181+ days booked per year), highlighting successful long-term rental strategies or significant owner usage.
Braemar Airbnb Minimum Stay Requirements Analysis
Distribution of Listings by Minimum Night Requirement
1 Night
10 listings
31.3% of total
2 Nights
5 listings
15.6% of total
3 Nights
6 listings
18.8% of total
4-6 Nights
4 listings
12.5% of total
7-29 Nights
1 listings
3.1% of total
30+ Nights
6 listings
18.8% of total
Key Insights
- The most prevalent minimum stay requirement in Braemar is 1 Night, adopted by 31.3% of listings. This highlights the market's preference for shorter, flexible bookings.
- A significant segment (18.8%) caters to monthly stays (30+ nights) in Braemar, pointing to opportunities in the extended-stay market.
Recommendations
- Align with the market by considering a 1 Night minimum stay, as 31.3% of Braemar hosts use this setting.
- Explore offering discounts for stays of 30+ nights to attract the 18.8% of the market seeking extended stays.
- Adjust minimum nights based on seasonality – potentially shorter during low season and longer during peak demand periods in Braemar.
Braemar Airbnb Cancellation Policy Trends Analysis (2025)
Super Strict 60 Days
3 listings
10% of total
Flexible
3 listings
10% of total
Moderate
4 listings
13.3% of total
Firm
5 listings
16.7% of total
Strict
15 listings
50% of total
Cancellation Policy Insights for Braemar
- The prevailing Airbnb cancellation policy trend in Braemar is Strict, used by 50% of listings.
- A majority (66.7%) of hosts in Braemar utilize Firm or Strict policies, indicating a market where hosts prioritize booking security.
Recommendations for Hosts
- Consider adopting a Strict policy to align with the 50% market standard in Braemar.
- With 50% using Strict terms, this is a viable option in Braemar, particularly for high-value properties or during peak demand periods.
- Regularly review your cancellation policy against competitors and market demand shifts in Braemar.
Braemar STR Booking Lead Time Analysis (2025)
Average Booking Lead Time by Month
Booking Lead Time Insights for Braemar
- The overall average booking lead time for vacation rentals in Braemar is 111 days.
- Guests book furthest in advance for stays during September (average 169 days), likely coinciding with peak travel demand or local events.
- The shortest booking windows occur for stays in February (average 48 days), indicating more last-minute travel plans during this time.
- Seasonally, Summer (148 days avg.) sees the longest lead times, while Winter (67 days avg.) has the shortest, reflecting typical travel planning cycles.
Recommendations for Hosts
- Use the overall average lead time (111 days) as a baseline for your pricing and availability strategy in Braemar.
- For September stays, consider implementing length-of-stay discounts or slightly higher rates for bookings made less than 169 days out to capitalize on advance planning.
- Target marketing efforts for the Summer season well in advance (at least 148 days) to capture early planners.
- Monitor your own booking lead times against these Braemar averages to identify opportunities for dynamic pricing adjustments.
Popular & Essential Airbnb Amenities in Braemar (2025)
Amenity Prevalence
Amenity Insights for Braemar
- Essential amenities in Braemar that guests expect include: Smoke alarm, Heating, Free parking on premises. Lacking these (any) could significantly impact bookings.
- Popular amenities like Hot water, Essentials, Wifi are common but not universal. Offering these can provide a competitive edge.
- Warning: Wifi is not universally provided but is considered essential globally. Ensure reliable Wifi is offered.
Recommendations for Hosts
- Ensure your listing includes all essential amenities for Braemar: Smoke alarm, Heating, Free parking on premises.
- Consider adding popular differentiators like Hot water or Essentials to increase appeal.
- Highlight unique or less common amenities you offer (e.g., hot tub, dedicated workspace, EV charger) in your listing description and photos.
- Regularly check competitor amenities in Braemar to stay competitive.
Braemar Airbnb Guest Demographics & Profile Analysis (2025)
Guest Profile Summary for Braemar
- The typical guest profile for Airbnb in Braemar consists of primarily domestic travelers (74%), often arriving from nearby Edinburgh, typically belonging to the Post-2000s (Gen Z/Alpha) group (50%), primarily speaking English or French.
- Domestic travelers account for 74.0% of guests.
- Key international markets include United Kingdom (74%) and United States (9.2%).
- Top languages spoken are English (66.4%) followed by French (9.4%).
- A significant demographic segment is the Post-2000s (Gen Z/Alpha) group, representing 50% of guests.
Recommendations for Hosts
- Target domestic marketing efforts towards travelers from Edinburgh and England.
- Tailor amenities and listing descriptions to appeal to the dominant Post-2000s (Gen Z/Alpha) demographic (e.g., highlight fast WiFi, smart home features, local guides).
- Highlight unique local experiences or amenities relevant to the primary guest profile.
- Consider seasonal promotions aligned with peak travel times for key origin markets.
Nearby Short-Term Rental Market Comparison
How does the Braemar Airbnb market stack up against its neighbors? Compare key performance metrics like average monthly revenue, ADR, and occupancy rates in surrounding areas to understand the broader regional STR landscape.
| Market | Active Properties | Monthly Revenue | Daily Rate | Avg. Occupancy |
|---|---|---|---|---|
| Fearnan | 19 | $6,440 | $421.92 | 53% |
| Bridge of Cally | 16 | $5,839 | $566.24 | 50% |
| Kirkhill | 10 | $5,719 | $700.26 | 44% |
| North Kessock | 10 | $5,421 | $380.62 | 58% |
| Foyers | 14 | $5,076 | $274.52 | 64% |
| Arrochar | 33 | $5,045 | $339.11 | 56% |
| Whitebridge | 10 | $4,907 | $417.35 | 42% |
| Acharn | 10 | $4,813 | $278.43 | 57% |
| Croftamie | 19 | $4,609 | $267.39 | 52% |
| Carrick Castle | 11 | $4,591 | $586.01 | 42% |