Banff Airbnb Market Analysis 2025: Short Term Rental Data & Vacation Rental Statistics in Scotland, United Kingdom
Is Airbnb profitable in Banff in 2025? Explore comprehensive Airbnb analytics for Banff, Scotland, United Kingdom to uncover income potential. This 2025 STR market report for Banff, based on AirROI data from April 2024 to March 2025, reveals key trends in the niche market of 27 active listings.
Whether you're considering an Airbnb investment in Banff, optimizing your existing vacation rental, or exploring rental arbitrage opportunities, understanding the Banff Airbnb data is crucial. Understanding the local regulations is key to maximizing your short term rental income potential. Let's dive into the specifics.
Key Banff Airbnb Performance Metrics Overview
Monthly Airbnb Revenue Variations & Income Potential in Banff (2025)
Understanding the monthly revenue variations for Airbnb listings in Banff is key to maximizing your short term rental income potential. Seasonality significantly impacts earnings. Our analysis, based on data from the past 12 months, shows that the peak revenue month for STRs in Banff is typically May, while March often presents the lowest earnings, highlighting opportunities for strategic pricing adjustments during shoulder and low seasons. Explore the typical Airbnb income in Banff across different performance tiers:
- Best-in-class properties (Top 10%) achieve $4,202+ monthly, often utilizing dynamic pricing and superior guest experiences.
- Strong performing properties (Top 25%) earn $3,001 or more, indicating effective management and desirable locations/amenities.
- Typical properties (Median) generate around $2,041 per month, representing the average market performance.
- Entry-level properties (Bottom 25%) see earnings around $1,025, often with potential for optimization.
Average Monthly Airbnb Earnings Trend in Banff
Banff Airbnb Occupancy Rate Trends (2025)
Maximize your bookings by understanding the Banff STR occupancy trends. Seasonal demand shifts significantly influence how often properties are booked. Typically, Septembersees the highest demand (peak season occupancy), while March experiences the lowest (low season). Effective strategies, like adjusting minimum stays or offering promotions, can boost occupancy during slower periods. Here's how different property tiers perform in Banff:
- Best-in-class properties (Top 10%) achieve 79%+ occupancy, indicating high desirability and potentially optimized availability.
- Strong performing properties (Top 25%) maintain 63% or higher occupancy, suggesting good market fit and guest satisfaction.
- Typical properties (Median) have an occupancy rate around 41%.
- Entry-level properties (Bottom 25%) average 21% occupancy, potentially facing higher vacancy.
Average Monthly Occupancy Rate Trend in Banff
Average Daily Rate (ADR) Airbnb Trends in Banff (2025)
Effective short term rental pricing strategy in Banff involves understanding monthly ADR fluctuations. The Average Daily Rate (ADR) for Airbnb in Banff typically peaks in December and dips lowest during April. Leveraging Airbnb dynamic pricing tools or strategies based on this seasonality can significantly boost revenue. Here's a look at the typical nightly rates achieved:
- Best-in-class properties (Top 10%) command rates of $397+ per night, often due to premium features or locations.
- Strong performing properties (Top 25%) achieve nightly rates of $194 or more.
- Typical properties (Median) charge around $128 per night.
- Entry-level properties (Bottom 25%) earn around $108 per night.
Average Daily Rate (ADR) Trend by Month in Banff
Get Live Banff Market Intelligence 👇

Explore Real-time Analytics
Airbnb Seasonality Analysis & Trends in Banff (2025)
Peak Season (May, April, September)
- Revenue averages $3,062 per month
- Occupancy rates average 51.9%
- Daily rates average $176
Shoulder Season
- Revenue averages $2,336 per month
- Occupancy maintains around 44.9%
- Daily rates hold near $182
Low Season (January, February, March)
- Revenue drops to average $1,503 per month
- Occupancy decreases to average 30.5%
- Daily rates adjust to average $181
Seasonality Insights for Banff
- The Airbnb seasonality in Banff shows highly seasonal trends requiring careful strategy. While the sections above show seasonal averages, it's also insightful to look at the extremes:
- During the high season, the absolute peak month showcases Banff's highest earning potential, with monthly revenues capable of climbing to $3,442, occupancy reaching a high of 58.9%, and ADRs peaking at $192.
- Conversely, the slowest single month of the year, typically falling within the low season, marks the market's lowest point. In this month, revenue might dip to $1,288, occupancy could drop to 28.4%, and ADRs may adjust down to $175.
- Understanding both the seasonal averages and these monthly peaks and troughs in revenue, occupancy, and ADR is crucial for maximizing your Airbnb profit potential in Banff.
Seasonal Strategies for Maximizing Profit
- Peak Season: Maximize revenue through premium pricing and potentially longer minimum stays. Ensure high availability.
- Low Season: Offer competitive pricing, special promotions (e.g., extended stay discounts), and flexible cancellation policies. Target off-season travelers like remote workers or budget-conscious guests.
- Shoulder Seasons: Implement dynamic pricing that balances peak and low rates. Target weekend travelers or specific events. Offer slightly more flexible terms than peak season.
- Regularly analyze your own performance against these Banff seasonality benchmarks and adjust your pricing and availability strategy accordingly.
Best Areas for Airbnb Investment in Banff (2025)
Exploring the top neighborhoods for short-term rentals in Banff? This section highlights key areas, outlining why they are attractive for hosts and guests, along with notable local attractions. Consider these locations based on your target guest profile and investment strategy.
| Neighborhood / Area | Why Host Here? (Target Guests & Appeal) | Key Attractions & Landmarks |
|---|---|---|
| Banff Town Centre | The heart of Banff, with vibrant shops, restaurants, and easy access to major attractions. Perfect for tourists looking for convenience and vibrant nightlife. | Banff Avenue, Banff Centre, Cascade Gardens, Bow River, Whyte Museum, Lake Louise |
| Lake Louise | Famous for its stunning turquoise lake and luxury hotels, a prime location for guests seeking breathtaking nature and outdoor activities. | Lake Louise, Lake Agnes, Plain of Six Glaciers, Victoria Glacier, Lake Louise Gondola, Fairmont Chateau Lake Louise |
| Johnson Canyon | A popular spot for hiking and stunning waterfalls, ideal for outdoor enthusiasts who want to explore Banff National Park. | Johnson Canyon, Lower Falls, Upper Falls, Hiking trails, Scenic viewpoints |
| Moraine Lake | Renowned for its stunning views, this area attracts nature lovers and photographers, making it a desirable spot for unique Airbnb stays. | Moraine Lake, Rockpile Trail, Ten Peaks, Scenic photography spots |
| Canmore | Close to Banff, Canmore offers a quaint, less crowded alternative with beautiful mountain views, appealing to all types of travelers. | Grassi Lakes, Canmore Nordic Centre, Downtown Canmore, Bow River, Canmore Mountain Market |
| Tunnel Mountain | Offers stunning views of the surrounding areas, as well as unique accommodations, perfect for visitors looking to be close to nature and hiking trails. | Tunnel Mountain hike, Mount Norquay, Views of the Banff townsite |
| Bow Valley Parkway | A scenic route that showcases beautiful landscapes and wildlife, popular among travelers looking to explore and experience the Canadian wilderness. | Peyto Lake, Bow Valley viewpoint, Close to Banff National Park attractions |
| Kananaskis Country | A fantastic area for outdoor activities like hiking, biking, and skiing, appealing to adventure tourists and nature lovers. | Peter Lougheed Provincial Park, Kananaskis Ski Resort, Scenic viewpoints, Hiking trails |
Understanding Airbnb License Requirements & STR Laws in Banff (2025)
With 15% of listings showing registration in 2025, understanding potential Airbnb license requirements is crucial in Banff. Always verify the latest short term rental regulations and Airbnb license requirements directly with local government authorities for Banff to ensure full compliance before hosting.
(Source: AirROI data, 2025, based on 15% licensed listings)
Top Performing Airbnb Properties in Banff (2025)
Benchmark your potential! Explore examples of top-performing Airbnb properties in Banffbased on Trailing Twelve Month (TTM) revenue. Analyze their characteristics, revenue, occupancy rate, and ADR to understand what drives success in this market.

Entire unique tiny house - Moss
Entire Place • 1 bedroom

Entire unique tiny house - Stag
Entire Place • N/A
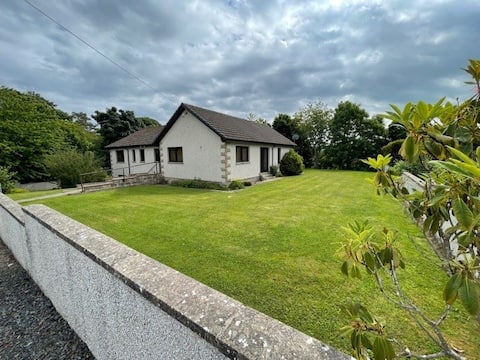
Four Bedroom house in private grounds.
Entire Place • 4 bedrooms
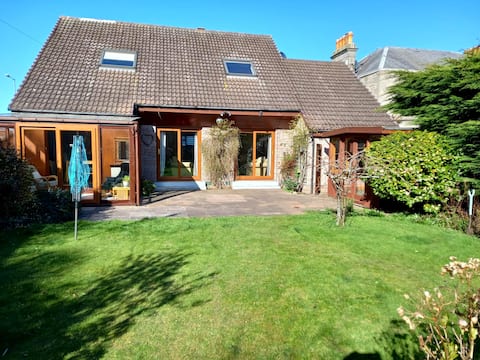
Hillpark House
Entire Place • 4 bedrooms
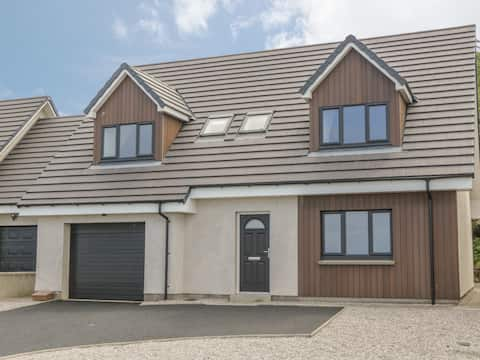
15 Waters Edge
Entire Place • 4 bedrooms
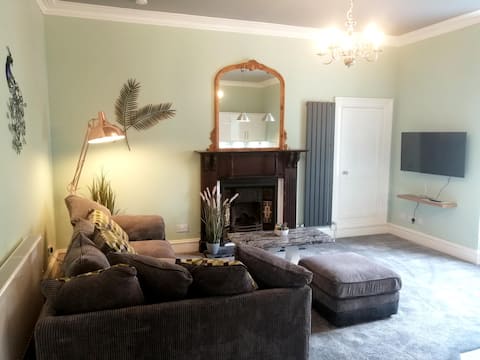
High quality 2 bedroom holiday flat in Banff
Entire Place • 2 bedrooms
Note: Performance varies based on location, size, amenities, seasonality, and management quality. Data reflects the past 12 months.
Top Performing Airbnb Hosts in Banff (2025)
Learn from the best! This table showcases top-performing Airbnb hosts in Banff based on the number of properties managed and estimated total revenue over the past year. Analyze their scale and performance metrics.
| Host Name | Properties | Grossing Revenue | Stay Reviews | Avg Rating |
|---|---|---|---|---|
| Nick | 2 | $77,081 | 341 | 4.96/5.0 |
| Host #23701935 | 3 | $49,575 | 2 | 0.00/5.0 |
| Ellie | 2 | $38,372 | 66 | 4.71/5.0 |
| Fife Lodge | 1 | $35,649 | 16 | 4.75/5.0 |
| Heather | 1 | $34,774 | 39 | 5.00/5.0 |
| Michael | 1 | $32,304 | 163 | 4.93/5.0 |
| Paul | 1 | $30,120 | 155 | 4.97/5.0 |
| Cottages | 2 | $29,390 | 7 | 2.42/5.0 |
| Host #38232168 | 1 | $28,585 | 157 | 4.84/5.0 |
| Catherine | 1 | $28,152 | 191 | 4.99/5.0 |
Analyzing the strategies of top hosts, such as their property selection, pricing, and guest communication, can offer valuable lessons for optimizing your own Airbnb operations in Banff.
Dive Deeper: Advanced Banff STR Market Data (2025)
Ready to unlock more insights? AirROI provides access to advanced metrics and comprehensive Airbnb data for Banff. Explore detailed analytics beyond this report to refine your investment strategy, optimize pricing, and maximize your vacation rental profits.
Explore Advanced MetricsBanff Short-Term Rental Market Composition (2025): Property & Room Types
Room Type Distribution
Property Type Distribution
Market Composition Insights for Banff
- The Banff Airbnb market composition is heavily skewed towards Entire Home/Apt listings, which make up 74.1% of the 27 active rentals. This indicates strong guest preference for privacy and space.
- Looking at the property type distribution in Banff, House properties are the most common (59.3%), reflecting the local real estate landscape.
- Houses represent a significant 59.3% portion, catering likely to families or larger groups.
- The presence of 25.9% Hotel/Boutique listings indicates integration with traditional hospitality.
- Smaller segments like outdoor/unique (combined 3.7%) offer potential for unique stay experiences.
Banff Airbnb Room Capacity Analysis (2025): Bedroom Distribution
Distribution of Listings by Number of Bedrooms
Room Capacity Insights for Banff
- The dominant room capacity in Banff is 2 bedrooms listings, making up 29.6% of the market. This suggests a strong demand for properties suitable for couples or solo travelers.
- Together, 2 bedrooms and 1 bedroom properties represent 51.8% of the active Airbnb listings in Banff, indicating a high concentration in these sizes.
- A significant 40.7% of listings offer 3+ bedrooms, catering to larger groups and families seeking more space in Banff.
Banff Vacation Rental Guest Capacity Trends (2025)
Distribution of Listings by Guest Capacity
Guest Capacity Insights for Banff
- The most common guest capacity trend in Banff vacation rentals is listings accommodating 4 guests (25.9%). This suggests the primary traveler segment is likely small families or groups.
- Properties designed for 4 guests and 8+ guests dominate the Banff STR market, accounting for 44.4% of listings.
- 22.2% of properties accommodate 6+ guests, serving the market segment for larger families or group travel in Banff.
- On average, properties in Banff are equipped to host 3.7 guests.
Banff Airbnb Booking Patterns (2025): Available vs. Booked Days
Available Days Distribution
Booked Days Distribution
Booking Pattern Insights for Banff
- The most common availability pattern in Banff falls within the 271-366 days range, representing 44.4% of listings. This suggests many properties have significant open periods on their calendars.
- Approximately 77.7% of listings show high availability (181+ days open annually), indicating potential for increased bookings or specific owner usage patterns.
- For booked days, the 91-180 days range is most frequent in Banff (29.6%), reflecting common guest stay durations or potential owner blocking patterns.
- A notable 25.9% of properties secure long booking periods (181+ days booked per year), highlighting successful long-term rental strategies or significant owner usage.
Banff Airbnb Minimum Stay Requirements Analysis
Distribution of Listings by Minimum Night Requirement
1 Night
17 listings
63% of total
2 Nights
5 listings
18.5% of total
3 Nights
2 listings
7.4% of total
30+ Nights
3 listings
11.1% of total
Key Insights
- The most prevalent minimum stay requirement in Banff is 1 Night, adopted by 63% of listings. This highlights the market's preference for shorter, flexible bookings.
- A strong majority (81.5%) of the Banff Airbnb data shows acceptance of very short stays (1-2 nights), indicating a dynamic, high-turnover market.
- A significant segment (11.1%) caters to monthly stays (30+ nights) in Banff, pointing to opportunities in the extended-stay market.
Recommendations
- Align with the market by considering a 1 Night minimum stay, as 63% of Banff hosts use this setting.
- Explore offering discounts for stays of 30+ nights to attract the 11.1% of the market seeking extended stays.
- Adjust minimum nights based on seasonality – potentially shorter during low season and longer during peak demand periods in Banff.
Banff Airbnb Cancellation Policy Trends Analysis (2025)
Super Strict 60 Days
2 listings
8.7% of total
Flexible
16 listings
69.6% of total
Strict
5 listings
21.7% of total
Cancellation Policy Insights for Banff
- The prevailing Airbnb cancellation policy trend in Banff is Flexible, used by 69.6% of listings.
- There's a relatively balanced mix between guest-friendly (69.6%) and stricter (21.7%) policies, offering choices for different guest needs.
Recommendations for Hosts
- Consider adopting a Flexible policy to align with the 69.6% market standard in Banff.
- Given the high prevalence of Flexible policies (69.6%), offering this can enhance booking appeal, especially during shoulder seasons.
- Regularly review your cancellation policy against competitors and market demand shifts in Banff.
Banff STR Booking Lead Time Analysis (2025)
Average Booking Lead Time by Month
Booking Lead Time Insights for Banff
- The overall average booking lead time for vacation rentals in Banff is 63 days.
- Guests book furthest in advance for stays during September (average 126 days), likely coinciding with peak travel demand or local events.
- The shortest booking windows occur for stays in November (average 30 days), indicating more last-minute travel plans during this time.
- Seasonally, Summer (91 days avg.) sees the longest lead times, while Winter (58 days avg.) has the shortest, reflecting typical travel planning cycles.
Recommendations for Hosts
- Use the overall average lead time (63 days) as a baseline for your pricing and availability strategy in Banff.
- For September stays, consider implementing length-of-stay discounts or slightly higher rates for bookings made less than 126 days out to capitalize on advance planning.
- Target marketing efforts for the Summer season well in advance (at least 91 days) to capture early planners.
- Monitor your own booking lead times against these Banff averages to identify opportunities for dynamic pricing adjustments.
Popular & Essential Airbnb Amenities in Banff (2025)
Amenity Prevalence
Amenity Insights for Banff
- Essential amenities in Banff that guests expect include: Heating, Smoke alarm, TV, Wifi. Lacking these (any) could significantly impact bookings.
- Popular amenities like Carbon monoxide alarm, Essentials, Hangers are common but not universal. Offering these can provide a competitive edge.
Recommendations for Hosts
- Ensure your listing includes all essential amenities for Banff: Heating, Smoke alarm, TV, Wifi.
- Prioritize adding missing essentials: Wifi.
- Consider adding popular differentiators like Carbon monoxide alarm or Essentials to increase appeal.
- Highlight unique or less common amenities you offer (e.g., hot tub, dedicated workspace, EV charger) in your listing description and photos.
- Regularly check competitor amenities in Banff to stay competitive.
Banff Airbnb Guest Demographics & Profile Analysis (2025)
Guest Profile Summary for Banff
- The typical guest profile for Airbnb in Banff consists of primarily domestic travelers (74%), often arriving from nearby Scotland, typically belonging to the Post-2000s (Gen Z/Alpha) group (50%), primarily speaking English or French.
- Domestic travelers account for 73.8% of guests.
- Key international markets include United Kingdom (73.8%) and United States (13.8%).
- Top languages spoken are English (63%) followed by French (7.4%).
- A significant demographic segment is the Post-2000s (Gen Z/Alpha) group, representing 50% of guests.
Recommendations for Hosts
- Target domestic marketing efforts towards travelers from Scotland and England.
- Tailor amenities and listing descriptions to appeal to the dominant Post-2000s (Gen Z/Alpha) demographic (e.g., highlight fast WiFi, smart home features, local guides).
- Highlight unique local experiences or amenities relevant to the primary guest profile.
- Consider seasonal promotions aligned with peak travel times for key origin markets.
Nearby Short-Term Rental Market Comparison
How does the Banff Airbnb market stack up against its neighbors? Compare key performance metrics like average monthly revenue, ADR, and occupancy rates in surrounding areas to understand the broader regional STR landscape.
| Market | Active Properties | Monthly Revenue | Daily Rate | Avg. Occupancy |
|---|---|---|---|---|
| Bridge of Cally | 16 | $5,839 | $566.24 | 50% |
| Kenmore | 10 | $4,507 | $430.34 | 41% |
| Insh | 14 | $4,473 | $289.96 | 63% |
| Auchtermuchty | 11 | $3,979 | $365.72 | 50% |
| Gleneagles | 10 | $3,964 | $284.15 | 45% |
| Leuchars | 16 | $3,949 | $400.90 | 43% |
| St Andrews | 359 | $3,908 | $373.13 | 50% |
| North Berwick | 94 | $3,893 | $330.02 | 52% |
| Gilmerton | 10 | $3,872 | $440.46 | 35% |
| Mount Melville | 15 | $3,842 | $264.66 | 46% |