Banavie Airbnb Market Analysis 2025: Short Term Rental Data & Vacation Rental Statistics in Scotland, United Kingdom
Is Airbnb profitable in Banavie in 2025? Explore comprehensive Airbnb analytics for Banavie, Scotland, United Kingdom to uncover income potential. This 2025 STR market report for Banavie, based on AirROI data from April 2024 to March 2025, reveals key trends in the niche market of 67 active listings.
Whether you're considering an Airbnb investment in Banavie, optimizing your existing vacation rental, or exploring rental arbitrage opportunities, understanding the Banavie Airbnb data is crucial. Understanding the local regulations is key to maximizing your short term rental income potential. Let's dive into the specifics.
Key Banavie Airbnb Performance Metrics Overview
Monthly Airbnb Revenue Variations & Income Potential in Banavie (2025)
Understanding the monthly revenue variations for Airbnb listings in Banavie is key to maximizing your short term rental income potential. Seasonality significantly impacts earnings. Our analysis, based on data from the past 12 months, shows that the peak revenue month for STRs in Banavie is typically July, while March often presents the lowest earnings, highlighting opportunities for strategic pricing adjustments during shoulder and low seasons. Explore the typical Airbnb income in Banavie across different performance tiers:
- Best-in-class properties (Top 10%) achieve $5,347+ monthly, often utilizing dynamic pricing and superior guest experiences.
- Strong performing properties (Top 25%) earn $3,995 or more, indicating effective management and desirable locations/amenities.
- Typical properties (Median) generate around $2,862 per month, representing the average market performance.
- Entry-level properties (Bottom 25%) see earnings around $1,916, often with potential for optimization.
Average Monthly Airbnb Earnings Trend in Banavie
Banavie Airbnb Occupancy Rate Trends (2025)
Maximize your bookings by understanding the Banavie STR occupancy trends. Seasonal demand shifts significantly influence how often properties are booked. Typically, Julysees the highest demand (peak season occupancy), while March experiences the lowest (low season). Effective strategies, like adjusting minimum stays or offering promotions, can boost occupancy during slower periods. Here's how different property tiers perform in Banavie:
- Best-in-class properties (Top 10%) achieve 85%+ occupancy, indicating high desirability and potentially optimized availability.
- Strong performing properties (Top 25%) maintain 74% or higher occupancy, suggesting good market fit and guest satisfaction.
- Typical properties (Median) have an occupancy rate around 56%.
- Entry-level properties (Bottom 25%) average 40% occupancy, potentially facing higher vacancy.
Average Monthly Occupancy Rate Trend in Banavie
Average Daily Rate (ADR) Airbnb Trends in Banavie (2025)
Effective short term rental pricing strategy in Banavie involves understanding monthly ADR fluctuations. The Average Daily Rate (ADR) for Airbnb in Banavie typically peaks in July and dips lowest during March. Leveraging Airbnb dynamic pricing tools or strategies based on this seasonality can significantly boost revenue. Here's a look at the typical nightly rates achieved:
- Best-in-class properties (Top 10%) command rates of $396+ per night, often due to premium features or locations.
- Strong performing properties (Top 25%) achieve nightly rates of $252 or more.
- Typical properties (Median) charge around $176 per night.
- Entry-level properties (Bottom 25%) earn around $132 per night.
Average Daily Rate (ADR) Trend by Month in Banavie
Get Live Banavie Market Intelligence 👇

Explore Real-time Analytics
Airbnb Seasonality Analysis & Trends in Banavie (2025)
Peak Season (July, August, May)
- Revenue averages $4,938 per month
- Occupancy rates average 76.3%
- Daily rates average $245
Shoulder Season
- Revenue averages $3,066 per month
- Occupancy maintains around 54.6%
- Daily rates hold near $225
Low Season (January, February, March)
- Revenue drops to average $1,678 per month
- Occupancy decreases to average 35.1%
- Daily rates adjust to average $184
Seasonality Insights for Banavie
- The Airbnb seasonality in Banavie shows highly seasonal trends requiring careful strategy. While the sections above show seasonal averages, it's also insightful to look at the extremes:
- During the high season, the absolute peak month showcases Banavie's highest earning potential, with monthly revenues capable of climbing to $5,227, occupancy reaching a high of 79.0%, and ADRs peaking at $249.
- Conversely, the slowest single month of the year, typically falling within the low season, marks the market's lowest point. In this month, revenue might dip to $1,623, occupancy could drop to 31.3%, and ADRs may adjust down to $183.
- Understanding both the seasonal averages and these monthly peaks and troughs in revenue, occupancy, and ADR is crucial for maximizing your Airbnb profit potential in Banavie.
Seasonal Strategies for Maximizing Profit
- Peak Season: Maximize revenue through premium pricing and potentially longer minimum stays. Ensure high availability.
- Low Season: Offer competitive pricing, special promotions (e.g., extended stay discounts), and flexible cancellation policies. Target off-season travelers like remote workers or budget-conscious guests.
- Shoulder Seasons: Implement dynamic pricing that balances peak and low rates. Target weekend travelers or specific events. Offer slightly more flexible terms than peak season.
- Regularly analyze your own performance against these Banavie seasonality benchmarks and adjust your pricing and availability strategy accordingly.
Best Areas for Airbnb Investment in Banavie (2025)
Exploring the top neighborhoods for short-term rentals in Banavie? This section highlights key areas, outlining why they are attractive for hosts and guests, along with notable local attractions. Consider these locations based on your target guest profile and investment strategy.
| Neighborhood / Area | Why Host Here? (Target Guests & Appeal) | Key Attractions & Landmarks |
|---|---|---|
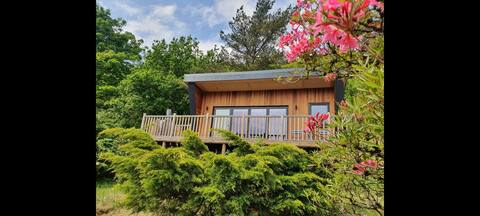
| Fort William | The largest town near Ben Nevis, attracting outdoor enthusiasts and hikers. Perfect for guests looking to explore hiking trails and enjoy stunning Scottish landscapes. | Ben Nevis, Glen Nevis, West Highland Museum, Nevis Range Mountain Resort, lochs and glens of the Scottish Highlands |
| Lochaber | Surrounding area rich in natural beauty with famous lochs and mountains. Ideal for those who enjoy outdoor activities such as fishing, cycling, and boating. | Loch Morar, Glen Nevis, The Jacobite Steam Train, Ben Nevis Distillery, Scenic walking routes |
| Ballachulish | A scenic village close to both Glencoe and the Highlands, offering tourists a picturesque base for exploring outdoor adventures. | Glencoe Village, Pap of Glencoe, Loch Leven, The Glencoe Folk Museum, Hiking routes through Glencoe |
| Corpach | A small settlement near Fort William with easy access to popular hiking and cycling trails, great for tourists wanting a quieter stay. | Neptune's Staircase, Loch Linnhe, West Highland Way, Ben Nevis access paths, Local eateries and pubs |
| Spean Bridge | Appealing to visitors with its direct routes to hiking areas and natural beauty, plus unique local interests. | Commando Monument, Spean Bridge Woollen Mill, Caledonian Canal, Canoeing on Loch Lochy, Nearby hiking trails |
| Inverlochy | This area is favored for its stunning castle and historical sites, appealing to history lovers and scenic retreat seekers. | Inverlochy Castle, Old Inverlochy Castle, Mountain biking routes, Fishing on River Lochy, Beautiful views |
| Onich | Located on the shores of Loch Linnhe, Onich is popular for a peaceful stay with access to various outdoor activities. | Loch Linnhe, Gray Mare's Tail Waterfall, Nearby scenic trails, Outdoor activity centres, Local dining experiences |
| Acharacle | A charming village known for its scenic coastal views and being a gateway to Ardnamurchan, appealing for a more remote getaway. | Ardnamurchan Point Lighthouse, Sanna Bay, Achallader Castle, Outdoor treks and fishing, Local wildlife watching |
Understanding Airbnb License Requirements & STR Laws in Banavie (2025)
With 27% of listings showing registration in 2025, understanding potential Airbnb license requirements is crucial in Banavie. Always verify the latest short term rental regulations and Airbnb license requirements directly with local government authorities for Banavie to ensure full compliance before hosting.
(Source: AirROI data, 2025, based on 27% licensed listings)
Top Performing Airbnb Properties in Banavie (2025)
Benchmark your potential! Explore examples of top-performing Airbnb properties in Banaviebased on Trailing Twelve Month (TTM) revenue. Analyze their characteristics, revenue, occupancy rate, and ADR to understand what drives success in this market.

Beech House
Entire Place • 5 bedrooms
Serendipity Tiny House w/ wood-fired hot tub
Entire Place • 1 bedroom
Serendipity Cottage w/ hot tub (wood-fired)
Entire Place • 3 bedrooms
The Hidden Gem at Archwood Lodge
Entire Place • 2 bedrooms
Fordon Highland Retreat With Stunning Views
Entire Place • 2 bedrooms

Laragain cottage
Entire Place • 2 bedrooms
Note: Performance varies based on location, size, amenities, seasonality, and management quality. Data reflects the past 12 months.
Top Performing Airbnb Hosts in Banavie (2025)
Learn from the best! This table showcases top-performing Airbnb hosts in Banavie based on the number of properties managed and estimated total revenue over the past year. Analyze their scale and performance metrics.
| Host Name | Properties | Grossing Revenue | Stay Reviews | Avg Rating |
|---|---|---|---|---|
| Daniel & Jo | 7 | $203,844 | 96 | 4.45/5.0 |
| Chloe | 2 | $139,257 | 250 | 4.80/5.0 |
| Cottages | 3 | $130,560 | 20 | 4.96/5.0 |
| Claire | 3 | $117,742 | 86 | 4.78/5.0 |
| Emma | 3 | $78,907 | 36 | 4.92/5.0 |
| Carrie | 2 | $72,471 | 475 | 4.96/5.0 |
| West | 3 | $58,967 | 28 | 1.62/5.0 |
| Morag | 2 | $53,763 | 230 | 4.90/5.0 |
| Jodie & TJ | 2 | $50,937 | 360 | 4.84/5.0 |
| Jack | 1 | $50,522 | 488 | 4.93/5.0 |
Analyzing the strategies of top hosts, such as their property selection, pricing, and guest communication, can offer valuable lessons for optimizing your own Airbnb operations in Banavie.
Dive Deeper: Advanced Banavie STR Market Data (2025)
Ready to unlock more insights? AirROI provides access to advanced metrics and comprehensive Airbnb data for Banavie. Explore detailed analytics beyond this report to refine your investment strategy, optimize pricing, and maximize your vacation rental profits.
Explore Advanced MetricsBanavie Short-Term Rental Market Composition (2025): Property & Room Types
Room Type Distribution
Property Type Distribution
Market Composition Insights for Banavie
- The Banavie Airbnb market composition is heavily skewed towards Entire Home/Apt listings, which make up 74.6% of the 67 active rentals. This indicates strong guest preference for privacy and space.
- Looking at the property type distribution in Banavie, House properties are the most common (55.2%), reflecting the local real estate landscape.
- Houses represent a significant 55.2% portion, catering likely to families or larger groups.
- The presence of 13.4% Hotel/Boutique listings indicates integration with traditional hospitality.
- Smaller segments like others, unique stays (combined 6.0%) offer potential for unique stay experiences.
Banavie Airbnb Room Capacity Analysis (2025): Bedroom Distribution
Distribution of Listings by Number of Bedrooms
Room Capacity Insights for Banavie
- The dominant room capacity in Banavie is 1 bedroom listings, making up 38.8% of the market. This suggests a strong demand for properties suitable for couples or solo travelers.
- Together, 1 bedroom and 2 bedrooms properties represent 62.7% of the active Airbnb listings in Banavie, indicating a high concentration in these sizes.
Banavie Vacation Rental Guest Capacity Trends (2025)
Distribution of Listings by Guest Capacity
Guest Capacity Insights for Banavie
- The most common guest capacity trend in Banavie vacation rentals is listings accommodating 4 guests (28.4%). This suggests the primary traveler segment is likely small families or groups.
- Properties designed for 4 guests and 2 guests dominate the Banavie STR market, accounting for 56.8% of listings.
- 25.4% of properties accommodate 6+ guests, serving the market segment for larger families or group travel in Banavie.
- On average, properties in Banavie are equipped to host 3.8 guests.
Banavie Airbnb Booking Patterns (2025): Available vs. Booked Days
Available Days Distribution
Booked Days Distribution
Booking Pattern Insights for Banavie
- The most common availability pattern in Banavie falls within the 181-270 days range, representing 35.8% of listings. This suggests many properties have significant open periods on their calendars.
- Approximately 58.2% of listings show high availability (181+ days open annually), indicating potential for increased bookings or specific owner usage patterns.
- For booked days, the 181-270 days range is most frequent in Banavie (37.3%), reflecting common guest stay durations or potential owner blocking patterns.
- A notable 49.2% of properties secure long booking periods (181+ days booked per year), highlighting successful long-term rental strategies or significant owner usage.
Banavie Airbnb Minimum Stay Requirements Analysis
Distribution of Listings by Minimum Night Requirement
1 Night
25 listings
39.1% of total
2 Nights
17 listings
26.6% of total
3 Nights
13 listings
20.3% of total
4-6 Nights
3 listings
4.7% of total
7-29 Nights
1 listings
1.6% of total
30+ Nights
5 listings
7.8% of total
Key Insights
- The most prevalent minimum stay requirement in Banavie is 1 Night, adopted by 39.1% of listings. This highlights the market's preference for shorter, flexible bookings.
- A strong majority (65.7%) of the Banavie Airbnb data shows acceptance of very short stays (1-2 nights), indicating a dynamic, high-turnover market.
Recommendations
- Align with the market by considering a 1 Night minimum stay, as 39.1% of Banavie hosts use this setting.
- Explore offering discounts for stays of 30+ nights to attract the 7.8% of the market seeking extended stays.
- Adjust minimum nights based on seasonality – potentially shorter during low season and longer during peak demand periods in Banavie.
Banavie Airbnb Cancellation Policy Trends Analysis (2025)
Super Strict 60 Days
4 listings
6.5% of total
Flexible
14 listings
22.6% of total
Moderate
17 listings
27.4% of total
Firm
6 listings
9.7% of total
Strict
21 listings
33.9% of total
Cancellation Policy Insights for Banavie
- The prevailing Airbnb cancellation policy trend in Banavie is Strict, used by 33.9% of listings.
- There's a relatively balanced mix between guest-friendly (50.0%) and stricter (43.6%) policies, offering choices for different guest needs.
Recommendations for Hosts
- Consider adopting a Strict policy to align with the 33.9% market standard in Banavie.
- With 33.9% using Strict terms, this is a viable option in Banavie, particularly for high-value properties or during peak demand periods.
- Regularly review your cancellation policy against competitors and market demand shifts in Banavie.
Banavie STR Booking Lead Time Analysis (2025)
Average Booking Lead Time by Month
Booking Lead Time Insights for Banavie
- The overall average booking lead time for vacation rentals in Banavie is 83 days.
- Guests book furthest in advance for stays during July (average 126 days), likely coinciding with peak travel demand or local events.
- The shortest booking windows occur for stays in March (average 51 days), indicating more last-minute travel plans during this time.
- Seasonally, Summer (119 days avg.) sees the longest lead times, while Winter (71 days avg.) has the shortest, reflecting typical travel planning cycles.
Recommendations for Hosts
- Use the overall average lead time (83 days) as a baseline for your pricing and availability strategy in Banavie.
- For July stays, consider implementing length-of-stay discounts or slightly higher rates for bookings made less than 126 days out to capitalize on advance planning.
- Target marketing efforts for the Summer season well in advance (at least 119 days) to capture early planners.
- Monitor your own booking lead times against these Banavie averages to identify opportunities for dynamic pricing adjustments.
Popular & Essential Airbnb Amenities in Banavie (2025)
Amenity Prevalence
Amenity Insights for Banavie
- Essential amenities in Banavie that guests expect include: Wifi, Smoke alarm, Heating. Lacking these (any) could significantly impact bookings.
- Popular amenities like Free parking on premises, TV, Essentials are common but not universal. Offering these can provide a competitive edge.
Recommendations for Hosts
- Ensure your listing includes all essential amenities for Banavie: Wifi, Smoke alarm, Heating.
- Prioritize adding missing essentials: Wifi, Smoke alarm, Heating.
- Consider adding popular differentiators like Free parking on premises or TV to increase appeal.
- Highlight unique or less common amenities you offer (e.g., hot tub, dedicated workspace, EV charger) in your listing description and photos.
- Regularly check competitor amenities in Banavie to stay competitive.
Banavie Airbnb Guest Demographics & Profile Analysis (2025)
Guest Profile Summary for Banavie
- The typical guest profile for Airbnb in Banavie consists of a mix of domestic (40%) and international guests, with top international origins including United States, typically belonging to the Post-2000s (Gen Z/Alpha) group (50%), primarily speaking English or German.
- Domestic travelers account for 40.2% of guests.
- Key international markets include United Kingdom (40.2%) and United States (18.1%).
- Top languages spoken are English (57.7%) followed by German (9.1%).
- A significant demographic segment is the Post-2000s (Gen Z/Alpha) group, representing 50% of guests.
Recommendations for Hosts
- Balance marketing efforts between domestic and international channels based on the guest mix.
- Tailor amenities and listing descriptions to appeal to the dominant Post-2000s (Gen Z/Alpha) demographic (e.g., highlight fast WiFi, smart home features, local guides).
- Highlight unique local experiences or amenities relevant to the primary guest profile.
- Consider seasonal promotions aligned with peak travel times for key origin markets.
Nearby Short-Term Rental Market Comparison
How does the Banavie Airbnb market stack up against its neighbors? Compare key performance metrics like average monthly revenue, ADR, and occupancy rates in surrounding areas to understand the broader regional STR landscape.
| Market | Active Properties | Monthly Revenue | Daily Rate | Avg. Occupancy |
|---|---|---|---|---|
| Galston | 11 | $7,951 | $676.77 | 46% |
| Fearnan | 19 | $6,440 | $421.92 | 53% |
| Kirkhill | 10 | $5,719 | $700.26 | 44% |
| Glenachulish | 33 | $5,609 | $424.51 | 46% |
| North Kessock | 10 | $5,421 | $380.62 | 58% |
| Carbost | 26 | $5,209 | $324.31 | 62% |
| Foyers | 14 | $5,076 | $274.52 | 64% |
| Arrochar | 33 | $5,045 | $339.11 | 56% |
| Whitebridge | 10 | $4,907 | $417.35 | 42% |
| Port Failthe | 14 | $4,832 | $301.12 | 57% |