Arden Airbnb Market Analysis 2025: Short Term Rental Data & Vacation Rental Statistics in Scotland, United Kingdom
Is Airbnb profitable in Arden in 2025? Explore comprehensive Airbnb analytics for Arden, Scotland, United Kingdom to uncover income potential. This 2025 STR market report for Arden, based on AirROI data from April 2024 to March 2025, reveals key trends in the niche market of 22 active listings.
Whether you're considering an Airbnb investment in Arden, optimizing your existing vacation rental, or exploring rental arbitrage opportunities, understanding the Arden Airbnb data is crucial. Understanding the local regulations is key to maximizing your short term rental income potential. Let's dive into the specifics.
Key Arden Airbnb Performance Metrics Overview
Monthly Airbnb Revenue Variations & Income Potential in Arden (2025)
Understanding the monthly revenue variations for Airbnb listings in Arden is key to maximizing your short term rental income potential. Seasonality significantly impacts earnings. Our analysis, based on data from the past 12 months, shows that the peak revenue month for STRs in Arden is typically August, while March often presents the lowest earnings, highlighting opportunities for strategic pricing adjustments during shoulder and low seasons. Explore the typical Airbnb income in Arden across different performance tiers:
- Best-in-class properties (Top 10%) achieve $6,316+ monthly, often utilizing dynamic pricing and superior guest experiences.
- Strong performing properties (Top 25%) earn $4,806 or more, indicating effective management and desirable locations/amenities.
- Typical properties (Median) generate around $2,983 per month, representing the average market performance.
- Entry-level properties (Bottom 25%) see earnings around $1,242, often with potential for optimization.
Average Monthly Airbnb Earnings Trend in Arden
Arden Airbnb Occupancy Rate Trends (2025)
Maximize your bookings by understanding the Arden STR occupancy trends. Seasonal demand shifts significantly influence how often properties are booked. Typically, Augustsees the highest demand (peak season occupancy), while March experiences the lowest (low season). Effective strategies, like adjusting minimum stays or offering promotions, can boost occupancy during slower periods. Here's how different property tiers perform in Arden:
- Best-in-class properties (Top 10%) achieve 66%+ occupancy, indicating high desirability and potentially optimized availability.
- Strong performing properties (Top 25%) maintain 51% or higher occupancy, suggesting good market fit and guest satisfaction.
- Typical properties (Median) have an occupancy rate around 32%.
- Entry-level properties (Bottom 25%) average 17% occupancy, potentially facing higher vacancy.
Average Monthly Occupancy Rate Trend in Arden
Average Daily Rate (ADR) Airbnb Trends in Arden (2025)
Effective short term rental pricing strategy in Arden involves understanding monthly ADR fluctuations. The Average Daily Rate (ADR) for Airbnb in Arden typically peaks in August and dips lowest during February. Leveraging Airbnb dynamic pricing tools or strategies based on this seasonality can significantly boost revenue. Here's a look at the typical nightly rates achieved:
- Best-in-class properties (Top 10%) command rates of $499+ per night, often due to premium features or locations.
- Strong performing properties (Top 25%) achieve nightly rates of $351 or more.
- Typical properties (Median) charge around $259 per night.
- Entry-level properties (Bottom 25%) earn around $203 per night.
Average Daily Rate (ADR) Trend by Month in Arden
Get Live Arden Market Intelligence 👇

Explore Real-time Analytics
Airbnb Seasonality Analysis & Trends in Arden (2025)
Peak Season (August, July, June)
- Revenue averages $5,273 per month
- Occupancy rates average 52.9%
- Daily rates average $318
Shoulder Season
- Revenue averages $3,118 per month
- Occupancy maintains around 34.5%
- Daily rates hold near $306
Low Season (February, March, November)
- Revenue drops to average $1,523 per month
- Occupancy decreases to average 21.4%
- Daily rates adjust to average $299
Seasonality Insights for Arden
- The Airbnb seasonality in Arden shows highly seasonal trends requiring careful strategy. While the sections above show seasonal averages, it's also insightful to look at the extremes:
- During the high season, the absolute peak month showcases Arden's highest earning potential, with monthly revenues capable of climbing to $5,399, occupancy reaching a high of 58.5%, and ADRs peaking at $323.
- Conversely, the slowest single month of the year, typically falling within the low season, marks the market's lowest point. In this month, revenue might dip to $1,286, occupancy could drop to 17.4%, and ADRs may adjust down to $289.
- Understanding both the seasonal averages and these monthly peaks and troughs in revenue, occupancy, and ADR is crucial for maximizing your Airbnb profit potential in Arden.
Seasonal Strategies for Maximizing Profit
- Peak Season: Maximize revenue through premium pricing and potentially longer minimum stays. Ensure high availability.
- Low Season: Offer competitive pricing, special promotions (e.g., extended stay discounts), and flexible cancellation policies. Target off-season travelers like remote workers or budget-conscious guests.
- Shoulder Seasons: Implement dynamic pricing that balances peak and low rates. Target weekend travelers or specific events. Offer slightly more flexible terms than peak season.
- Regularly analyze your own performance against these Arden seasonality benchmarks and adjust your pricing and availability strategy accordingly.
Best Areas for Airbnb Investment in Arden (2025)
Exploring the top neighborhoods for short-term rentals in Arden? This section highlights key areas, outlining why they are attractive for hosts and guests, along with notable local attractions. Consider these locations based on your target guest profile and investment strategy.
| Neighborhood / Area | Why Host Here? (Target Guests & Appeal) | Key Attractions & Landmarks |
|---|---|---|
| Banchory | Charming town known for its picturesque surroundings and proximity to Royal Deeside. Ideal for visitors looking for scenic hikes and access to the Cairngorms National Park. | Crathes Castle, Scolty Hill, Gairnshiel Lodge, Deeside Way, Banchory Golf Club |
| Stonehaven | Historic coastal town famous for its harbour and the impressive Dunnottar Castle. Attractive for tourists interested in history, culture, and beautiful seaside views. | Dunnottar Castle, Stonehaven Harbour, Tolbooth Museum, Connect with Aberdeen Coastal Trail, Stonehaven Beach |
| Aberdeen City Centre | The urban heart of Aberdeen, offering a mix of vibrant nightlife, business opportunities, and cultural sites, appealing to both tourists and business travelers. | Aberdeen Maritime Museum, Union Square shopping, His Majesty's Theatre, The Kirk of St Nicholas, Marischal College |
| Cairngorms National Park | A stunning national park that attracts outdoor enthusiasts for skiing, hiking, and wildlife spotting, making it a great investment area for adventurous travelers. | Loch Morlich, Cairngorm Mountain, Highland Wildlife Park, Rothiemurchus Estate, Aviemore |
| Inverurie | A growing town with a charming mix of local culture and history, making it a suitable spot for visitors looking to explore Aberdeenshire. | Inverurie Town Hall, Kintore Golf Club, Bennachie, Inverurie Market Place, Bourtie |
| Westhill | A rapidly developing area with easy access to Aberdeen, ideal for business travelers and families looking for a suburban atmosphere. | Westhill Shopping Centre, Hazlehead Park, Aberdeen Gateway, Kingswells, Woodland Walks |
| Fraserburgh | A historic fishing town with stunning coastal scenery, popular among tourists looking for authentic Scots experiences by the sea. | Fraserburgh Beach, Museum of Scottish Lighthouses, Kinnaird Head Castle, Fraserburgh Heritage Centre, Rattray Head |
| Ellon | A picturesque town located near the River Ythan, providing a blend of history and modern amenities, attracting families and outdoor enthusiasts. | Ellon Castle, Ythan walking trails, Ellon Golf Club, The Meadows, Newburgh Beach |
Understanding Airbnb License Requirements & STR Laws in Arden (2025)
With 23% of listings showing registration in 2025, understanding potential Airbnb license requirements is crucial in Arden. Always verify the latest short term rental regulations and Airbnb license requirements directly with local government authorities for Arden to ensure full compliance before hosting.
(Source: AirROI data, 2025, based on 23% licensed listings)
Top Performing Airbnb Properties in Arden (2025)
Benchmark your potential! Explore examples of top-performing Airbnb properties in Ardenbased on Trailing Twelve Month (TTM) revenue. Analyze their characteristics, revenue, occupancy rate, and ADR to understand what drives success in this market.
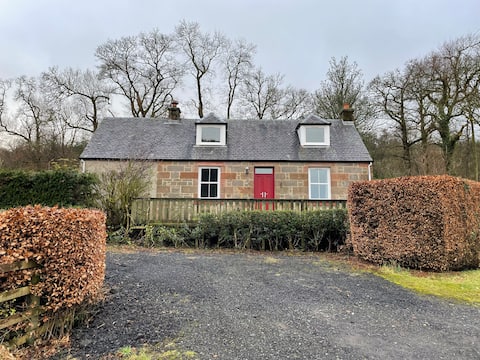
Foresters Cottage
Entire Place • 4 bedrooms
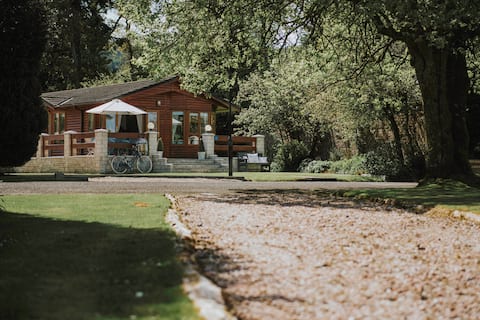
Walled Garden Lodges, Loch Lomond - Willow Lodge
Entire Place • 3 bedrooms
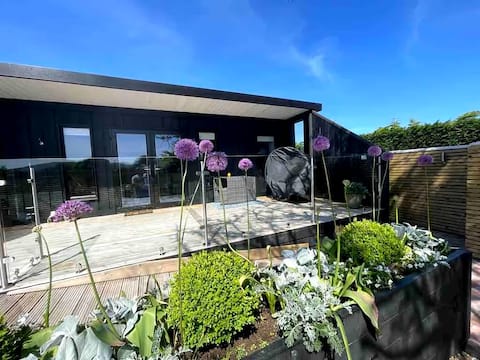
Mackie lodge
Entire Place • 1 bedroom
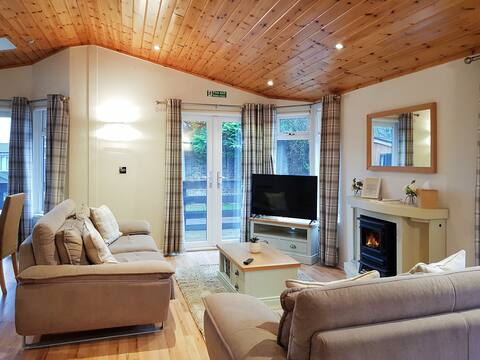
Kingfisher Lodge - UK46046
Entire Place • 2 bedrooms

Charming stone Bothy at Loch Lomond
Entire Place • 1 bedroom

The Walled Garden Lodges - Rowan Lodge
Entire Place • 3 bedrooms
Note: Performance varies based on location, size, amenities, seasonality, and management quality. Data reflects the past 12 months.
Top Performing Airbnb Hosts in Arden (2025)
Learn from the best! This table showcases top-performing Airbnb hosts in Arden based on the number of properties managed and estimated total revenue over the past year. Analyze their scale and performance metrics.
| Host Name | Properties | Grossing Revenue | Stay Reviews | Avg Rating |
|---|---|---|---|---|
| Lynsey | 2 | $104,684 | 59 | 4.88/5.0 |
| Cottages | 2 | $77,788 | 20 | 4.64/5.0 |
| Millie | 1 | $71,549 | 31 | 4.97/5.0 |
| Host #83667169 | 6 | $55,848 | 5 | 0.00/5.0 |
| Fiona | 1 | $53,958 | 94 | 5.00/5.0 |
| Fiona | 1 | $50,275 | 147 | 4.95/5.0 |
| Karen | 2 | $44,608 | 6 | 4.83/5.0 |
| Karen | 1 | $39,074 | 27 | 4.70/5.0 |
| Laura | 1 | $35,359 | 158 | 4.94/5.0 |
| Diane | 3 | $33,507 | 611 | 4.90/5.0 |
Analyzing the strategies of top hosts, such as their property selection, pricing, and guest communication, can offer valuable lessons for optimizing your own Airbnb operations in Arden.
Dive Deeper: Advanced Arden STR Market Data (2025)
Ready to unlock more insights? AirROI provides access to advanced metrics and comprehensive Airbnb data for Arden. Explore detailed analytics beyond this report to refine your investment strategy, optimize pricing, and maximize your vacation rental profits.
Explore Advanced MetricsArden Short-Term Rental Market Composition (2025): Property & Room Types
Room Type Distribution
Property Type Distribution
Market Composition Insights for Arden
- The Arden Airbnb market composition is heavily skewed towards Entire Home/Apt listings, which make up 90.9% of the 22 active rentals. This indicates strong guest preference for privacy and space.
- Looking at the property type distribution in Arden, House properties are the most common (68.2%), reflecting the local real estate landscape.
- Houses represent a significant 68.2% portion, catering likely to families or larger groups.
- Smaller segments like others, apartment/condo, hotel/boutique (combined 13.5%) offer potential for unique stay experiences.
Arden Airbnb Room Capacity Analysis (2025): Bedroom Distribution
Distribution of Listings by Number of Bedrooms
Room Capacity Insights for Arden
- The dominant room capacity in Arden is 1 bedroom listings, making up 45.5% of the market. This suggests a strong demand for properties suitable for couples or solo travelers.
- Together, 1 bedroom and 3 bedrooms properties represent 68.2% of the active Airbnb listings in Arden, indicating a high concentration in these sizes.
- A significant 31.8% of listings offer 3+ bedrooms, catering to larger groups and families seeking more space in Arden.
Arden Vacation Rental Guest Capacity Trends (2025)
Distribution of Listings by Guest Capacity
Guest Capacity Insights for Arden
- The most common guest capacity trend in Arden vacation rentals is listings accommodating 2 guests (40.9%). This suggests the primary traveler segment is likely couples or solo travelers.
- Properties designed for 2 guests and 6 guests dominate the Arden STR market, accounting for 77.3% of listings.
- A significant 40.9% of listings cater specifically to 1-2 guests, highlighting strong demand from couples and solo travelers in Arden.
- 40.9% of properties accommodate 6+ guests, serving the market segment for larger families or group travel in Arden.
- On average, properties in Arden are equipped to host 3.9 guests.
Arden Airbnb Booking Patterns (2025): Available vs. Booked Days
Available Days Distribution
Booked Days Distribution
Booking Pattern Insights for Arden
- The most common availability pattern in Arden falls within the 271-366 days range, representing 50% of listings. This suggests many properties have significant open periods on their calendars.
- Approximately 81.8% of listings show high availability (181+ days open annually), indicating potential for increased bookings or specific owner usage patterns.
- For booked days, the 91-180 days range is most frequent in Arden (31.8%), reflecting common guest stay durations or potential owner blocking patterns.
- A notable 18.1% of properties secure long booking periods (181+ days booked per year), highlighting successful long-term rental strategies or significant owner usage.
Arden Airbnb Minimum Stay Requirements Analysis
Distribution of Listings by Minimum Night Requirement
1 Night
8 listings
38.1% of total
2 Nights
5 listings
23.8% of total
3 Nights
1 listings
4.8% of total
30+ Nights
7 listings
33.3% of total
Key Insights
- The most prevalent minimum stay requirement in Arden is 1 Night, adopted by 38.1% of listings. This highlights the market's preference for shorter, flexible bookings.
- A strong majority (61.9%) of the Arden Airbnb data shows acceptance of very short stays (1-2 nights), indicating a dynamic, high-turnover market.
- A significant segment (33.3%) caters to monthly stays (30+ nights) in Arden, pointing to opportunities in the extended-stay market.
Recommendations
- Align with the market by considering a 1 Night minimum stay, as 38.1% of Arden hosts use this setting.
- Explore offering discounts for stays of 30+ nights to attract the 33.3% of the market seeking extended stays.
- Adjust minimum nights based on seasonality – potentially shorter during low season and longer during peak demand periods in Arden.
Arden Airbnb Cancellation Policy Trends Analysis (2025)
Super Strict 60 Days
2 listings
12.5% of total
Flexible
3 listings
18.8% of total
Moderate
3 listings
18.8% of total
Firm
3 listings
18.8% of total
Strict
5 listings
31.3% of total
Cancellation Policy Insights for Arden
- The prevailing Airbnb cancellation policy trend in Arden is Strict, used by 31.3% of listings.
- A majority (50.1%) of hosts in Arden utilize Firm or Strict policies, indicating a market where hosts prioritize booking security.
Recommendations for Hosts
- Consider adopting a Strict policy to align with the 31.3% market standard in Arden.
- With 31.3% using Strict terms, this is a viable option in Arden, particularly for high-value properties or during peak demand periods.
- Regularly review your cancellation policy against competitors and market demand shifts in Arden.
Arden STR Booking Lead Time Analysis (2025)
Average Booking Lead Time by Month
Booking Lead Time Insights for Arden
- The overall average booking lead time for vacation rentals in Arden is 64 days.
- Guests book furthest in advance for stays during June (average 111 days), likely coinciding with peak travel demand or local events.
- The shortest booking windows occur for stays in March (average 45 days), indicating more last-minute travel plans during this time.
- Seasonally, Summer (94 days avg.) sees the longest lead times, while Winter (58 days avg.) has the shortest, reflecting typical travel planning cycles.
Recommendations for Hosts
- Use the overall average lead time (64 days) as a baseline for your pricing and availability strategy in Arden.
- For June stays, consider implementing length-of-stay discounts or slightly higher rates for bookings made less than 111 days out to capitalize on advance planning.
- Target marketing efforts for the Summer season well in advance (at least 94 days) to capture early planners.
- Monitor your own booking lead times against these Arden averages to identify opportunities for dynamic pricing adjustments.
Popular & Essential Airbnb Amenities in Arden (2025)
Amenity Prevalence
Amenity Insights for Arden
- Essential amenities in Arden that guests expect include: TV, Smoke alarm, Wifi, Heating. Lacking these (any) could significantly impact bookings.
- Popular amenities like Kitchen, Essentials, Free parking on premises are common but not universal. Offering these can provide a competitive edge.
Recommendations for Hosts
- Ensure your listing includes all essential amenities for Arden: TV, Smoke alarm, Wifi, Heating.
- Prioritize adding missing essentials: Heating.
- Consider adding popular differentiators like Kitchen or Essentials to increase appeal.
- Highlight unique or less common amenities you offer (e.g., hot tub, dedicated workspace, EV charger) in your listing description and photos.
- Regularly check competitor amenities in Arden to stay competitive.
Arden Airbnb Guest Demographics & Profile Analysis (2025)
Guest Profile Summary for Arden
- The typical guest profile for Airbnb in Arden consists of a mix of domestic (63%) and international guests, often arriving from nearby England, typically belonging to the Post-2000s (Gen Z/Alpha) group (50%), primarily speaking English or French.
- Domestic travelers account for 63.0% of guests.
- Key international markets include United Kingdom (63%) and United States (16%).
- Top languages spoken are English (68.6%) followed by French (6.6%).
- A significant demographic segment is the Post-2000s (Gen Z/Alpha) group, representing 50% of guests.
Recommendations for Hosts
- Target domestic marketing efforts towards travelers from England and London.
- Tailor amenities and listing descriptions to appeal to the dominant Post-2000s (Gen Z/Alpha) demographic (e.g., highlight fast WiFi, smart home features, local guides).
- Highlight unique local experiences or amenities relevant to the primary guest profile.
- Consider seasonal promotions aligned with peak travel times for key origin markets.
Nearby Short-Term Rental Market Comparison
How does the Arden Airbnb market stack up against its neighbors? Compare key performance metrics like average monthly revenue, ADR, and occupancy rates in surrounding areas to understand the broader regional STR landscape.
| Market | Active Properties | Monthly Revenue | Daily Rate | Avg. Occupancy |
|---|---|---|---|---|
| Galston | 11 | $7,951 | $676.77 | 46% |
| Fearnan | 19 | $6,440 | $421.92 | 53% |
| Gorebridge | 12 | $6,209 | $493.62 | 54% |
| Bridge of Cally | 16 | $5,839 | $566.24 | 50% |
| Kirkhill | 10 | $5,719 | $700.26 | 44% |
| Glenachulish | 33 | $5,609 | $424.51 | 46% |
| North Kessock | 10 | $5,421 | $380.62 | 58% |
| Foyers | 14 | $5,076 | $274.52 | 64% |
| Arrochar | 33 | $5,045 | $339.11 | 56% |
| Whitebridge | 10 | $4,907 | $417.35 | 42% |