Ardbeg Airbnb Market Analysis 2025: Short Term Rental Data & Vacation Rental Statistics in Scotland, United Kingdom
Is Airbnb profitable in Ardbeg in 2025? Explore comprehensive Airbnb analytics for Ardbeg, Scotland, United Kingdom to uncover income potential. This 2025 STR market report for Ardbeg, based on AirROI data from April 2024 to March 2025, reveals key trends in the niche market of 19 active listings.
Whether you're considering an Airbnb investment in Ardbeg, optimizing your existing vacation rental, or exploring rental arbitrage opportunities, understanding the Ardbeg Airbnb data is crucial. Navigating the high regulation landscape is key to maximizing your short term rental income potential. Let's dive into the specifics.
Key Ardbeg Airbnb Performance Metrics Overview
Monthly Airbnb Revenue Variations & Income Potential in Ardbeg (2025)
Understanding the monthly revenue variations for Airbnb listings in Ardbeg is key to maximizing your short term rental income potential. Seasonality significantly impacts earnings. Our analysis, based on data from the past 12 months, shows that the peak revenue month for STRs in Ardbeg is typically August, while March often presents the lowest earnings, highlighting opportunities for strategic pricing adjustments during shoulder and low seasons. Explore the typical Airbnb income in Ardbeg across different performance tiers:
- Best-in-class properties (Top 10%) achieve $2,750+ monthly, often utilizing dynamic pricing and superior guest experiences.
- Strong performing properties (Top 25%) earn $2,199 or more, indicating effective management and desirable locations/amenities.
- Typical properties (Median) generate around $1,537 per month, representing the average market performance.
- Entry-level properties (Bottom 25%) see earnings around $845, often with potential for optimization.
Average Monthly Airbnb Earnings Trend in Ardbeg
Ardbeg Airbnb Occupancy Rate Trends (2025)
Maximize your bookings by understanding the Ardbeg STR occupancy trends. Seasonal demand shifts significantly influence how often properties are booked. Typically, Augustsees the highest demand (peak season occupancy), while March experiences the lowest (low season). Effective strategies, like adjusting minimum stays or offering promotions, can boost occupancy during slower periods. Here's how different property tiers perform in Ardbeg:
- Best-in-class properties (Top 10%) achieve 61%+ occupancy, indicating high desirability and potentially optimized availability.
- Strong performing properties (Top 25%) maintain 51% or higher occupancy, suggesting good market fit and guest satisfaction.
- Typical properties (Median) have an occupancy rate around 35%.
- Entry-level properties (Bottom 25%) average 21% occupancy, potentially facing higher vacancy.
Average Monthly Occupancy Rate Trend in Ardbeg
Average Daily Rate (ADR) Airbnb Trends in Ardbeg (2025)
Effective short term rental pricing strategy in Ardbeg involves understanding monthly ADR fluctuations. The Average Daily Rate (ADR) for Airbnb in Ardbeg typically peaks in July and dips lowest during February. Leveraging Airbnb dynamic pricing tools or strategies based on this seasonality can significantly boost revenue. Here's a look at the typical nightly rates achieved:
- Best-in-class properties (Top 10%) command rates of $239+ per night, often due to premium features or locations.
- Strong performing properties (Top 25%) achieve nightly rates of $152 or more.
- Typical properties (Median) charge around $132 per night.
- Entry-level properties (Bottom 25%) earn around $118 per night.
Average Daily Rate (ADR) Trend by Month in Ardbeg
Get Live Ardbeg Market Intelligence 👇

Explore Real-time Analytics
Airbnb Seasonality Analysis & Trends in Ardbeg (2025)
Peak Season (August, July, June)
- Revenue averages $2,567 per month
- Occupancy rates average 55.7%
- Daily rates average $209
Shoulder Season
- Revenue averages $1,485 per month
- Occupancy maintains around 32.5%
- Daily rates hold near $185
Low Season (February, March, December)
- Revenue drops to average $936 per month
- Occupancy decreases to average 25.7%
- Daily rates adjust to average $141
Seasonality Insights for Ardbeg
- The Airbnb seasonality in Ardbeg shows highly seasonal trends requiring careful strategy. While the sections above show seasonal averages, it's also insightful to look at the extremes:
- During the high season, the absolute peak month showcases Ardbeg's highest earning potential, with monthly revenues capable of climbing to $2,731, occupancy reaching a high of 61.9%, and ADRs peaking at $210.
- Conversely, the slowest single month of the year, typically falling within the low season, marks the market's lowest point. In this month, revenue might dip to $887, occupancy could drop to 23.2%, and ADRs may adjust down to $140.
- Understanding both the seasonal averages and these monthly peaks and troughs in revenue, occupancy, and ADR is crucial for maximizing your Airbnb profit potential in Ardbeg.
Seasonal Strategies for Maximizing Profit
- Peak Season: Maximize revenue through premium pricing and potentially longer minimum stays. Ensure high availability.
- Low Season: Offer competitive pricing, special promotions (e.g., extended stay discounts), and flexible cancellation policies. Target off-season travelers like remote workers or budget-conscious guests.
- Shoulder Seasons: Implement dynamic pricing that balances peak and low rates. Target weekend travelers or specific events. Offer slightly more flexible terms than peak season.
- Regularly analyze your own performance against these Ardbeg seasonality benchmarks and adjust your pricing and availability strategy accordingly.
Best Areas for Airbnb Investment in Ardbeg (2025)
Exploring the top neighborhoods for short-term rentals in Ardbeg? This section highlights key areas, outlining why they are attractive for hosts and guests, along with notable local attractions. Consider these locations based on your target guest profile and investment strategy.
| Neighborhood / Area | Why Host Here? (Target Guests & Appeal) | Key Attractions & Landmarks |
|---|---|---|
| Islay Distilleries | Famous for its whisky, Islay attracts tourists interested in distillery tours and tastings. A prime location for guests seeking a unique experience near renowned distilleries. | Laphroaig Distillery, Lagavulin Distillery, Ardbeg Distillery, Bruichladdich Distillery, Kilchoman Distillery |
| Port Ellen | A charming village with beautiful beaches and a bustling port, Port Ellen is popular among visitors for its scenic views and quick access to Islay's top attractions. | Port Ellen Harbour, Sandy Beaches, Islay Sea Adventures, Local Restaurants, Kildalton Cross |
| Laphroaig Beach | Perfect for nature lovers, this area offers stunning landscapes and access to the beach, ideal for families and couples looking to relax and enjoy the outdoors. | Laphroaig Beach, Coastal Walks, Wildlife Watching, Photography Spots, Bonfire Evenings |
| Ballygrant | A small village known for its peaceful environment and proximity to walking trails, perfect for outdoorsy guests seeking tranquility and nature. | Ballygrant Inn, Local Hiking Trails, Islay's Natural Beauty, Photography Locations, Historic Sites |
| Ardbeg | Home to the famous Ardbeg Distillery, this area appeals to whisky enthusiasts and those seeking a unique cultural experience in the heart of Islay. | Ardbeg Distillery, Ardbeg Observatory, Scenic Coastal Paths, Ardbeg Beach, Local Art Galleries |
| Kilchoman | A quieter area known for its rural charm and scenic views. Ideal for guests looking for a retreat away from busy tourist spots. | Kilchoman Distillery, Beautiful Countryside, Kilchoman Beach, Walking Trails, Local Farms |
| Port Charlotte | This picturesque village features charming cottages and a lovely waterfront, attracting tourists who appreciate quaint settings and historic buildings. | Port Charlotte Museum, Scenic Coastline, Charming Cafés, Local Shops, Historic Distilleries |
| Bowmore | The capital of Islay, Bowmore offers a blend of culture, history, and vibrant community life, making it a popular base for exploring the island. | Bowmore Distillery, Bowmore Round Church, Local Pubs, Craft Shops, Bowmore Harbour |
Understanding Airbnb License Requirements & STR Laws in Ardbeg (2025)
Yes, Ardbeg, Scotland, United Kingdom enforces high STR regulations. Obtaining a license and ensuring compliance is almost certainly required according to current 2025 STR laws. Always verify the latest short term rental regulations and Airbnb license requirements directly with local government authorities for Ardbeg to ensure full compliance before hosting.
(Source: AirROI data, 2025, based on 58% licensed listings)
Top Performing Airbnb Properties in Ardbeg (2025)
Benchmark your potential! Explore examples of top-performing Airbnb properties in Ardbegbased on Trailing Twelve Month (TTM) revenue. Analyze their characteristics, revenue, occupancy rate, and ADR to understand what drives success in this market.

The Guest Wing 4 BD cottage by Sea
Entire Place • 4 bedrooms

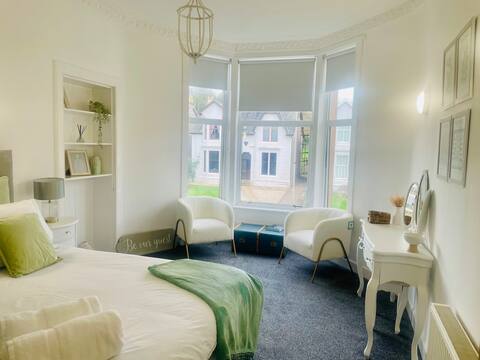
Scalpsie Bay Apartment sleeps 3 with sea views.
Entire Place • 1 bedroom
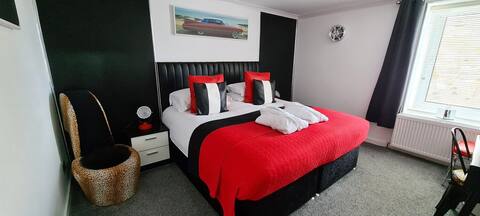
Cadillac Kustomz Hotel Rm.51
Private Room • 1 bedroom
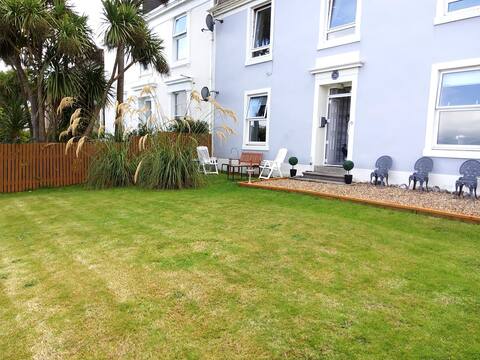
26 Ardbeg Road
Entire Place • 3 bedrooms
Lovely wee Scottish Island Bolthole near beach!
Entire Place • 1 bedroom

Lavender Cottage sleeps 2, private garden/entrance
Entire Place • 1 bedroom
Note: Performance varies based on location, size, amenities, seasonality, and management quality. Data reflects the past 12 months.
Top Performing Airbnb Hosts in Ardbeg (2025)
Learn from the best! This table showcases top-performing Airbnb hosts in Ardbeg based on the number of properties managed and estimated total revenue over the past year. Analyze their scale and performance metrics.
| Host Name | Properties | Grossing Revenue | Stay Reviews | Avg Rating |
|---|---|---|---|---|
| Lynn | 6 | $85,095 | 67 | 4.78/5.0 |
| Rima M | 5 | $59,401 | 4 | 1.00/5.0 |
| Patrica | 3 | $48,085 | 149 | 4.77/5.0 |
| Carolynn | 1 | $27,893 | 17 | 5.00/5.0 |
| Kate | 1 | $18,834 | 28 | 4.89/5.0 |
| Anthony | 1 | $14,821 | 26 | 4.85/5.0 |
| Jane | 1 | $11,651 | 26 | 4.96/5.0 |
| Ulrike | 1 | $6,395 | 5 | 4.80/5.0 |
Analyzing the strategies of top hosts, such as their property selection, pricing, and guest communication, can offer valuable lessons for optimizing your own Airbnb operations in Ardbeg.
Dive Deeper: Advanced Ardbeg STR Market Data (2025)
Ready to unlock more insights? AirROI provides access to advanced metrics and comprehensive Airbnb data for Ardbeg. Explore detailed analytics beyond this report to refine your investment strategy, optimize pricing, and maximize your vacation rental profits.
Explore Advanced MetricsArdbeg Short-Term Rental Market Composition (2025): Property & Room Types
Room Type Distribution
Property Type Distribution
Market Composition Insights for Ardbeg
- The Ardbeg Airbnb market composition is heavily skewed towards Entire Home/Apt listings, which make up 73.7% of the 19 active rentals. This indicates strong guest preference for privacy and space.
- Looking at the property type distribution in Ardbeg, Apartment/Condo properties are the most common (57.9%), reflecting the local real estate landscape.
- Houses represent a significant 15.8% portion, catering likely to families or larger groups.
- The presence of 26.3% Hotel/Boutique listings indicates integration with traditional hospitality.
Ardbeg Airbnb Room Capacity Analysis (2025): Bedroom Distribution
Distribution of Listings by Number of Bedrooms
Room Capacity Insights for Ardbeg
- The dominant room capacity in Ardbeg is 1 bedroom listings, making up 57.9% of the market. This suggests a strong demand for properties suitable for couples or solo travelers.
- Together, 1 bedroom and 2 bedrooms properties represent 79.0% of the active Airbnb listings in Ardbeg, indicating a high concentration in these sizes.
- With over half the market (57.9%) consisting of studios or 1-bedroom units, Ardbeg is particularly well-suited for individuals or couples.
- A significant 21.1% of listings offer 3+ bedrooms, catering to larger groups and families seeking more space in Ardbeg.
Ardbeg Vacation Rental Guest Capacity Trends (2025)
Distribution of Listings by Guest Capacity
Guest Capacity Insights for Ardbeg
- The most common guest capacity trend in Ardbeg vacation rentals is listings accommodating 2 guests (47.4%). This suggests the primary traveler segment is likely couples or solo travelers.
- Properties designed for 2 guests and 3 guests dominate the Ardbeg STR market, accounting for 63.2% of listings.
- A significant 47.4% of listings cater specifically to 1-2 guests, highlighting strong demand from couples and solo travelers in Ardbeg.
- 21.1% of properties accommodate 6+ guests, serving the market segment for larger families or group travel in Ardbeg.
- On average, properties in Ardbeg are equipped to host 3.4 guests.
Ardbeg Airbnb Booking Patterns (2025): Available vs. Booked Days
Available Days Distribution
Booked Days Distribution
Booking Pattern Insights for Ardbeg
- The most common availability pattern in Ardbeg falls within the 271-366 days range, representing 52.6% of listings. This suggests many properties have significant open periods on their calendars.
- Approximately 89.4% of listings show high availability (181+ days open annually), indicating potential for increased bookings or specific owner usage patterns.
- For booked days, the 31-90 days range is most frequent in Ardbeg (47.4%), reflecting common guest stay durations or potential owner blocking patterns.
- A notable 10.5% of properties secure long booking periods (181+ days booked per year), highlighting successful long-term rental strategies or significant owner usage.
Ardbeg Airbnb Minimum Stay Requirements Analysis
Distribution of Listings by Minimum Night Requirement
1 Night
6 listings
31.6% of total
2 Nights
7 listings
36.8% of total
3 Nights
5 listings
26.3% of total
4-6 Nights
1 listings
5.3% of total
Key Insights
- The most prevalent minimum stay requirement in Ardbeg is 2 Nights, adopted by 36.8% of listings. This highlights the market's preference for shorter, flexible bookings.
- A strong majority (68.4%) of the Ardbeg Airbnb data shows acceptance of very short stays (1-2 nights), indicating a dynamic, high-turnover market.
Recommendations
- Align with the market by considering a 2 Nights minimum stay, as 36.8% of Ardbeg hosts use this setting.
- Adjust minimum nights based on seasonality – potentially shorter during low season and longer during peak demand periods in Ardbeg.
Ardbeg Airbnb Cancellation Policy Trends Analysis (2025)
Super Strict 30 Days
6 listings
40% of total
Flexible
1 listings
6.7% of total
Moderate
3 listings
20% of total
Firm
2 listings
13.3% of total
Strict
3 listings
20% of total
Cancellation Policy Insights for Ardbeg
- The prevailing Airbnb cancellation policy trend in Ardbeg is Super Strict 30 Days, used by 40% of listings.
- There's a relatively balanced mix between guest-friendly (26.7%) and stricter (33.3%) policies, offering choices for different guest needs.
Recommendations for Hosts
- Consider adopting a Super Strict 30 Days policy to align with the 40% market standard in Ardbeg.
- Regularly review your cancellation policy against competitors and market demand shifts in Ardbeg.
Ardbeg STR Booking Lead Time Analysis (2025)
Average Booking Lead Time by Month
Booking Lead Time Insights for Ardbeg
- The overall average booking lead time for vacation rentals in Ardbeg is 66 days.
- Guests book furthest in advance for stays during August (average 113 days), likely coinciding with peak travel demand or local events.
- The shortest booking windows occur for stays in November (average 23 days), indicating more last-minute travel plans during this time.
- Seasonally, Summer (99 days avg.) sees the longest lead times, while Winter (44 days avg.) has the shortest, reflecting typical travel planning cycles.
Recommendations for Hosts
- Use the overall average lead time (66 days) as a baseline for your pricing and availability strategy in Ardbeg.
- For August stays, consider implementing length-of-stay discounts or slightly higher rates for bookings made less than 113 days out to capitalize on advance planning.
- Target marketing efforts for the Summer season well in advance (at least 99 days) to capture early planners.
- Monitor your own booking lead times against these Ardbeg averages to identify opportunities for dynamic pricing adjustments.
Popular & Essential Airbnb Amenities in Ardbeg (2025)
Amenity Prevalence
Amenity Insights for Ardbeg
- Essential amenities in Ardbeg that guests expect include: Wifi, Heating. Lacking these (any) could significantly impact bookings.
- Popular amenities like Hair dryer, Essentials, Hangers are common but not universal. Offering these can provide a competitive edge.
Recommendations for Hosts
- Ensure your listing includes all essential amenities for Ardbeg: Wifi, Heating.
- Consider adding popular differentiators like Hair dryer or Essentials to increase appeal.
- Highlight unique or less common amenities you offer (e.g., hot tub, dedicated workspace, EV charger) in your listing description and photos.
- Regularly check competitor amenities in Ardbeg to stay competitive.
Ardbeg Airbnb Guest Demographics & Profile Analysis (2025)
Guest Profile Summary for Ardbeg
- The typical guest profile for Airbnb in Ardbeg consists of primarily domestic travelers (90%), often arriving from nearby England, typically belonging to the Post-2000s (Gen Z/Alpha) group (50%), primarily speaking English or French.
- Domestic travelers account for 90.2% of guests.
- Key international markets include United Kingdom (90.2%) and Canada (2.4%).
- Top languages spoken are English (59.1%) followed by French (11.4%).
- A significant demographic segment is the Post-2000s (Gen Z/Alpha) group, representing 50% of guests.
Recommendations for Hosts
- Target domestic marketing efforts towards travelers from England and Glasgow.
- Tailor amenities and listing descriptions to appeal to the dominant Post-2000s (Gen Z/Alpha) demographic (e.g., highlight fast WiFi, smart home features, local guides).
- Highlight unique local experiences or amenities relevant to the primary guest profile.
- Consider seasonal promotions aligned with peak travel times for key origin markets.
Nearby Short-Term Rental Market Comparison
How does the Ardbeg Airbnb market stack up against its neighbors? Compare key performance metrics like average monthly revenue, ADR, and occupancy rates in surrounding areas to understand the broader regional STR landscape.
| Market | Active Properties | Monthly Revenue | Daily Rate | Avg. Occupancy |
|---|---|---|---|---|
| Galston | 11 | $7,951 | $676.77 | 46% |
| Fearnan | 19 | $6,440 | $421.92 | 53% |
| Glenachulish | 33 | $5,609 | $424.51 | 46% |
| Arrochar | 33 | $5,045 | $339.11 | 56% |
| Acharn | 10 | $4,813 | $278.43 | 57% |
| Croftamie | 19 | $4,609 | $267.39 | 52% |
| Carrick Castle | 11 | $4,591 | $586.01 | 42% |
| Corran | 24 | $4,576 | $370.68 | 45% |
| Gartocharn | 15 | $4,426 | $354.91 | 46% |
| Bruichladdich | 17 | $4,306 | $295.85 | 58% |