Anstruther Airbnb Market Analysis 2025: Short Term Rental Data & Vacation Rental Statistics in Scotland, United Kingdom
Is Airbnb profitable in Anstruther in 2025? Explore comprehensive Airbnb analytics for Anstruther, Scotland, United Kingdom to uncover income potential. This 2025 STR market report for Anstruther, based on AirROI data from April 2024 to March 2025, reveals key trends in the niche market of 67 active listings.
Whether you're considering an Airbnb investment in Anstruther, optimizing your existing vacation rental, or exploring rental arbitrage opportunities, understanding the Anstruther Airbnb data is crucial. Navigating the high regulation landscape is key to maximizing your short term rental income potential. Let's dive into the specifics.
Key Anstruther Airbnb Performance Metrics Overview
Monthly Airbnb Revenue Variations & Income Potential in Anstruther (2025)
Understanding the monthly revenue variations for Airbnb listings in Anstruther is key to maximizing your short term rental income potential. Seasonality significantly impacts earnings. Our analysis, based on data from the past 12 months, shows that the peak revenue month for STRs in Anstruther is typically August, while January often presents the lowest earnings, highlighting opportunities for strategic pricing adjustments during shoulder and low seasons. Explore the typical Airbnb income in Anstruther across different performance tiers:
- Best-in-class properties (Top 10%) achieve $6,196+ monthly, often utilizing dynamic pricing and superior guest experiences.
- Strong performing properties (Top 25%) earn $3,968 or more, indicating effective management and desirable locations/amenities.
- Typical properties (Median) generate around $2,412 per month, representing the average market performance.
- Entry-level properties (Bottom 25%) see earnings around $1,216, often with potential for optimization.
Average Monthly Airbnb Earnings Trend in Anstruther
Anstruther Airbnb Occupancy Rate Trends (2025)
Maximize your bookings by understanding the Anstruther STR occupancy trends. Seasonal demand shifts significantly influence how often properties are booked. Typically, Julysees the highest demand (peak season occupancy), while January experiences the lowest (low season). Effective strategies, like adjusting minimum stays or offering promotions, can boost occupancy during slower periods. Here's how different property tiers perform in Anstruther:
- Best-in-class properties (Top 10%) achieve 82%+ occupancy, indicating high desirability and potentially optimized availability.
- Strong performing properties (Top 25%) maintain 65% or higher occupancy, suggesting good market fit and guest satisfaction.
- Typical properties (Median) have an occupancy rate around 43%.
- Entry-level properties (Bottom 25%) average 19% occupancy, potentially facing higher vacancy.
Average Monthly Occupancy Rate Trend in Anstruther
Average Daily Rate (ADR) Airbnb Trends in Anstruther (2025)
Effective short term rental pricing strategy in Anstruther involves understanding monthly ADR fluctuations. The Average Daily Rate (ADR) for Airbnb in Anstruther typically peaks in July and dips lowest during February. Leveraging Airbnb dynamic pricing tools or strategies based on this seasonality can significantly boost revenue. Here's a look at the typical nightly rates achieved:
- Best-in-class properties (Top 10%) command rates of $341+ per night, often due to premium features or locations.
- Strong performing properties (Top 25%) achieve nightly rates of $259 or more.
- Typical properties (Median) charge around $186 per night.
- Entry-level properties (Bottom 25%) earn around $144 per night.
Average Daily Rate (ADR) Trend by Month in Anstruther
Get Live Anstruther Market Intelligence 👇

Explore Real-time Analytics
Airbnb Seasonality Analysis & Trends in Anstruther (2025)
Peak Season (August, July, May)
- Revenue averages $4,286 per month
- Occupancy rates average 57.3%
- Daily rates average $234
Shoulder Season
- Revenue averages $3,037 per month
- Occupancy maintains around 43.7%
- Daily rates hold near $224
Low Season (January, February, March)
- Revenue drops to average $1,779 per month
- Occupancy decreases to average 31.3%
- Daily rates adjust to average $202
Seasonality Insights for Anstruther
- The Airbnb seasonality in Anstruther shows highly seasonal trends requiring careful strategy. While the sections above show seasonal averages, it's also insightful to look at the extremes:
- During the high season, the absolute peak month showcases Anstruther's highest earning potential, with monthly revenues capable of climbing to $4,665, occupancy reaching a high of 61.7%, and ADRs peaking at $237.
- Conversely, the slowest single month of the year, typically falling within the low season, marks the market's lowest point. In this month, revenue might dip to $1,641, occupancy could drop to 26.8%, and ADRs may adjust down to $201.
- Understanding both the seasonal averages and these monthly peaks and troughs in revenue, occupancy, and ADR is crucial for maximizing your Airbnb profit potential in Anstruther.
Seasonal Strategies for Maximizing Profit
- Peak Season: Maximize revenue through premium pricing and potentially longer minimum stays. Ensure high availability.
- Low Season: Offer competitive pricing, special promotions (e.g., extended stay discounts), and flexible cancellation policies. Target off-season travelers like remote workers or budget-conscious guests.
- Shoulder Seasons: Implement dynamic pricing that balances peak and low rates. Target weekend travelers or specific events. Offer slightly more flexible terms than peak season.
- Regularly analyze your own performance against these Anstruther seasonality benchmarks and adjust your pricing and availability strategy accordingly.
Best Areas for Airbnb Investment in Anstruther (2025)
Exploring the top neighborhoods for short-term rentals in Anstruther? This section highlights key areas, outlining why they are attractive for hosts and guests, along with notable local attractions. Consider these locations based on your target guest profile and investment strategy.
| Neighborhood / Area | Why Host Here? (Target Guests & Appeal) | Key Attractions & Landmarks |
|---|---|---|
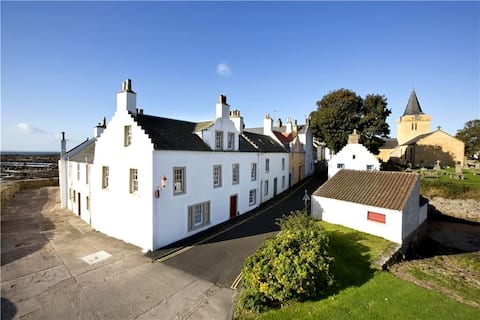
| North Street | The main thoroughfare of Anstruther, bustling with shops, cafes, and restaurants. It's a popular spot for both locals and tourists, making it ideal for Airbnb hosting. | Anstruther Fish Bar, The Old Toll Bar, The Scottish Fisheries Museum, Local shops and boutiques, Sea view park areas |
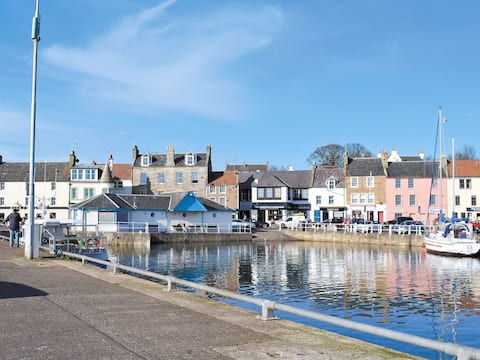
| The Harbour | A picturesque harbour area known for its boating activities and seafood restaurants. Great for tourists looking for beautiful views and dining options. | Anstruther Harbour, Boat tours, Fisheries Museum, Coastal walks, Seafood eateries |
| Crail | A charming village near Anstruther with stunning coastal views, historical sites, and a quieter atmosphere ideal for relaxation. | Crail Harbour, Crail Pottery, Wildlife walks, Local craft shops, Crail Golfing Society |
| St Monans | Known for its beautiful coastal scenery and historical wells, it's a tranquil spot for visitors wanting to explore the East Neuk of Fife. | St Monans Windmill, The St Monans Church, Coastal walks, Local wildlife, The picturesque harbour |
| Pittenweem | Famous for its arts scene and festivals, attracting a vibrant community. It's popular with artists and visitors alike. | Pittenweem Arts Festival, Pittenweem Harbour, Art galleries, Historic buildings, Local shops |
| Cellardyke | A lovely residential area with a close-knit community feel. Offers stunning coastal views with easy access to Anstruther's amenities. | Coastal path, Cellardyke harbour, Great for swimming and boating, Local parks, Scenic views |
| Falkland | A bit further inland, this village is famous for its well-preserved historical sites, making it a good base for exploring the region. | Falkland Palace, Falkland Estate, Historic village architecture, Local festivals, Walking trails |
| Kirkcaldy | The largest town nearby with entertainment, shopping, and cultural attractions. Great for guests looking for more urban experiences while visiting Fife. | Kirkcaldy Galleries, Local restaurants, Theatre and performance venues, Kirkcaldy Beach, Shopping centres |
Understanding Airbnb License Requirements & STR Laws in Anstruther (2025)
Yes, Anstruther, Scotland, United Kingdom enforces high STR regulations. Obtaining a license and ensuring compliance is almost certainly required according to current 2025 STR laws. Always verify the latest short term rental regulations and Airbnb license requirements directly with local government authorities for Anstruther to ensure full compliance before hosting.
(Source: AirROI data, 2025, based on 46% licensed listings)
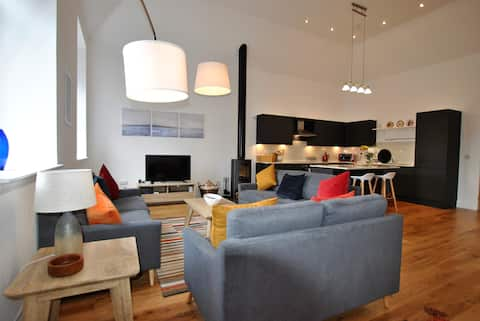
Top Performing Airbnb Properties in Anstruther (2025)
Benchmark your potential! Explore examples of top-performing Airbnb properties in Anstrutherbased on Trailing Twelve Month (TTM) revenue. Analyze their characteristics, revenue, occupancy rate, and ADR to understand what drives success in this market.

Sea view Historical Library in Anstruther
Entire Place • 6 bedrooms

Walter's Neuk Anstruther- luxury coastal home
Entire Place • 3 bedrooms
Harbourside Apartment
Entire Place • 3 bedrooms

Ainster House
Entire Place • 4 bedrooms
Merchant's House- stunning sea view period home
Entire Place • 3 bedrooms
Academy Apartment Anstruther- stunning luxury home
Entire Place • 2 bedrooms
Note: Performance varies based on location, size, amenities, seasonality, and management quality. Data reflects the past 12 months.
Top Performing Airbnb Hosts in Anstruther (2025)
Learn from the best! This table showcases top-performing Airbnb hosts in Anstruther based on the number of properties managed and estimated total revenue over the past year. Analyze their scale and performance metrics.
| Host Name | Properties | Grossing Revenue | Stay Reviews | Avg Rating |
|---|---|---|---|---|
| Gillian | 16 | $619,905 | 389 | 3.99/5.0 |
| Cottages | 5 | $178,376 | 46 | 4.87/5.0 |
| Darius | 1 | $163,090 | 41 | 4.98/5.0 |
| Daryl | 4 | $126,944 | 100 | 4.87/5.0 |
| Travelnest | 6 | $97,944 | 200 | 4.86/5.0 |
| Ross | 1 | $78,944 | 58 | 4.98/5.0 |
| Lynsey | 2 | $69,417 | 54 | 4.99/5.0 |
| Terry | 1 | $51,670 | 245 | 5.00/5.0 |
| Harry | 1 | $48,304 | 41 | 4.90/5.0 |
| John | 2 | $44,766 | 553 | 4.96/5.0 |
Analyzing the strategies of top hosts, such as their property selection, pricing, and guest communication, can offer valuable lessons for optimizing your own Airbnb operations in Anstruther.
Dive Deeper: Advanced Anstruther STR Market Data (2025)
Ready to unlock more insights? AirROI provides access to advanced metrics and comprehensive Airbnb data for Anstruther. Explore detailed analytics beyond this report to refine your investment strategy, optimize pricing, and maximize your vacation rental profits.
Explore Advanced MetricsAnstruther Short-Term Rental Market Composition (2025): Property & Room Types
Room Type Distribution
Property Type Distribution
Market Composition Insights for Anstruther
- The Anstruther Airbnb market composition is heavily skewed towards Entire Home/Apt listings, which make up 89.6% of the 67 active rentals. This indicates strong guest preference for privacy and space.
- Looking at the property type distribution in Anstruther, House properties are the most common (52.2%), reflecting the local real estate landscape.
- Houses represent a significant 52.2% portion, catering likely to families or larger groups.
- The presence of 9% Hotel/Boutique listings indicates integration with traditional hospitality.
- Smaller segments like others (combined 3.0%) offer potential for unique stay experiences.
Anstruther Airbnb Room Capacity Analysis (2025): Bedroom Distribution
Distribution of Listings by Number of Bedrooms
Room Capacity Insights for Anstruther
- The dominant room capacity in Anstruther is 2 bedrooms listings, making up 41.8% of the market. This suggests a strong demand for properties suitable for couples or solo travelers.
- Together, 2 bedrooms and 3 bedrooms properties represent 70.2% of the active Airbnb listings in Anstruther, indicating a high concentration in these sizes.
- A significant 34.4% of listings offer 3+ bedrooms, catering to larger groups and families seeking more space in Anstruther.
Anstruther Vacation Rental Guest Capacity Trends (2025)
Distribution of Listings by Guest Capacity
Guest Capacity Insights for Anstruther
- The most common guest capacity trend in Anstruther vacation rentals is listings accommodating 4 guests (41.8%). This suggests the primary traveler segment is likely small families or groups.
- Properties designed for 4 guests and 6 guests dominate the Anstruther STR market, accounting for 64.2% of listings.
- 31.4% of properties accommodate 6+ guests, serving the market segment for larger families or group travel in Anstruther.
- On average, properties in Anstruther are equipped to host 4.3 guests.
Anstruther Airbnb Booking Patterns (2025): Available vs. Booked Days
Available Days Distribution
Booked Days Distribution
Booking Pattern Insights for Anstruther
- The most common availability pattern in Anstruther falls within the 271-366 days range, representing 38.8% of listings. This suggests many properties have significant open periods on their calendars.
- Approximately 73.1% of listings show high availability (181+ days open annually), indicating potential for increased bookings or specific owner usage patterns.
- For booked days, the 91-180 days range is most frequent in Anstruther (34.3%), reflecting common guest stay durations or potential owner blocking patterns.
- A notable 28.3% of properties secure long booking periods (181+ days booked per year), highlighting successful long-term rental strategies or significant owner usage.
Anstruther Airbnb Minimum Stay Requirements Analysis
Distribution of Listings by Minimum Night Requirement
1 Night
18 listings
27.7% of total
2 Nights
16 listings
24.6% of total
3 Nights
14 listings
21.5% of total
4-6 Nights
2 listings
3.1% of total
30+ Nights
15 listings
23.1% of total
Key Insights
- The most prevalent minimum stay requirement in Anstruther is 1 Night, adopted by 27.7% of listings. This highlights the market's preference for shorter, flexible bookings.
- A significant segment (23.1%) caters to monthly stays (30+ nights) in Anstruther, pointing to opportunities in the extended-stay market.
Recommendations
- Align with the market by considering a 1 Night minimum stay, as 27.7% of Anstruther hosts use this setting.
- If feasible, allowing 1-night stays, especially midweek or during low season, could capture last-minute bookings, as only 27.7% currently do.
- Explore offering discounts for stays of 30+ nights to attract the 23.1% of the market seeking extended stays.
- Adjust minimum nights based on seasonality – potentially shorter during low season and longer during peak demand periods in Anstruther.
Anstruther Airbnb Cancellation Policy Trends Analysis (2025)
Super Strict 30 Days
6 listings
9.5% of total
Super Strict 60 Days
5 listings
7.9% of total
Flexible
4 listings
6.3% of total
Moderate
19 listings
30.2% of total
Firm
10 listings
15.9% of total
Strict
19 listings
30.2% of total
Cancellation Policy Insights for Anstruther
- The prevailing Airbnb cancellation policy trend in Anstruther is Moderate, used by 30.2% of listings.
- There's a relatively balanced mix between guest-friendly (36.5%) and stricter (46.1%) policies, offering choices for different guest needs.
Recommendations for Hosts
- Consider adopting a Moderate policy to align with the 30.2% market standard in Anstruther.
- With 30.2% using Strict terms, this is a viable option in Anstruther, particularly for high-value properties or during peak demand periods.
- Regularly review your cancellation policy against competitors and market demand shifts in Anstruther.
Anstruther STR Booking Lead Time Analysis (2025)
Average Booking Lead Time by Month
Booking Lead Time Insights for Anstruther
- The overall average booking lead time for vacation rentals in Anstruther is 74 days.
- Guests book furthest in advance for stays during July (average 112 days), likely coinciding with peak travel demand or local events.
- The shortest booking windows occur for stays in February (average 50 days), indicating more last-minute travel plans during this time.
- Seasonally, Summer (110 days avg.) sees the longest lead times, while Fall (65 days avg.) has the shortest, reflecting typical travel planning cycles.
Recommendations for Hosts
- Use the overall average lead time (74 days) as a baseline for your pricing and availability strategy in Anstruther.
- For July stays, consider implementing length-of-stay discounts or slightly higher rates for bookings made less than 112 days out to capitalize on advance planning.
- Target marketing efforts for the Summer season well in advance (at least 110 days) to capture early planners.
- Monitor your own booking lead times against these Anstruther averages to identify opportunities for dynamic pricing adjustments.
Popular & Essential Airbnb Amenities in Anstruther (2025)
Amenity Prevalence
Amenity Insights for Anstruther
- Essential amenities in Anstruther that guests expect include: Smoke alarm, Wifi, Heating. Lacking these (any) could significantly impact bookings.
- Popular amenities like TV, Kitchen, Carbon monoxide alarm are common but not universal. Offering these can provide a competitive edge.
Recommendations for Hosts
- Ensure your listing includes all essential amenities for Anstruther: Smoke alarm, Wifi, Heating.
- Prioritize adding missing essentials: Wifi, Heating.
- Consider adding popular differentiators like TV or Kitchen to increase appeal.
- Highlight unique or less common amenities you offer (e.g., hot tub, dedicated workspace, EV charger) in your listing description and photos.
- Regularly check competitor amenities in Anstruther to stay competitive.
Anstruther Airbnb Guest Demographics & Profile Analysis (2025)
Guest Profile Summary for Anstruther
- The typical guest profile for Airbnb in Anstruther consists of primarily domestic travelers (78%), often arriving from nearby Scotland, typically belonging to the Post-2000s (Gen Z/Alpha) group (50%), primarily speaking English or French.
- Domestic travelers account for 77.6% of guests.
- Key international markets include United Kingdom (77.6%) and United States (8.1%).
- Top languages spoken are English (62.4%) followed by French (10.5%).
- A significant demographic segment is the Post-2000s (Gen Z/Alpha) group, representing 50% of guests.
Recommendations for Hosts
- Target domestic marketing efforts towards travelers from Scotland and Edinburgh.
- Tailor amenities and listing descriptions to appeal to the dominant Post-2000s (Gen Z/Alpha) demographic (e.g., highlight fast WiFi, smart home features, local guides).
- Highlight unique local experiences or amenities relevant to the primary guest profile.
- Consider seasonal promotions aligned with peak travel times for key origin markets.
Nearby Short-Term Rental Market Comparison
How does the Anstruther Airbnb market stack up against its neighbors? Compare key performance metrics like average monthly revenue, ADR, and occupancy rates in surrounding areas to understand the broader regional STR landscape.
| Market | Active Properties | Monthly Revenue | Daily Rate | Avg. Occupancy |
|---|---|---|---|---|
| Gorebridge | 12 | $6,209 | $493.62 | 54% |
| Bridge of Cally | 16 | $5,839 | $566.24 | 50% |
| City of Edinburgh | 4,312 | $4,528 | $274.67 | 61% |
| Kenmore | 10 | $4,507 | $430.34 | 41% |
| Insh | 14 | $4,473 | $289.96 | 63% |
| Kielder | 12 | $4,215 | $329.21 | 53% |
| Auchtermuchty | 11 | $3,979 | $365.72 | 50% |
| Gleneagles | 10 | $3,964 | $284.15 | 45% |
| Leuchars | 16 | $3,949 | $400.90 | 43% |
| St Andrews | 359 | $3,908 | $373.13 | 50% |