Annan Airbnb Market Analysis 2025: Short Term Rental Data & Vacation Rental Statistics in Scotland, United Kingdom
Is Airbnb profitable in Annan in 2025? Explore comprehensive Airbnb analytics for Annan, Scotland, United Kingdom to uncover income potential. This 2025 STR market report for Annan, based on AirROI data from April 2024 to March 2025, reveals key trends in the niche market of 23 active listings.
Whether you're considering an Airbnb investment in Annan, optimizing your existing vacation rental, or exploring rental arbitrage opportunities, understanding the Annan Airbnb data is crucial. Understanding the local regulations is key to maximizing your short term rental income potential. Let's dive into the specifics.
Key Annan Airbnb Performance Metrics Overview
Monthly Airbnb Revenue Variations & Income Potential in Annan (2025)
Understanding the monthly revenue variations for Airbnb listings in Annan is key to maximizing your short term rental income potential. Seasonality significantly impacts earnings. Our analysis, based on data from the past 12 months, shows that the peak revenue month for STRs in Annan is typically July, while February often presents the lowest earnings, highlighting opportunities for strategic pricing adjustments during shoulder and low seasons. Explore the typical Airbnb income in Annan across different performance tiers:
- Best-in-class properties (Top 10%) achieve $3,764+ monthly, often utilizing dynamic pricing and superior guest experiences.
- Strong performing properties (Top 25%) earn $2,623 or more, indicating effective management and desirable locations/amenities.
- Typical properties (Median) generate around $1,586 per month, representing the average market performance.
- Entry-level properties (Bottom 25%) see earnings around $691, often with potential for optimization.
Average Monthly Airbnb Earnings Trend in Annan
Annan Airbnb Occupancy Rate Trends (2025)
Maximize your bookings by understanding the Annan STR occupancy trends. Seasonal demand shifts significantly influence how often properties are booked. Typically, Julysees the highest demand (peak season occupancy), while March experiences the lowest (low season). Effective strategies, like adjusting minimum stays or offering promotions, can boost occupancy during slower periods. Here's how different property tiers perform in Annan:
- Best-in-class properties (Top 10%) achieve 73%+ occupancy, indicating high desirability and potentially optimized availability.
- Strong performing properties (Top 25%) maintain 61% or higher occupancy, suggesting good market fit and guest satisfaction.
- Typical properties (Median) have an occupancy rate around 43%.
- Entry-level properties (Bottom 25%) average 24% occupancy, potentially facing higher vacancy.
Average Monthly Occupancy Rate Trend in Annan
Average Daily Rate (ADR) Airbnb Trends in Annan (2025)
Effective short term rental pricing strategy in Annan involves understanding monthly ADR fluctuations. The Average Daily Rate (ADR) for Airbnb in Annan typically peaks in October and dips lowest during January. Leveraging Airbnb dynamic pricing tools or strategies based on this seasonality can significantly boost revenue. Here's a look at the typical nightly rates achieved:
- Best-in-class properties (Top 10%) command rates of $295+ per night, often due to premium features or locations.
- Strong performing properties (Top 25%) achieve nightly rates of $213 or more.
- Typical properties (Median) charge around $126 per night.
- Entry-level properties (Bottom 25%) earn around $95 per night.
Average Daily Rate (ADR) Trend by Month in Annan
Get Live Annan Market Intelligence 👇

Explore Real-time Analytics
Airbnb Seasonality Analysis & Trends in Annan (2025)
Peak Season (July, August, September)
- Revenue averages $2,618 per month
- Occupancy rates average 55.4%
- Daily rates average $182
Shoulder Season
- Revenue averages $1,868 per month
- Occupancy maintains around 43.4%
- Daily rates hold near $170
Low Season (January, February, March)
- Revenue drops to average $1,152 per month
- Occupancy decreases to average 28.7%
- Daily rates adjust to average $148
Seasonality Insights for Annan
- The Airbnb seasonality in Annan shows highly seasonal trends requiring careful strategy. While the sections above show seasonal averages, it's also insightful to look at the extremes:
- During the high season, the absolute peak month showcases Annan's highest earning potential, with monthly revenues capable of climbing to $3,049, occupancy reaching a high of 59.9%, and ADRs peaking at $184.
- Conversely, the slowest single month of the year, typically falling within the low season, marks the market's lowest point. In this month, revenue might dip to $1,070, occupancy could drop to 26.9%, and ADRs may adjust down to $147.
- Understanding both the seasonal averages and these monthly peaks and troughs in revenue, occupancy, and ADR is crucial for maximizing your Airbnb profit potential in Annan.
Seasonal Strategies for Maximizing Profit
- Peak Season: Maximize revenue through premium pricing and potentially longer minimum stays. Ensure high availability.
- Low Season: Offer competitive pricing, special promotions (e.g., extended stay discounts), and flexible cancellation policies. Target off-season travelers like remote workers or budget-conscious guests.
- Shoulder Seasons: Implement dynamic pricing that balances peak and low rates. Target weekend travelers or specific events. Offer slightly more flexible terms than peak season.
- Regularly analyze your own performance against these Annan seasonality benchmarks and adjust your pricing and availability strategy accordingly.
Best Areas for Airbnb Investment in Annan (2025)
Exploring the top neighborhoods for short-term rentals in Annan? This section highlights key areas, outlining why they are attractive for hosts and guests, along with notable local attractions. Consider these locations based on your target guest profile and investment strategy.
| Neighborhood / Area | Why Host Here? (Target Guests & Appeal) | Key Attractions & Landmarks |
|---|---|---|
| High Street | Annan's main thoroughfare, popular for shopping and local cafés. A prime spot for visitors wanting to explore the town's culture and heritage, with easy access to local amenities. | Annan Museum, Annan Old Bridge, Local shops and boutiques, Cafés and restaurants, Topping and Company Booksellers |
| Dumfries and Galloway | A beautiful area surrounding Annan, known for its stunning countryside and historic sites. Perfect for guests looking to explore nature and the outdoors. | Caerlaverock Castle, Rainforest Garden, Solway Coast, Dumfries and Galloway Aviation Museum, Galloway Forest Park |
| Eastriggs | A nearby village with historical significance, popular for its unique architecture and proximity to nature walks. A quieter alternative for guests wanting a peaceful stay while being close to Annan. | Eastriggs War Memorial, Eastriggs Heritage Centre, Nearby riverside walks, Local pubs and eateries, Scenic countryside |
| Mabie Forest | A natural forest area just a short drive from Annan, ideal for outdoor enthusiasts and families looking for adventure. Offers a range of walking and biking trails. | Mabie Forest Trails, Adventure park, Scenic picnic areas, Bike rental facilities, Nature watching |
| Angus Avenue | A residential area with charming homes and close-knit community feel. Attractive for travelers looking for a homely experience away from the hustle and bustle. | Local parks, Family-friendly environment, Quiet neighborhood, Nearby schools, Local events and gatherings |
| Annan Water | The scenic river that runs through Annan, providing lovely views and opportunities for fishing and riverside walks. A relaxing area for guests who appreciate nature. | Annan Water fishing spots, Riverside paths, Picnic areas, Wildlife watching, Quiet retreats |
| Baldocco | A tranquil area on the outskirts of Annan, ideal for those looking to escape the crowds and enjoy nature. Perfect for serene retreats or family gatherings. | Nearby hiking trails, Parks, Countryside views, Local wildlife, Community events |
| Thornhill | A charming village close to Annan, offering a glimpse into rural life in Scotland. Ideal for those wanting an authentic local experience with easy access to Annan's amenities. | Historic village center, Local festivals, Craft shops, Cafés, Proximity to hiking trails |
Understanding Airbnb License Requirements & STR Laws in Annan (2025)
With 22% of listings showing registration in 2025, understanding potential Airbnb license requirements is crucial in Annan. Always verify the latest short term rental regulations and Airbnb license requirements directly with local government authorities for Annan to ensure full compliance before hosting.
(Source: AirROI data, 2025, based on 22% licensed listings)
Top Performing Airbnb Properties in Annan (2025)
Benchmark your potential! Explore examples of top-performing Airbnb properties in Annanbased on Trailing Twelve Month (TTM) revenue. Analyze their characteristics, revenue, occupancy rate, and ADR to understand what drives success in this market.

DISTILLERY(The Stables) with private HOT TUB
Entire Place • 2 bedrooms

Annan, Dumfries & Galloway, Scotland Barn - 2 Bed
Entire Place • 2 bedrooms

THE TACKROOM with private HOT TUB
Entire Place • 2 bedrooms

Delightful summerhouse studio with hot tub
Entire Place • 1 bedroom
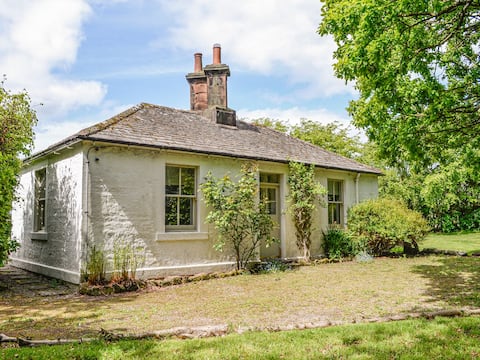
Milnfield Cottage
Entire Place • 3 bedrooms
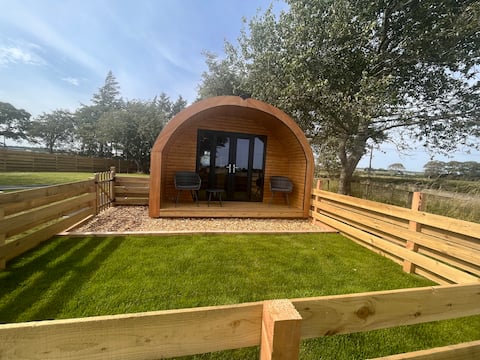
Sea Views-Scotland-Cluaran Cabins-Solway Breeze
Entire Place • 1 bedroom
Note: Performance varies based on location, size, amenities, seasonality, and management quality. Data reflects the past 12 months.
Top Performing Airbnb Hosts in Annan (2025)
Learn from the best! This table showcases top-performing Airbnb hosts in Annan based on the number of properties managed and estimated total revenue over the past year. Analyze their scale and performance metrics.
| Host Name | Properties | Grossing Revenue | Stay Reviews | Avg Rating |
|---|---|---|---|---|
| Margaret | 2 | $80,836 | 185 | 4.99/5.0 |
| Emma | 2 | $49,749 | 518 | 4.99/5.0 |
| Lesley | 1 | $36,290 | 214 | 5.00/5.0 |
| Linden | 1 | $31,836 | 165 | 4.92/5.0 |
| Jamie | 4 | $30,683 | 145 | 4.75/5.0 |
| Host #222202509 | 1 | $27,241 | 5 | 3.80/5.0 |
| Angela | 1 | $25,249 | 54 | 4.74/5.0 |
| Lee | 1 | $22,938 | 30 | 4.70/5.0 |
| Joanna | 1 | $21,525 | 25 | 4.88/5.0 |
| Ros | 1 | $15,392 | 61 | 4.93/5.0 |
Analyzing the strategies of top hosts, such as their property selection, pricing, and guest communication, can offer valuable lessons for optimizing your own Airbnb operations in Annan.
Dive Deeper: Advanced Annan STR Market Data (2025)
Ready to unlock more insights? AirROI provides access to advanced metrics and comprehensive Airbnb data for Annan. Explore detailed analytics beyond this report to refine your investment strategy, optimize pricing, and maximize your vacation rental profits.
Explore Advanced MetricsAnnan Short-Term Rental Market Composition (2025): Property & Room Types
Room Type Distribution
Property Type Distribution
Market Composition Insights for Annan
- The Annan Airbnb market composition is heavily skewed towards Entire Home/Apt listings, which make up 69.6% of the 23 active rentals. This indicates strong guest preference for privacy and space.
- However, a notable 30.4% share for Private Rooms suggests opportunities for budget-conscious travelers or hosts renting out spare rooms.
- Looking at the property type distribution in Annan, House properties are the most common (43.5%), reflecting the local real estate landscape.
- Houses represent a significant 43.5% portion, catering likely to families or larger groups.
- The presence of 21.7% Hotel/Boutique listings indicates integration with traditional hospitality.
- Smaller segments like unique stays, others (combined 8.6%) offer potential for unique stay experiences.
Annan Airbnb Room Capacity Analysis (2025): Bedroom Distribution
Distribution of Listings by Number of Bedrooms
Room Capacity Insights for Annan
- The dominant room capacity in Annan is 2 bedrooms listings, making up 34.8% of the market. This suggests a strong demand for properties suitable for couples or solo travelers.
- Together, 2 bedrooms and 1 bedroom properties represent 65.2% of the active Airbnb listings in Annan, indicating a high concentration in these sizes.
- A significant 30.4% of listings offer 3+ bedrooms, catering to larger groups and families seeking more space in Annan.
Annan Vacation Rental Guest Capacity Trends (2025)
Distribution of Listings by Guest Capacity
Guest Capacity Insights for Annan
- The most common guest capacity trend in Annan vacation rentals is listings accommodating 4 guests (34.8%). This suggests the primary traveler segment is likely small families or groups.
- Properties designed for 4 guests and 2 guests dominate the Annan STR market, accounting for 56.5% of listings.
- On average, properties in Annan are equipped to host 3.1 guests.
Annan Airbnb Booking Patterns (2025): Available vs. Booked Days
Available Days Distribution
Booked Days Distribution
Booking Pattern Insights for Annan
- The most common availability pattern in Annan falls within the 271-366 days range, representing 43.5% of listings. This suggests many properties have significant open periods on their calendars.
- Approximately 69.6% of listings show high availability (181+ days open annually), indicating potential for increased bookings or specific owner usage patterns.
- For booked days, the 181-270 days range is most frequent in Annan (30.4%), reflecting common guest stay durations or potential owner blocking patterns.
- A notable 30.4% of properties secure long booking periods (181+ days booked per year), highlighting successful long-term rental strategies or significant owner usage.
Annan Airbnb Minimum Stay Requirements Analysis
Distribution of Listings by Minimum Night Requirement
1 Night
12 listings
54.5% of total
2 Nights
3 listings
13.6% of total
3 Nights
4 listings
18.2% of total
30+ Nights
3 listings
13.6% of total
Key Insights
- The most prevalent minimum stay requirement in Annan is 1 Night, adopted by 54.5% of listings. This highlights the market's preference for shorter, flexible bookings.
- A strong majority (68.1%) of the Annan Airbnb data shows acceptance of very short stays (1-2 nights), indicating a dynamic, high-turnover market.
- A significant segment (13.6%) caters to monthly stays (30+ nights) in Annan, pointing to opportunities in the extended-stay market.
Recommendations
- Align with the market by considering a 1 Night minimum stay, as 54.5% of Annan hosts use this setting.
- Explore offering discounts for stays of 30+ nights to attract the 13.6% of the market seeking extended stays.
- Adjust minimum nights based on seasonality – potentially shorter during low season and longer during peak demand periods in Annan.
Annan Airbnb Cancellation Policy Trends Analysis (2025)
Flexible
9 listings
40.9% of total
Moderate
5 listings
22.7% of total
Firm
4 listings
18.2% of total
Strict
4 listings
18.2% of total
Cancellation Policy Insights for Annan
- The prevailing Airbnb cancellation policy trend in Annan is Flexible, used by 40.9% of listings.
- There's a relatively balanced mix between guest-friendly (63.6%) and stricter (36.4%) policies, offering choices for different guest needs.
Recommendations for Hosts
- Consider adopting a Flexible policy to align with the 40.9% market standard in Annan.
- Regularly review your cancellation policy against competitors and market demand shifts in Annan.
Annan STR Booking Lead Time Analysis (2025)
Average Booking Lead Time by Month
Booking Lead Time Insights for Annan
- The overall average booking lead time for vacation rentals in Annan is 90 days.
- Guests book furthest in advance for stays during January (average 135 days), likely coinciding with peak travel demand or local events.
- The shortest booking windows occur for stays in February (average 57 days), indicating more last-minute travel plans during this time.
- Seasonally, Fall (107 days avg.) sees the longest lead times, while Spring (90 days avg.) has the shortest, reflecting typical travel planning cycles.
Recommendations for Hosts
- Use the overall average lead time (90 days) as a baseline for your pricing and availability strategy in Annan.
- For January stays, consider implementing length-of-stay discounts or slightly higher rates for bookings made less than 135 days out to capitalize on advance planning.
- Target marketing efforts for the Fall season well in advance (at least 107 days) to capture early planners.
- Monitor your own booking lead times against these Annan averages to identify opportunities for dynamic pricing adjustments.
Popular & Essential Airbnb Amenities in Annan (2025)
Amenity Prevalence
Amenity Insights for Annan
- Essential amenities in Annan that guests expect include: Wifi, TV, Essentials. Lacking these (any) could significantly impact bookings.
- Popular amenities like Heating, Kitchen, Free parking on premises are common but not universal. Offering these can provide a competitive edge.
Recommendations for Hosts
- Ensure your listing includes all essential amenities for Annan: Wifi, TV, Essentials.
- Prioritize adding missing essentials: Essentials.
- Consider adding popular differentiators like Heating or Kitchen to increase appeal.
- Highlight unique or less common amenities you offer (e.g., hot tub, dedicated workspace, EV charger) in your listing description and photos.
- Regularly check competitor amenities in Annan to stay competitive.
Annan Airbnb Guest Demographics & Profile Analysis (2025)
Guest Profile Summary for Annan
- The typical guest profile for Airbnb in Annan consists of primarily domestic travelers (91%), often arriving from nearby England, typically belonging to the Post-2000s (Gen Z/Alpha) group (50%), primarily speaking English or French.
- Domestic travelers account for 90.8% of guests.
- Key international markets include United Kingdom (90.8%) and United States (2.9%).
- Top languages spoken are English (70.9%) followed by French (11.8%).
- A significant demographic segment is the Post-2000s (Gen Z/Alpha) group, representing 50% of guests.
Recommendations for Hosts
- Target domestic marketing efforts towards travelers from England and Scotland.
- Tailor amenities and listing descriptions to appeal to the dominant Post-2000s (Gen Z/Alpha) demographic (e.g., highlight fast WiFi, smart home features, local guides).
- Highlight unique local experiences or amenities relevant to the primary guest profile.
- Consider seasonal promotions aligned with peak travel times for key origin markets.
Nearby Short-Term Rental Market Comparison
How does the Annan Airbnb market stack up against its neighbors? Compare key performance metrics like average monthly revenue, ADR, and occupancy rates in surrounding areas to understand the broader regional STR landscape.
| Market | Active Properties | Monthly Revenue | Daily Rate | Avg. Occupancy |
|---|---|---|---|---|
| Galston | 11 | $7,951 | $676.77 | 46% |
| Gorebridge | 12 | $6,209 | $493.62 | 54% |
| Cartmel Fell | 17 | $4,719 | $331.68 | 52% |
| Casterton | 11 | $4,578 | $300.82 | 51% |
| Cark | 11 | $4,540 | $885.21 | 31% |
| City of Edinburgh | 4,312 | $4,528 | $274.67 | 61% |
| Eglwys-bach | 16 | $4,413 | $315.23 | 52% |
| Waverton | 16 | $4,358 | $444.20 | 33% |
| Watermillock | 16 | $4,281 | $274.03 | 50% |
| Kielder | 12 | $4,215 | $329.21 | 53% |