Aboyne Airbnb Market Analysis 2025: Short Term Rental Data & Vacation Rental Statistics in Scotland, United Kingdom
Is Airbnb profitable in Aboyne in 2025? Explore comprehensive Airbnb analytics for Aboyne, Scotland, United Kingdom to uncover income potential. This 2025 STR market report for Aboyne, based on AirROI data from April 2024 to March 2025, reveals key trends in the niche market of 23 active listings.
Whether you're considering an Airbnb investment in Aboyne, optimizing your existing vacation rental, or exploring rental arbitrage opportunities, understanding the Aboyne Airbnb data is crucial. Understanding the local regulations is key to maximizing your short term rental income potential. Let's dive into the specifics.
Key Aboyne Airbnb Performance Metrics Overview
Monthly Airbnb Revenue Variations & Income Potential in Aboyne (2025)
Understanding the monthly revenue variations for Airbnb listings in Aboyne is key to maximizing your short term rental income potential. Seasonality significantly impacts earnings. Our analysis, based on data from the past 12 months, shows that the peak revenue month for STRs in Aboyne is typically August, while February often presents the lowest earnings, highlighting opportunities for strategic pricing adjustments during shoulder and low seasons. Explore the typical Airbnb income in Aboyne across different performance tiers:
- Best-in-class properties (Top 10%) achieve $5,126+ monthly, often utilizing dynamic pricing and superior guest experiences.
- Strong performing properties (Top 25%) earn $3,193 or more, indicating effective management and desirable locations/amenities.
- Typical properties (Median) generate around $1,744 per month, representing the average market performance.
- Entry-level properties (Bottom 25%) see earnings around $1,088, often with potential for optimization.
Average Monthly Airbnb Earnings Trend in Aboyne
Aboyne Airbnb Occupancy Rate Trends (2025)
Maximize your bookings by understanding the Aboyne STR occupancy trends. Seasonal demand shifts significantly influence how often properties are booked. Typically, Augustsees the highest demand (peak season occupancy), while February experiences the lowest (low season). Effective strategies, like adjusting minimum stays or offering promotions, can boost occupancy during slower periods. Here's how different property tiers perform in Aboyne:
- Best-in-class properties (Top 10%) achieve 82%+ occupancy, indicating high desirability and potentially optimized availability.
- Strong performing properties (Top 25%) maintain 63% or higher occupancy, suggesting good market fit and guest satisfaction.
- Typical properties (Median) have an occupancy rate around 41%.
- Entry-level properties (Bottom 25%) average 25% occupancy, potentially facing higher vacancy.
Average Monthly Occupancy Rate Trend in Aboyne
Average Daily Rate (ADR) Airbnb Trends in Aboyne (2025)
Effective short term rental pricing strategy in Aboyne involves understanding monthly ADR fluctuations. The Average Daily Rate (ADR) for Airbnb in Aboyne typically peaks in July and dips lowest during March. Leveraging Airbnb dynamic pricing tools or strategies based on this seasonality can significantly boost revenue. Here's a look at the typical nightly rates achieved:
- Best-in-class properties (Top 10%) command rates of $317+ per night, often due to premium features or locations.
- Strong performing properties (Top 25%) achieve nightly rates of $246 or more.
- Typical properties (Median) charge around $161 per night.
- Entry-level properties (Bottom 25%) earn around $106 per night.
Average Daily Rate (ADR) Trend by Month in Aboyne
Get Live Aboyne Market Intelligence 👇

Explore Real-time Analytics
Airbnb Seasonality Analysis & Trends in Aboyne (2025)
Peak Season (August, July, September)
- Revenue averages $3,515 per month
- Occupancy rates average 62.4%
- Daily rates average $217
Shoulder Season
- Revenue averages $2,292 per month
- Occupancy maintains around 42.6%
- Daily rates hold near $212
Low Season (January, February, March)
- Revenue drops to average $1,590 per month
- Occupancy decreases to average 32.0%
- Daily rates adjust to average $201
Seasonality Insights for Aboyne
- The Airbnb seasonality in Aboyne shows highly seasonal trends requiring careful strategy. While the sections above show seasonal averages, it's also insightful to look at the extremes:
- During the high season, the absolute peak month showcases Aboyne's highest earning potential, with monthly revenues capable of climbing to $4,022, occupancy reaching a high of 69.6%, and ADRs peaking at $221.
- Conversely, the slowest single month of the year, typically falling within the low season, marks the market's lowest point. In this month, revenue might dip to $1,384, occupancy could drop to 27.5%, and ADRs may adjust down to $200.
- Understanding both the seasonal averages and these monthly peaks and troughs in revenue, occupancy, and ADR is crucial for maximizing your Airbnb profit potential in Aboyne.
Seasonal Strategies for Maximizing Profit
- Peak Season: Maximize revenue through premium pricing and potentially longer minimum stays. Ensure high availability.
- Low Season: Offer competitive pricing, special promotions (e.g., extended stay discounts), and flexible cancellation policies. Target off-season travelers like remote workers or budget-conscious guests.
- Shoulder Seasons: Implement dynamic pricing that balances peak and low rates. Target weekend travelers or specific events. Offer slightly more flexible terms than peak season.
- Regularly analyze your own performance against these Aboyne seasonality benchmarks and adjust your pricing and availability strategy accordingly.
Best Areas for Airbnb Investment in Aboyne (2025)
Exploring the top neighborhoods for short-term rentals in Aboyne? This section highlights key areas, outlining why they are attractive for hosts and guests, along with notable local attractions. Consider these locations based on your target guest profile and investment strategy.
| Neighborhood / Area | Why Host Here? (Target Guests & Appeal) | Key Attractions & Landmarks |
|---|---|---|
| Aboyne Village | Charming village atmosphere with access to local shops, cafes, and beautiful countryside. Perfect for families and couples looking for a peaceful getaway in the Highlands. | Aboyne Castle, Deeside Golf Club, Aboyne Water, Royal Deeside, Aboyne Highland Games |
| Loch Muick | Stunning natural scenery and great outdoor activities. Ideal for nature lovers, hikers, and those wanting to escape city life, with picturesque views and trails. | Loch Muick, Cairngorms National Park, Walking trails, Wildlife watching, Photography opportunities |
| Braemar | Historic village known for its connection to the royal family and stunning landscapes. Attracts tourists interested in history, culture, and outdoor activities. | Braemar Castle, Royal Deeside, The Highland Games, Walking and hiking trails, The Fife Arms Hotel |
| Ballater | Quaint village with a rich history and stunning scenery. Perfect for tourists looking to explore the Cairngorms and enjoy local hospitality. | Ballater Railway Station, Royal Lochnagar Distillery, Deeside Heritage Centre, Walking trails, Local boutiques |
| Dinnet | Village near Loch Kinord and the Muir of Dinnet National Nature Reserve. Ideal for outdoor activities and wildlife watching, perfect for couples and families. | Muir of Dinnet National Nature Reserve, Loch Kinord, Historical sites, Peaceful walking paths, Nature trails |
| Tarland | A beautiful village close to nature reserves and outdoor attractions. Offers a peaceful environment for families and groups looking for relaxation. | Tarland Oasis, Nature trails, Local festivals, Community events, Nearby historical sites |
| Banchory | Lively town with many amenities, parks, and cultural spots. Popular among tourists and locals, making it ideal for short-term rentals. | Banchory Museum, Drum Castle, Sandy Island, Aboyne and Deeside, Banchory River |
| Kincardine O'Neil | Small village with close proximity to the River Dee and beautiful surroundings. Ideal for those seeking tranquility and a rural experience. | River Dee, Nature walks, Historic sites, Local community events, Scenic countryside |
Understanding Airbnb License Requirements & STR Laws in Aboyne (2025)
With 26% of listings showing registration in 2025, understanding potential Airbnb license requirements is crucial in Aboyne. Always verify the latest short term rental regulations and Airbnb license requirements directly with local government authorities for Aboyne to ensure full compliance before hosting.
(Source: AirROI data, 2025, based on 26% licensed listings)
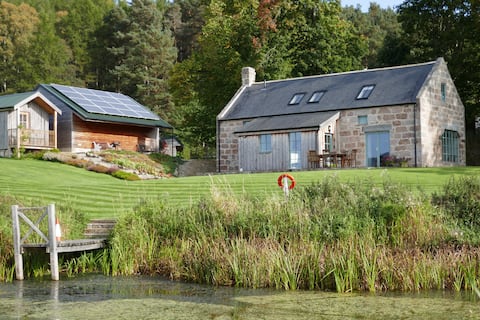
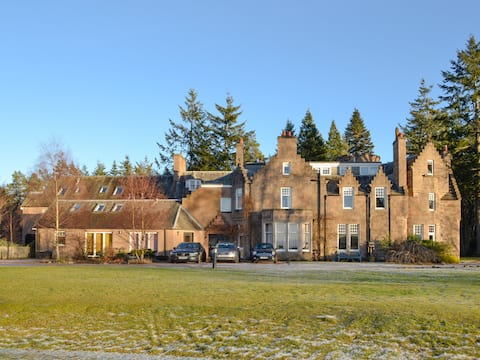
Top Performing Airbnb Properties in Aboyne (2025)
Benchmark your potential! Explore examples of top-performing Airbnb properties in Aboynebased on Trailing Twelve Month (TTM) revenue. Analyze their characteristics, revenue, occupancy rate, and ADR to understand what drives success in this market.
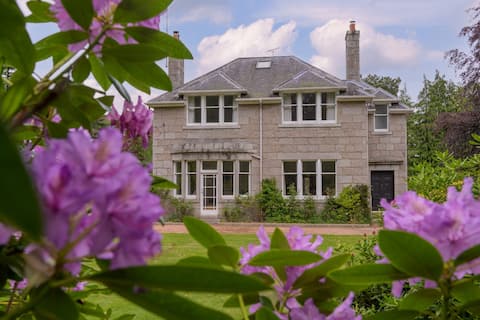
Beautiful large house, idyllic woodland garden
Entire Place • 4 bedrooms

Deeside haven - large garden and river views
Entire Place • 4 bedrooms
A converted mill on the cycle track out of Aboyne
Entire Place • 3 bedrooms
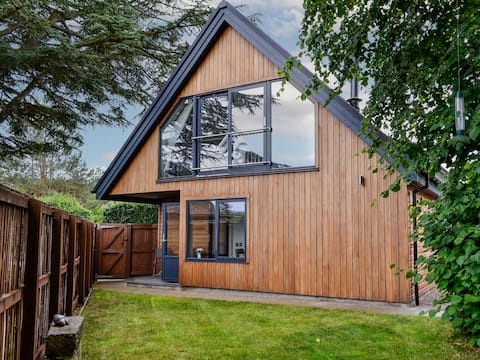
Cedar Cottage
Entire Place • 1 bedroom

The Coo Hoose
Entire Place • 2 bedrooms
Dee Valley View
Entire Place • 2 bedrooms
Note: Performance varies based on location, size, amenities, seasonality, and management quality. Data reflects the past 12 months.
Top Performing Airbnb Hosts in Aboyne (2025)
Learn from the best! This table showcases top-performing Airbnb hosts in Aboyne based on the number of properties managed and estimated total revenue over the past year. Analyze their scale and performance metrics.
| Host Name | Properties | Grossing Revenue | Stay Reviews | Avg Rating |
|---|---|---|---|---|
| Cottages | 3 | $84,901 | 14 | 3.20/5.0 |
| Daniel | 1 | $63,774 | 47 | 4.81/5.0 |
| Gavin | 1 | $45,424 | 40 | 5.00/5.0 |
| Stuart And Val | 1 | $42,488 | 147 | 4.96/5.0 |
| Catriona | 1 | $36,215 | 19 | 5.00/5.0 |
| Vicki | 4 | $35,825 | 553 | 4.70/5.0 |
| Anna | 1 | $28,987 | 143 | 4.97/5.0 |
| Fiona | 1 | $28,961 | 11 | 5.00/5.0 |
| Host #13965608 | 1 | $27,934 | 17 | 5.00/5.0 |
| Morag | 3 | $24,861 | 222 | 4.97/5.0 |
Analyzing the strategies of top hosts, such as their property selection, pricing, and guest communication, can offer valuable lessons for optimizing your own Airbnb operations in Aboyne.
Dive Deeper: Advanced Aboyne STR Market Data (2025)
Ready to unlock more insights? AirROI provides access to advanced metrics and comprehensive Airbnb data for Aboyne. Explore detailed analytics beyond this report to refine your investment strategy, optimize pricing, and maximize your vacation rental profits.
Explore Advanced MetricsAboyne Short-Term Rental Market Composition (2025): Property & Room Types
Room Type Distribution
Property Type Distribution
Market Composition Insights for Aboyne
- The Aboyne Airbnb market composition is heavily skewed towards Entire Home/Apt listings, which make up 87% of the 23 active rentals. This indicates strong guest preference for privacy and space.
- Looking at the property type distribution in Aboyne, House properties are the most common (60.9%), reflecting the local real estate landscape.
- Houses represent a significant 60.9% portion, catering likely to families or larger groups.
- Smaller segments like outdoor/unique (combined 4.3%) offer potential for unique stay experiences.
Aboyne Airbnb Room Capacity Analysis (2025): Bedroom Distribution
Distribution of Listings by Number of Bedrooms
Room Capacity Insights for Aboyne
- The dominant room capacity in Aboyne is 1 bedroom listings, making up 43.5% of the market. This suggests a strong demand for properties suitable for couples or solo travelers.
- Together, 1 bedroom and 2 bedrooms properties represent 65.2% of the active Airbnb listings in Aboyne, indicating a high concentration in these sizes.
- A significant 21.7% of listings offer 3+ bedrooms, catering to larger groups and families seeking more space in Aboyne.
Aboyne Vacation Rental Guest Capacity Trends (2025)
Distribution of Listings by Guest Capacity
Guest Capacity Insights for Aboyne
- The most common guest capacity trend in Aboyne vacation rentals is listings accommodating 2 guests (34.8%). This suggests the primary traveler segment is likely couples or solo travelers.
- Properties designed for 2 guests and 4 guests dominate the Aboyne STR market, accounting for 60.9% of listings.
- 21.6% of properties accommodate 6+ guests, serving the market segment for larger families or group travel in Aboyne.
- On average, properties in Aboyne are equipped to host 3.3 guests.
Aboyne Airbnb Booking Patterns (2025): Available vs. Booked Days
Available Days Distribution
Booked Days Distribution
Booking Pattern Insights for Aboyne
- The most common availability pattern in Aboyne falls within the 181-270 days range, representing 52.2% of listings. This suggests many properties have significant open periods on their calendars.
- Approximately 78.3% of listings show high availability (181+ days open annually), indicating potential for increased bookings or specific owner usage patterns.
- For booked days, the 91-180 days range is most frequent in Aboyne (52.2%), reflecting common guest stay durations or potential owner blocking patterns.
- A notable 21.7% of properties secure long booking periods (181+ days booked per year), highlighting successful long-term rental strategies or significant owner usage.
Aboyne Airbnb Minimum Stay Requirements Analysis
Distribution of Listings by Minimum Night Requirement
1 Night
2 listings
9.5% of total
2 Nights
6 listings
28.6% of total
3 Nights
3 listings
14.3% of total
4-6 Nights
4 listings
19% of total
7-29 Nights
2 listings
9.5% of total
30+ Nights
4 listings
19% of total
Key Insights
- The most prevalent minimum stay requirement in Aboyne is 2 Nights, adopted by 28.6% of listings. This highlights the market's preference for shorter, flexible bookings.
- A significant segment (19%) caters to monthly stays (30+ nights) in Aboyne, pointing to opportunities in the extended-stay market.
Recommendations
- Align with the market by considering a 2 Nights minimum stay, as 28.6% of Aboyne hosts use this setting.
- If feasible, allowing 1-night stays, especially midweek or during low season, could capture last-minute bookings, as only 9.5% currently do.
- Explore offering discounts for stays of 30+ nights to attract the 19% of the market seeking extended stays.
- Adjust minimum nights based on seasonality – potentially shorter during low season and longer during peak demand periods in Aboyne.
Aboyne Airbnb Cancellation Policy Trends Analysis (2025)
Super Strict 60 Days
2 listings
9.5% of total
Flexible
3 listings
14.3% of total
Moderate
3 listings
14.3% of total
Firm
3 listings
14.3% of total
Strict
10 listings
47.6% of total
Cancellation Policy Insights for Aboyne
- The prevailing Airbnb cancellation policy trend in Aboyne is Strict, used by 47.6% of listings.
- A majority (61.9%) of hosts in Aboyne utilize Firm or Strict policies, indicating a market where hosts prioritize booking security.
Recommendations for Hosts
- Consider adopting a Strict policy to align with the 47.6% market standard in Aboyne.
- With 47.6% using Strict terms, this is a viable option in Aboyne, particularly for high-value properties or during peak demand periods.
- Regularly review your cancellation policy against competitors and market demand shifts in Aboyne.
Aboyne STR Booking Lead Time Analysis (2025)
Average Booking Lead Time by Month
Booking Lead Time Insights for Aboyne
- The overall average booking lead time for vacation rentals in Aboyne is 71 days.
- Guests book furthest in advance for stays during July (average 91 days), likely coinciding with peak travel demand or local events.
- The shortest booking windows occur for stays in November (average 28 days), indicating more last-minute travel plans during this time.
- Seasonally, Summer (86 days avg.) sees the longest lead times, while Winter (45 days avg.) has the shortest, reflecting typical travel planning cycles.
Recommendations for Hosts
- Use the overall average lead time (71 days) as a baseline for your pricing and availability strategy in Aboyne.
- For July stays, consider implementing length-of-stay discounts or slightly higher rates for bookings made less than 91 days out to capitalize on advance planning.
- Target marketing efforts for the Summer season well in advance (at least 86 days) to capture early planners.
- Monitor your own booking lead times against these Aboyne averages to identify opportunities for dynamic pricing adjustments.
Popular & Essential Airbnb Amenities in Aboyne (2025)
Amenity Prevalence
Amenity Insights for Aboyne
- Essential amenities in Aboyne that guests expect include: Smoke alarm, Wifi, Heating, Bed linens, TV. Lacking these (any) could significantly impact bookings.
- Popular amenities like Essentials, Free parking on premises, Hot water are common but not universal. Offering these can provide a competitive edge.
Recommendations for Hosts
- Ensure your listing includes all essential amenities for Aboyne: Smoke alarm, Wifi, Heating, Bed linens, TV.
- Prioritize adding missing essentials: Bed linens, TV.
- Consider adding popular differentiators like Essentials or Free parking on premises to increase appeal.
- Highlight unique or less common amenities you offer (e.g., hot tub, dedicated workspace, EV charger) in your listing description and photos.
- Regularly check competitor amenities in Aboyne to stay competitive.
Aboyne Airbnb Guest Demographics & Profile Analysis (2025)
Guest Profile Summary for Aboyne
- The typical guest profile for Airbnb in Aboyne consists of a mix of domestic (64%) and international guests, often arriving from nearby Edinburgh, typically belonging to the Post-2000s (Gen Z/Alpha) group (50%), primarily speaking English or German.
- Domestic travelers account for 64.0% of guests.
- Key international markets include United Kingdom (64%) and United States (10.7%).
- Top languages spoken are English (55.8%) followed by German (12.5%).
- A significant demographic segment is the Post-2000s (Gen Z/Alpha) group, representing 50% of guests.
Recommendations for Hosts
- Target domestic marketing efforts towards travelers from Edinburgh and England.
- Tailor amenities and listing descriptions to appeal to the dominant Post-2000s (Gen Z/Alpha) demographic (e.g., highlight fast WiFi, smart home features, local guides).
- Highlight unique local experiences or amenities relevant to the primary guest profile.
- Consider seasonal promotions aligned with peak travel times for key origin markets.
Nearby Short-Term Rental Market Comparison
How does the Aboyne Airbnb market stack up against its neighbors? Compare key performance metrics like average monthly revenue, ADR, and occupancy rates in surrounding areas to understand the broader regional STR landscape.
| Market | Active Properties | Monthly Revenue | Daily Rate | Avg. Occupancy |
|---|---|---|---|---|
| Bridge of Cally | 16 | $5,839 | $566.24 | 50% |
| Kenmore | 10 | $4,507 | $430.34 | 41% |
| Insh | 14 | $4,473 | $289.96 | 63% |
| Auchtermuchty | 11 | $3,979 | $365.72 | 50% |
| Gleneagles | 10 | $3,964 | $284.15 | 45% |
| Leuchars | 16 | $3,949 | $400.90 | 43% |
| St Andrews | 359 | $3,908 | $373.13 | 50% |
| North Berwick | 94 | $3,893 | $330.02 | 52% |
| Gilmerton | 10 | $3,872 | $440.47 | 35% |
| Mount Melville | 15 | $3,842 | $264.66 | 46% |