Aberlour Airbnb Market Analysis 2025: Short Term Rental Data & Vacation Rental Statistics in Scotland, United Kingdom
Is Airbnb profitable in Aberlour in 2025? Explore comprehensive Airbnb analytics for Aberlour, Scotland, United Kingdom to uncover income potential. This 2025 STR market report for Aberlour, based on AirROI data from April 2024 to March 2025, reveals key trends in the niche market of 22 active listings.
Whether you're considering an Airbnb investment in Aberlour, optimizing your existing vacation rental, or exploring rental arbitrage opportunities, understanding the Aberlour Airbnb data is crucial. Understanding the local regulations is key to maximizing your short term rental income potential. Let's dive into the specifics.
Key Aberlour Airbnb Performance Metrics Overview
Monthly Airbnb Revenue Variations & Income Potential in Aberlour (2025)
Understanding the monthly revenue variations for Airbnb listings in Aberlour is key to maximizing your short term rental income potential. Seasonality significantly impacts earnings. Our analysis, based on data from the past 12 months, shows that the peak revenue month for STRs in Aberlour is typically August, while March often presents the lowest earnings, highlighting opportunities for strategic pricing adjustments during shoulder and low seasons. Explore the typical Airbnb income in Aberlour across different performance tiers:
- Best-in-class properties (Top 10%) achieve $6,862+ monthly, often utilizing dynamic pricing and superior guest experiences.
- Strong performing properties (Top 25%) earn $4,608 or more, indicating effective management and desirable locations/amenities.
- Typical properties (Median) generate around $2,961 per month, representing the average market performance.
- Entry-level properties (Bottom 25%) see earnings around $1,974, often with potential for optimization.
Average Monthly Airbnb Earnings Trend in Aberlour
Aberlour Airbnb Occupancy Rate Trends (2025)
Maximize your bookings by understanding the Aberlour STR occupancy trends. Seasonal demand shifts significantly influence how often properties are booked. Typically, Septembersees the highest demand (peak season occupancy), while March experiences the lowest (low season). Effective strategies, like adjusting minimum stays or offering promotions, can boost occupancy during slower periods. Here's how different property tiers perform in Aberlour:
- Best-in-class properties (Top 10%) achieve 88%+ occupancy, indicating high desirability and potentially optimized availability.
- Strong performing properties (Top 25%) maintain 74% or higher occupancy, suggesting good market fit and guest satisfaction.
- Typical properties (Median) have an occupancy rate around 59%.
- Entry-level properties (Bottom 25%) average 37% occupancy, potentially facing higher vacancy.
Average Monthly Occupancy Rate Trend in Aberlour
Average Daily Rate (ADR) Airbnb Trends in Aberlour (2025)
Effective short term rental pricing strategy in Aberlour involves understanding monthly ADR fluctuations. The Average Daily Rate (ADR) for Airbnb in Aberlour typically peaks in July and dips lowest during March. Leveraging Airbnb dynamic pricing tools or strategies based on this seasonality can significantly boost revenue. Here's a look at the typical nightly rates achieved:
- Best-in-class properties (Top 10%) command rates of $318+ per night, often due to premium features or locations.
- Strong performing properties (Top 25%) achieve nightly rates of $223 or more.
- Typical properties (Median) charge around $158 per night.
- Entry-level properties (Bottom 25%) earn around $118 per night.
Average Daily Rate (ADR) Trend by Month in Aberlour
Get Live Aberlour Market Intelligence 👇

Explore Real-time Analytics
Airbnb Seasonality Analysis & Trends in Aberlour (2025)
Peak Season (August, September, October)
- Revenue averages $4,452 per month
- Occupancy rates average 73.5%
- Daily rates average $196
Shoulder Season
- Revenue averages $3,641 per month
- Occupancy maintains around 57.0%
- Daily rates hold near $194
Low Season (January, February, March)
- Revenue drops to average $2,362 per month
- Occupancy decreases to average 37.6%
- Daily rates adjust to average $186
Seasonality Insights for Aberlour
- The Airbnb seasonality in Aberlour shows highly seasonal trends requiring careful strategy. While the sections above show seasonal averages, it's also insightful to look at the extremes:
- During the high season, the absolute peak month showcases Aberlour's highest earning potential, with monthly revenues capable of climbing to $4,615, occupancy reaching a high of 80.5%, and ADRs peaking at $199.
- Conversely, the slowest single month of the year, typically falling within the low season, marks the market's lowest point. In this month, revenue might dip to $2,071, occupancy could drop to 33.0%, and ADRs may adjust down to $186.
- Understanding both the seasonal averages and these monthly peaks and troughs in revenue, occupancy, and ADR is crucial for maximizing your Airbnb profit potential in Aberlour.
Seasonal Strategies for Maximizing Profit
- Peak Season: Maximize revenue through premium pricing and potentially longer minimum stays. Ensure high availability.
- Low Season: Offer competitive pricing, special promotions (e.g., extended stay discounts), and flexible cancellation policies. Target off-season travelers like remote workers or budget-conscious guests.
- Shoulder Seasons: Implement dynamic pricing that balances peak and low rates. Target weekend travelers or specific events. Offer slightly more flexible terms than peak season.
- Regularly analyze your own performance against these Aberlour seasonality benchmarks and adjust your pricing and availability strategy accordingly.
Best Areas for Airbnb Investment in Aberlour (2025)
Exploring the top neighborhoods for short-term rentals in Aberlour? This section highlights key areas, outlining why they are attractive for hosts and guests, along with notable local attractions. Consider these locations based on your target guest profile and investment strategy.
| Neighborhood / Area | Why Host Here? (Target Guests & Appeal) | Key Attractions & Landmarks |
|---|---|---|
| Aberlour Village | A picturesque village known for its charming buildings, friendly community, and easy access to the Speyside Whisky Trail. Ideal for tourists looking to experience local Scottish culture and whisky distilleries. | Aberlour Distillery, Whisky Trail, Speyside Cooperage, River Spey, Local shops and cafes |
| Speyside | Famous for its whisky production and stunning landscapes, Speyside offers a unique experience for visitors, combining nature and culture. Great spot for nature lovers and whisky enthusiasts alike. | Whisky Distilleries, Findlife Museum, Biodiversity Trails, River Spey |
| Brodick | A charming coastal village on the Isle of Arran, known for its beautiful scenery and outdoor activities. Ideal for tourists looking for a scenic getaway. | Brodick Castle, Arran Heritage Museum, Local beaches, Hiking trails |
| Grantown-on-Spey | A quaint market town on the River Spey, popular for its outdoor activities and traditional Scottish architecture. Great for families and outdoor adventurers. | Grantown Museum, The Spey Trail, Local parks, Golf courses |
| Elgin | The administrative and commercial center of Moray, offering historical sites, shopping, and dining. Perfect for visitors seeking a mix of urban conveniences and historical attractions. | Elgin Cathedral, Elgin Museum, Local shopping district, Cooper Park |
| Lossiemouth | A coastal town with beautiful beaches and a strong maritime history. Attracts beachgoers and history buffs alike. | Lossiemouth East Beach, Lossiemouth West Beach, Local fish and chips shops, Moray Golf Club |
| Forres | Rich in history and surrounded by natural beauty, Forres offers visitors a glimpse of classic Scottish town life and access to beautiful parks. | Sueno's Stone, Forres Community Woodland, Local shops, Brodie Castle |
| Ballindalloch | Known for its stunning landscapes and outdoor activities, Ballindalloch is perfect for those seeking a getaway filled with nature experiences and tranquility. | Ballindalloch Castle, Fishing on the River Spey, Walking trails, Local whisky distilleries |
Understanding Airbnb License Requirements & STR Laws in Aberlour (2025)
With 18% of listings showing registration in 2025, understanding potential Airbnb license requirements is crucial in Aberlour. Always verify the latest short term rental regulations and Airbnb license requirements directly with local government authorities for Aberlour to ensure full compliance before hosting.
(Source: AirROI data, 2025, based on 18% licensed listings)
Top Performing Airbnb Properties in Aberlour (2025)
Benchmark your potential! Explore examples of top-performing Airbnb properties in Aberlourbased on Trailing Twelve Month (TTM) revenue. Analyze their characteristics, revenue, occupancy rate, and ADR to understand what drives success in this market.
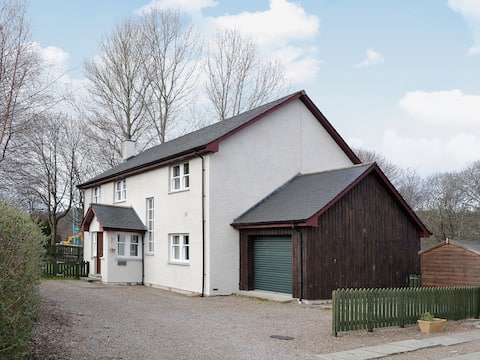
Haugh House
Entire Place • 5 bedrooms
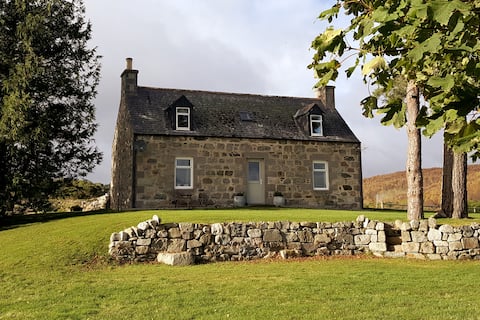
Boutique Speyside Cottage. Whisky Trail & views!
Entire Place • 3 bedrooms
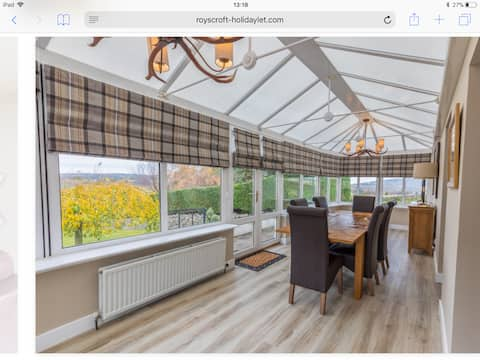
Roy's croft
Entire Place • 3 bedrooms

Luxury Highland Hideaway with Hot Tub
Entire Place • 2 bedrooms
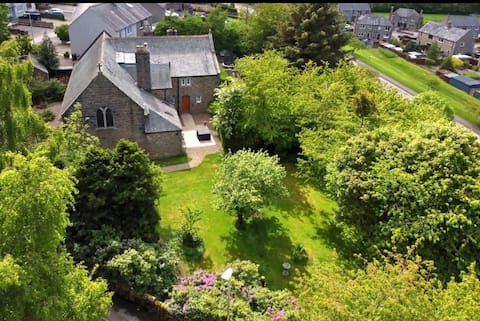
Mount St Mary's
Entire Place • 3 bedrooms
Laundry Cottage on The Spey
Entire Place • 4 bedrooms
Note: Performance varies based on location, size, amenities, seasonality, and management quality. Data reflects the past 12 months.
Top Performing Airbnb Hosts in Aberlour (2025)
Learn from the best! This table showcases top-performing Airbnb hosts in Aberlour based on the number of properties managed and estimated total revenue over the past year. Analyze their scale and performance metrics.
| Host Name | Properties | Grossing Revenue | Stay Reviews | Avg Rating |
|---|---|---|---|---|
| Cottages | 3 | $155,399 | 33 | 4.60/5.0 |
| Yvonne | 1 | $99,527 | 267 | 4.94/5.0 |
| Michelle | 3 | $76,316 | 222 | 4.97/5.0 |
| Marion | 1 | $66,254 | 208 | 4.99/5.0 |
| Claire | 1 | $59,424 | 118 | 4.95/5.0 |
| Catriona | 1 | $56,147 | 29 | 5.00/5.0 |
| Fiona | 1 | $53,216 | 32 | 4.97/5.0 |
| Kate And Mark | 2 | $47,611 | 529 | 4.97/5.0 |
| Eilidh | 1 | $47,418 | 52 | 4.98/5.0 |
| Pru | 1 | $40,429 | 67 | 4.99/5.0 |
Analyzing the strategies of top hosts, such as their property selection, pricing, and guest communication, can offer valuable lessons for optimizing your own Airbnb operations in Aberlour.
Dive Deeper: Advanced Aberlour STR Market Data (2025)
Ready to unlock more insights? AirROI provides access to advanced metrics and comprehensive Airbnb data for Aberlour. Explore detailed analytics beyond this report to refine your investment strategy, optimize pricing, and maximize your vacation rental profits.
Explore Advanced MetricsAberlour Short-Term Rental Market Composition (2025): Property & Room Types
Room Type Distribution
Property Type Distribution
Market Composition Insights for Aberlour
- The Aberlour Airbnb market composition is heavily skewed towards Entire Home/Apt listings, which make up 100% of the 22 active rentals. This indicates strong guest preference for privacy and space.
- Looking at the property type distribution in Aberlour, House properties are the most common (72.7%), reflecting the local real estate landscape.
- Houses represent a significant 72.7% portion, catering likely to families or larger groups.
- Smaller segments like outdoor/unique (combined 4.5%) offer potential for unique stay experiences.
Aberlour Airbnb Room Capacity Analysis (2025): Bedroom Distribution
Distribution of Listings by Number of Bedrooms
Room Capacity Insights for Aberlour
- The dominant room capacity in Aberlour is 3 bedrooms listings, making up 31.8% of the market. This suggests a strong demand for properties suitable for families or small groups.
- Together, 3 bedrooms and 1 bedroom properties represent 59.1% of the active Airbnb listings in Aberlour, indicating a high concentration in these sizes.
- A significant 40.8% of listings offer 3+ bedrooms, catering to larger groups and families seeking more space in Aberlour.
Aberlour Vacation Rental Guest Capacity Trends (2025)
Distribution of Listings by Guest Capacity
Guest Capacity Insights for Aberlour
- The most common guest capacity trend in Aberlour vacation rentals is listings accommodating 6 guests (31.8%). This suggests the primary traveler segment is likely larger groups.
- Properties designed for 6 guests and 2 guests dominate the Aberlour STR market, accounting for 63.6% of listings.
- 40.9% of properties accommodate 6+ guests, serving the market segment for larger families or group travel in Aberlour.
- On average, properties in Aberlour are equipped to host 4.5 guests.
Aberlour Airbnb Booking Patterns (2025): Available vs. Booked Days
Available Days Distribution
Booked Days Distribution
Booking Pattern Insights for Aberlour
- The most common availability pattern in Aberlour falls within the 91-180 days range, representing 59.1% of listings. This suggests many properties have significant open periods on their calendars.
- Approximately 27.3% of listings show high availability (181+ days open annually), indicating potential for increased bookings or specific owner usage patterns.
- For booked days, the 181-270 days range is most frequent in Aberlour (63.6%), reflecting common guest stay durations or potential owner blocking patterns.
- A notable 77.2% of properties secure long booking periods (181+ days booked per year), highlighting successful long-term rental strategies or significant owner usage.
Aberlour Airbnb Minimum Stay Requirements Analysis
Distribution of Listings by Minimum Night Requirement
1 Night
3 listings
13.6% of total
2 Nights
7 listings
31.8% of total
3 Nights
5 listings
22.7% of total
4-6 Nights
3 listings
13.6% of total
30+ Nights
4 listings
18.2% of total
Key Insights
- The most prevalent minimum stay requirement in Aberlour is 2 Nights, adopted by 31.8% of listings. This highlights the market's preference for shorter, flexible bookings.
- A significant segment (18.2%) caters to monthly stays (30+ nights) in Aberlour, pointing to opportunities in the extended-stay market.
Recommendations
- Align with the market by considering a 2 Nights minimum stay, as 31.8% of Aberlour hosts use this setting.
- If feasible, allowing 1-night stays, especially midweek or during low season, could capture last-minute bookings, as only 13.6% currently do.
- A 2-night minimum appears standard (31.8%). Consider this for weekends or peak periods.
- Explore offering discounts for stays of 30+ nights to attract the 18.2% of the market seeking extended stays.
- Adjust minimum nights based on seasonality – potentially shorter during low season and longer during peak demand periods in Aberlour.
Aberlour Airbnb Cancellation Policy Trends Analysis (2025)
Super Strict 60 Days
3 listings
13.6% of total
Flexible
8 listings
36.4% of total
Moderate
3 listings
13.6% of total
Firm
5 listings
22.7% of total
Strict
3 listings
13.6% of total
Cancellation Policy Insights for Aberlour
- The prevailing Airbnb cancellation policy trend in Aberlour is Flexible, used by 36.4% of listings.
- There's a relatively balanced mix between guest-friendly (50.0%) and stricter (36.3%) policies, offering choices for different guest needs.
Recommendations for Hosts
- Consider adopting a Flexible policy to align with the 36.4% market standard in Aberlour.
- Using a Strict policy might deter some guests, as only 13.6% of listings use it. Evaluate if potential revenue protection outweighs possible lower booking rates.
- Regularly review your cancellation policy against competitors and market demand shifts in Aberlour.
Aberlour STR Booking Lead Time Analysis (2025)
Average Booking Lead Time by Month
Booking Lead Time Insights for Aberlour
- The overall average booking lead time for vacation rentals in Aberlour is 76 days.
- Guests book furthest in advance for stays during May (average 148 days), likely coinciding with peak travel demand or local events.
- The shortest booking windows occur for stays in February (average 39 days), indicating more last-minute travel plans during this time.
- Seasonally, Summer (109 days avg.) sees the longest lead times, while Winter (61 days avg.) has the shortest, reflecting typical travel planning cycles.
Recommendations for Hosts
- Use the overall average lead time (76 days) as a baseline for your pricing and availability strategy in Aberlour.
- For May stays, consider implementing length-of-stay discounts or slightly higher rates for bookings made less than 148 days out to capitalize on advance planning.
- Target marketing efforts for the Summer season well in advance (at least 109 days) to capture early planners.
- Monitor your own booking lead times against these Aberlour averages to identify opportunities for dynamic pricing adjustments.
Popular & Essential Airbnb Amenities in Aberlour (2025)
Amenity Prevalence
Amenity Insights for Aberlour
- Essential amenities in Aberlour that guests expect include: Smoke alarm, Wifi, Hangers, Kitchen, Heating, TV, Cooking basics, Fire extinguisher. Lacking these (any) could significantly impact bookings.
- Popular amenities like Bed linens, Free parking on premises are common but not universal. Offering these can provide a competitive edge.
Recommendations for Hosts
- Ensure your listing includes all essential amenities for Aberlour: Smoke alarm, Wifi, Hangers, Kitchen, Heating, TV, Cooking basics, Fire extinguisher.
- Prioritize adding missing essentials: Cooking basics, Fire extinguisher.
- Consider adding popular differentiators like Bed linens or Free parking on premises to increase appeal.
- Highlight unique or less common amenities you offer (e.g., hot tub, dedicated workspace, EV charger) in your listing description and photos.
- Regularly check competitor amenities in Aberlour to stay competitive.
Aberlour Airbnb Guest Demographics & Profile Analysis (2025)
Guest Profile Summary for Aberlour
- The typical guest profile for Airbnb in Aberlour consists of a mix of domestic (57%) and international guests, often arriving from nearby Edinburgh, typically belonging to the Post-2000s (Gen Z/Alpha) group (50%), primarily speaking English or French.
- Domestic travelers account for 56.9% of guests.
- Key international markets include United Kingdom (56.9%) and United States (21.1%).
- Top languages spoken are English (56.8%) followed by French (10.4%).
- A significant demographic segment is the Post-2000s (Gen Z/Alpha) group, representing 50% of guests.
Recommendations for Hosts
- Balance marketing efforts between domestic and international channels based on the guest mix.
- Tailor amenities and listing descriptions to appeal to the dominant Post-2000s (Gen Z/Alpha) demographic (e.g., highlight fast WiFi, smart home features, local guides).
- Highlight unique local experiences or amenities relevant to the primary guest profile.
- Consider seasonal promotions aligned with peak travel times for key origin markets.
Nearby Short-Term Rental Market Comparison
How does the Aberlour Airbnb market stack up against its neighbors? Compare key performance metrics like average monthly revenue, ADR, and occupancy rates in surrounding areas to understand the broader regional STR landscape.
| Market | Active Properties | Monthly Revenue | Daily Rate | Avg. Occupancy |
|---|---|---|---|---|
| Fearnan | 19 | $6,440 | $421.92 | 53% |
| Bridge of Cally | 16 | $5,839 | $566.24 | 50% |
| Kirkhill | 10 | $5,719 | $700.26 | 44% |
| North Kessock | 10 | $5,421 | $380.62 | 58% |
| Foyers | 14 | $5,076 | $274.52 | 64% |
| Arrochar | 33 | $5,045 | $339.11 | 56% |
| Whitebridge | 10 | $4,907 | $417.35 | 42% |
| Acharn | 10 | $4,813 | $278.43 | 57% |
| Croftamie | 19 | $4,609 | $267.39 | 52% |
| Carrick Castle | 11 | $4,591 | $586.01 | 42% |