Stranocum Airbnb Market Analysis 2025: Short Term Rental Data & Vacation Rental Statistics in Northern Ireland, United Kingdom
Is Airbnb profitable in Stranocum in 2025? Explore comprehensive Airbnb analytics for Stranocum, Northern Ireland, United Kingdom to uncover income potential. This 2025 STR market report for Stranocum, based on AirROI data from April 2024 to March 2025, reveals key trends in the niche market of 19 active listings.
Whether you're considering an Airbnb investment in Stranocum, optimizing your existing vacation rental, or exploring rental arbitrage opportunities, understanding the Stranocum Airbnb data is crucial. Leveraging the low regulation environment is key to maximizing your short term rental income potential. Let's dive into the specifics.
Key Stranocum Airbnb Performance Metrics Overview
Monthly Airbnb Revenue Variations & Income Potential in Stranocum (2025)
Understanding the monthly revenue variations for Airbnb listings in Stranocum is key to maximizing your short term rental income potential. Seasonality significantly impacts earnings. Our analysis, based on data from the past 12 months, shows that the peak revenue month for STRs in Stranocum is typically June, while January often presents the lowest earnings, highlighting opportunities for strategic pricing adjustments during shoulder and low seasons. Explore the typical Airbnb income in Stranocum across different performance tiers:
- Best-in-class properties (Top 10%) achieve $3,383+ monthly, often utilizing dynamic pricing and superior guest experiences.
- Strong performing properties (Top 25%) earn $2,073 or more, indicating effective management and desirable locations/amenities.
- Typical properties (Median) generate around $1,212 per month, representing the average market performance.
- Entry-level properties (Bottom 25%) see earnings around $715, often with potential for optimization.
Average Monthly Airbnb Earnings Trend in Stranocum
Stranocum Airbnb Occupancy Rate Trends (2025)
Maximize your bookings by understanding the Stranocum STR occupancy trends. Seasonal demand shifts significantly influence how often properties are booked. Typically, Augustsees the highest demand (peak season occupancy), while January experiences the lowest (low season). Effective strategies, like adjusting minimum stays or offering promotions, can boost occupancy during slower periods. Here's how different property tiers perform in Stranocum:
- Best-in-class properties (Top 10%) achieve 61%+ occupancy, indicating high desirability and potentially optimized availability.
- Strong performing properties (Top 25%) maintain 42% or higher occupancy, suggesting good market fit and guest satisfaction.
- Typical properties (Median) have an occupancy rate around 23%.
- Entry-level properties (Bottom 25%) average 13% occupancy, potentially facing higher vacancy.
Average Monthly Occupancy Rate Trend in Stranocum
Average Daily Rate (ADR) Airbnb Trends in Stranocum (2025)
Effective short term rental pricing strategy in Stranocum involves understanding monthly ADR fluctuations. The Average Daily Rate (ADR) for Airbnb in Stranocum typically peaks in July and dips lowest during February. Leveraging Airbnb dynamic pricing tools or strategies based on this seasonality can significantly boost revenue. Here's a look at the typical nightly rates achieved:
- Best-in-class properties (Top 10%) command rates of $269+ per night, often due to premium features or locations.
- Strong performing properties (Top 25%) achieve nightly rates of $211 or more.
- Typical properties (Median) charge around $169 per night.
- Entry-level properties (Bottom 25%) earn around $108 per night.
Average Daily Rate (ADR) Trend by Month in Stranocum
Get Live Stranocum Market Intelligence 👇

Explore Real-time Analytics
Airbnb Seasonality Analysis & Trends in Stranocum (2025)
Peak Season (June, August, July)
- Revenue averages $2,532 per month
- Occupancy rates average 48.2%
- Daily rates average $176
Shoulder Season
- Revenue averages $1,570 per month
- Occupancy maintains around 24.0%
- Daily rates hold near $170
Low Season (January, February, March)
- Revenue drops to average $919 per month
- Occupancy decreases to average 18.8%
- Daily rates adjust to average $156
Seasonality Insights for Stranocum
- The Airbnb seasonality in Stranocum shows highly seasonal trends requiring careful strategy. While the sections above show seasonal averages, it's also insightful to look at the extremes:
- During the high season, the absolute peak month showcases Stranocum's highest earning potential, with monthly revenues capable of climbing to $2,745, occupancy reaching a high of 54.7%, and ADRs peaking at $177.
- Conversely, the slowest single month of the year, typically falling within the low season, marks the market's lowest point. In this month, revenue might dip to $716, occupancy could drop to 11.3%, and ADRs may adjust down to $154.
- Understanding both the seasonal averages and these monthly peaks and troughs in revenue, occupancy, and ADR is crucial for maximizing your Airbnb profit potential in Stranocum.
Seasonal Strategies for Maximizing Profit
- Peak Season: Maximize revenue through premium pricing and potentially longer minimum stays. Ensure high availability.
- Low Season: Offer competitive pricing, special promotions (e.g., extended stay discounts), and flexible cancellation policies. Target off-season travelers like remote workers or budget-conscious guests.
- Shoulder Seasons: Implement dynamic pricing that balances peak and low rates. Target weekend travelers or specific events. Offer slightly more flexible terms than peak season.
- Regularly analyze your own performance against these Stranocum seasonality benchmarks and adjust your pricing and availability strategy accordingly.
Best Areas for Airbnb Investment in Stranocum (2025)
Exploring the top neighborhoods for short-term rentals in Stranocum? This section highlights key areas, outlining why they are attractive for hosts and guests, along with notable local attractions. Consider these locations based on your target guest profile and investment strategy.
| Neighborhood / Area | Why Host Here? (Target Guests & Appeal) | Key Attractions & Landmarks |
|---|---|---|
| Derry/Londonderry | Historic city known for its well-preserved 17th-century walls and vibrant culture. Attracts tourists for its rich history and cultural festivals. | The London Street Walls, Guildhall, The Peace Bridge, Derry Theatre, Museum of Free Derry |
| Giant's Causeway | Famous natural wonder with unique hexagonal basalt columns. A UNESCO World Heritage Site that attracts tourists from all over the world. | Giant's Causeway Visitor Centre, Walking trails, Giant's Causeway cliffs, Bushmills Distillery |
| Ballycastle | Picturesque coastal town known for its beaches and proximity to the Causeway Coast. Great for nature lovers and those seeking relaxation. | Ballycastle Beach, Carrick-a-Rede Rope Bridge, Ballycastle Golf Club, Fair Head |
| Portrush | Popular seaside resort town with stunning beaches and the famous Royal Portrush Golf Club. Great for water sports and family vacations. | Whiterocks Beach, Portrush Harbour, Barry's Amusements, Royal Portrush Golf Club |
| Cushendun | Charming village that serves as a gateway to the Antrim coast. Known for its beautiful scenery and quaint architecture. | Cushendun Caves, Cushendun Beach, Local shops and cafes, Scenic walks |
| Ballymena | Market town with a good mix of shopping and traditional Irish culture. Central location for exploring Northern Ireland. | Ballymena Market, Ecos Nature Park, Tullymore Forest |
| Antrim | Riverfront town with historical significance and proximity to Antrim Castle. Offers a relaxed atmosphere for visitors. | Antrim Castle Gardens, Lough Neagh Discovery Centre, Antrim Marina |
| Lisburn | Historic city known for its textile industry and rich heritage. Offers both history and modern amenities for visitors. | Lisburn Cathedral, Irish Linen Centre and Museum, Lisburn Leisure Park |
Understanding Airbnb License Requirements & STR Laws in Stranocum (2025)
While Stranocum, Northern Ireland, United Kingdom currently shows low STR regulations, specific Airbnb license requirements might still exist or change. Always verify the latest short term rental regulations and Airbnb license requirements directly with local government authorities for Stranocum to ensure full compliance before hosting.
(Source: AirROI data, 2025, finding no licensed listings among those analyzed)
Top Performing Airbnb Properties in Stranocum (2025)
Benchmark your potential! Explore examples of top-performing Airbnb properties in Stranocumbased on Trailing Twelve Month (TTM) revenue. Analyze their characteristics, revenue, occupancy rate, and ADR to understand what drives success in this market.
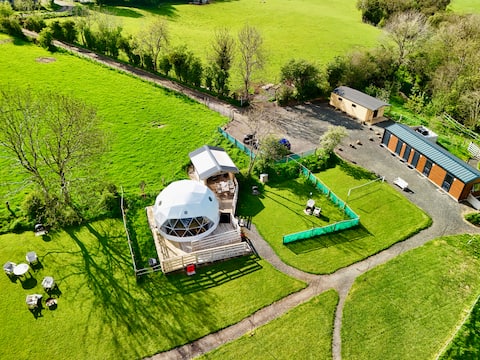
The Birds Nest with hot tub
Entire Place • 1 bedroom
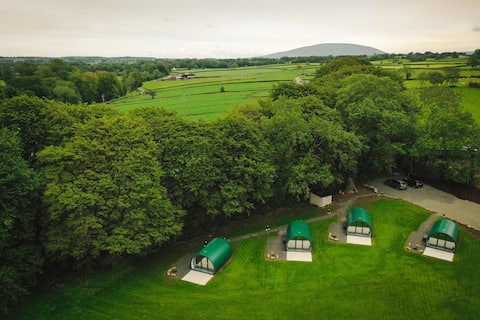
Thornfield Farm Glamping Pod1, Dark Hedges hot tub
Entire Place • 1 bedroom
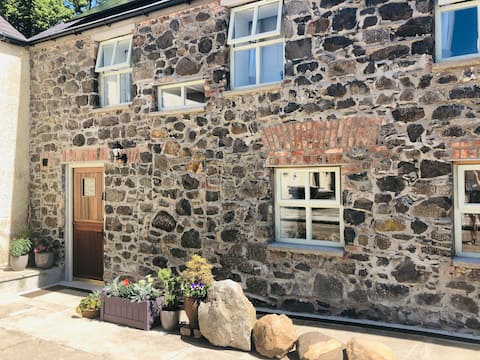
Coachman's Cottage. 18th Century 5 Star Cottage.
Entire Place • 2 bedrooms

Enjoy the famous Dark Hedges at The Yellow Knowe
Entire Place • 2 bedrooms
Thornfield Farm Glamping Pod 4
Entire Place • 2 bedrooms
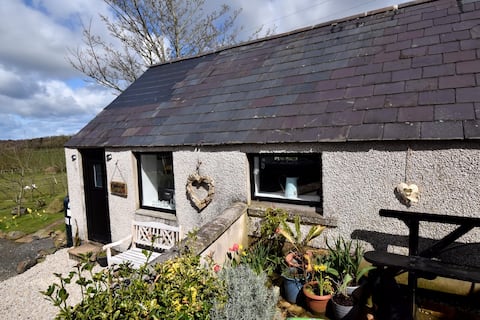
Ashbrook Cottage
Entire Place • 1 bedroom
Note: Performance varies based on location, size, amenities, seasonality, and management quality. Data reflects the past 12 months.
Top Performing Airbnb Hosts in Stranocum (2025)
Learn from the best! This table showcases top-performing Airbnb hosts in Stranocum based on the number of properties managed and estimated total revenue over the past year. Analyze their scale and performance metrics.
| Host Name | Properties | Grossing Revenue | Stay Reviews | Avg Rating |
|---|---|---|---|---|
| Yvonne | 4 | $95,222 | 40 | 5.00/5.0 |
| Sandra | 5 | $80,931 | 15 | 4.00/5.0 |
| Eileen | 1 | $28,304 | 34 | 4.97/5.0 |
| Alison | 1 | $16,855 | 33 | 4.91/5.0 |
| Paul & Laura | 1 | $15,323 | 197 | 4.93/5.0 |
| Elma | 2 | $14,722 | 191 | 4.92/5.0 |
| Michelle | 2 | $13,245 | 296 | 4.96/5.0 |
| Elaine | 1 | $4,936 | 65 | 4.95/5.0 |
| Clare | 1 | $4,271 | 6 | 5.00/5.0 |
| Lyndon | 1 | $737 | 30 | 4.93/5.0 |
Analyzing the strategies of top hosts, such as their property selection, pricing, and guest communication, can offer valuable lessons for optimizing your own Airbnb operations in Stranocum.
Dive Deeper: Advanced Stranocum STR Market Data (2025)
Ready to unlock more insights? AirROI provides access to advanced metrics and comprehensive Airbnb data for Stranocum. Explore detailed analytics beyond this report to refine your investment strategy, optimize pricing, and maximize your vacation rental profits.
Explore Advanced MetricsStranocum Short-Term Rental Market Composition (2025): Property & Room Types
Room Type Distribution
Property Type Distribution
Market Composition Insights for Stranocum
- The Stranocum Airbnb market composition is heavily skewed towards Entire Home/Apt listings, which make up 73.7% of the 19 active rentals. This indicates strong guest preference for privacy and space.
- Looking at the property type distribution in Stranocum, Outdoor/Unique properties are the most common (36.8%), reflecting the local real estate landscape.
- Houses represent a significant 26.3% portion, catering likely to families or larger groups.
- The presence of 5.3% Hotel/Boutique listings indicates integration with traditional hospitality.
Stranocum Airbnb Room Capacity Analysis (2025): Bedroom Distribution
Distribution of Listings by Number of Bedrooms
Room Capacity Insights for Stranocum
- The dominant room capacity in Stranocum is 1 bedroom listings, making up 63.2% of the market. This suggests a strong demand for properties suitable for couples or solo travelers.
- Together, 1 bedroom and 2 bedrooms properties represent 89.5% of the active Airbnb listings in Stranocum, indicating a high concentration in these sizes.
- With over half the market (63.2%) consisting of studios or 1-bedroom units, Stranocum is particularly well-suited for individuals or couples.
Stranocum Vacation Rental Guest Capacity Trends (2025)
Distribution of Listings by Guest Capacity
Guest Capacity Insights for Stranocum
- The most common guest capacity trend in Stranocum vacation rentals is listings accommodating 4 guests (36.8%). This suggests the primary traveler segment is likely small families or groups.
- Properties designed for 4 guests and 2 guests dominate the Stranocum STR market, accounting for 63.1% of listings.
- 15.8% of properties accommodate 6+ guests, serving the market segment for larger families or group travel in Stranocum.
- On average, properties in Stranocum are equipped to host 3.3 guests.
Stranocum Airbnb Booking Patterns (2025): Available vs. Booked Days
Available Days Distribution
Booked Days Distribution
Booking Pattern Insights for Stranocum
- The most common availability pattern in Stranocum falls within the 271-366 days range, representing 57.9% of listings. This suggests many properties have significant open periods on their calendars.
- Approximately 94.7% of listings show high availability (181+ days open annually), indicating potential for increased bookings or specific owner usage patterns.
- For booked days, the 31-90 days range is most frequent in Stranocum (47.4%), reflecting common guest stay durations or potential owner blocking patterns.
- A notable 5.3% of properties secure long booking periods (181+ days booked per year), highlighting successful long-term rental strategies or significant owner usage.
Stranocum Airbnb Minimum Stay Requirements Analysis
Distribution of Listings by Minimum Night Requirement
1 Night
13 listings
76.5% of total
2 Nights
2 listings
11.8% of total
30+ Nights
2 listings
11.8% of total
Key Insights
- The most prevalent minimum stay requirement in Stranocum is 1 Night, adopted by 76.5% of listings. This highlights the market's preference for shorter, flexible bookings.
- A strong majority (88.3%) of the Stranocum Airbnb data shows acceptance of very short stays (1-2 nights), indicating a dynamic, high-turnover market.
- A significant segment (11.8%) caters to monthly stays (30+ nights) in Stranocum, pointing to opportunities in the extended-stay market.
Recommendations
- Align with the market by considering a 1 Night minimum stay, as 76.5% of Stranocum hosts use this setting.
- Explore offering discounts for stays of 30+ nights to attract the 11.8% of the market seeking extended stays.
- Adjust minimum nights based on seasonality – potentially shorter during low season and longer during peak demand periods in Stranocum.
Stranocum Airbnb Cancellation Policy Trends Analysis (2025)
Flexible
2 listings
11.8% of total
Moderate
6 listings
35.3% of total
Firm
4 listings
23.5% of total
Strict
5 listings
29.4% of total
Cancellation Policy Insights for Stranocum
- The prevailing Airbnb cancellation policy trend in Stranocum is Moderate, used by 35.3% of listings.
- A majority (52.9%) of hosts in Stranocum utilize Firm or Strict policies, indicating a market where hosts prioritize booking security.
Recommendations for Hosts
- Consider adopting a Moderate policy to align with the 35.3% market standard in Stranocum.
- Regularly review your cancellation policy against competitors and market demand shifts in Stranocum.
Stranocum STR Booking Lead Time Analysis (2025)
Average Booking Lead Time by Month
Booking Lead Time Insights for Stranocum
- The overall average booking lead time for vacation rentals in Stranocum is 67 days.
- Guests book furthest in advance for stays during December (average 96 days), likely coinciding with peak travel demand or local events.
- The shortest booking windows occur for stays in January (average 19 days), indicating more last-minute travel plans during this time.
- Seasonally, Summer (69 days avg.) sees the longest lead times, while Fall (26 days avg.) has the shortest, reflecting typical travel planning cycles.
Recommendations for Hosts
- Use the overall average lead time (67 days) as a baseline for your pricing and availability strategy in Stranocum.
- For December stays, consider implementing length-of-stay discounts or slightly higher rates for bookings made less than 96 days out to capitalize on advance planning.
- Target marketing efforts for the Summer season well in advance (at least 69 days) to capture early planners.
- Monitor your own booking lead times against these Stranocum averages to identify opportunities for dynamic pricing adjustments.
Popular & Essential Airbnb Amenities in Stranocum (2025)
Amenity Prevalence
Amenity Insights for Stranocum
- Essential amenities in Stranocum that guests expect include: Heating, Wifi. Lacking these (any) could significantly impact bookings.
- Popular amenities like Smoke alarm, Free parking on premises, Hair dryer are common but not universal. Offering these can provide a competitive edge.
Recommendations for Hosts
- Ensure your listing includes all essential amenities for Stranocum: Heating, Wifi.
- Consider adding popular differentiators like Smoke alarm or Free parking on premises to increase appeal.
- Highlight unique or less common amenities you offer (e.g., hot tub, dedicated workspace, EV charger) in your listing description and photos.
- Regularly check competitor amenities in Stranocum to stay competitive.
Stranocum Airbnb Guest Demographics & Profile Analysis (2025)
Guest Profile Summary for Stranocum
- The typical guest profile for Airbnb in Stranocum consists of a mix of domestic (53%) and international guests, often arriving from nearby Belfast, typically belonging to the Post-2000s (Gen Z/Alpha) group (50%), primarily speaking English or Spanish.
- Domestic travelers account for 53.0% of guests.
- Key international markets include United Kingdom (53%) and United States (13.9%).
- Top languages spoken are English (61.3%) followed by Spanish (8.6%).
- A significant demographic segment is the Post-2000s (Gen Z/Alpha) group, representing 50% of guests.
Recommendations for Hosts
- Balance marketing efforts between domestic and international channels based on the guest mix.
- Tailor amenities and listing descriptions to appeal to the dominant Post-2000s (Gen Z/Alpha) demographic (e.g., highlight fast WiFi, smart home features, local guides).
- Highlight unique local experiences or amenities relevant to the primary guest profile.
- Consider seasonal promotions aligned with peak travel times for key origin markets.
Nearby Short-Term Rental Market Comparison
How does the Stranocum Airbnb market stack up against its neighbors? Compare key performance metrics like average monthly revenue, ADR, and occupancy rates in surrounding areas to understand the broader regional STR landscape.
| Market | Active Properties | Monthly Revenue | Daily Rate | Avg. Occupancy |
|---|---|---|---|---|
| Glenachulish | 33 | $5,609 | $424.51 | 46% |
| Corran | 24 | $4,576 | $370.68 | 45% |
| Bruichladdich | 17 | $4,306 | $295.85 | 58% |
| Benderloch | 14 | $4,218 | $364.53 | 55% |
| North Ballachulish | 34 | $4,144 | $288.28 | 47% |
| Glen Nevis | 16 | $4,019 | $251.92 | 58% |
| Inveraray | 23 | $3,909 | $305.07 | 50% |
| Kilmartin | 11 | $3,703 | $359.77 | 34% |
| Glencoe | 36 | $3,583 | $321.78 | 49% |
| Duror | 15 | $3,515 | $230.98 | 59% |