Castlerock Airbnb Market Analysis 2025: Short Term Rental Data & Vacation Rental Statistics in Northern Ireland, United Kingdom
Is Airbnb profitable in Castlerock in 2025? Explore comprehensive Airbnb analytics for Castlerock, Northern Ireland, United Kingdom to uncover income potential. This 2025 STR market report for Castlerock, based on AirROI data from April 2024 to March 2025, reveals key trends in the niche market of 41 active listings.
Whether you're considering an Airbnb investment in Castlerock, optimizing your existing vacation rental, or exploring rental arbitrage opportunities, understanding the Castlerock Airbnb data is crucial. Leveraging the low regulation environment is key to maximizing your short term rental income potential. Let's dive into the specifics.
Key Castlerock Airbnb Performance Metrics Overview
Monthly Airbnb Revenue Variations & Income Potential in Castlerock (2025)
Understanding the monthly revenue variations for Airbnb listings in Castlerock is key to maximizing your short term rental income potential. Seasonality significantly impacts earnings. Our analysis, based on data from the past 12 months, shows that the peak revenue month for STRs in Castlerock is typically August, while March often presents the lowest earnings, highlighting opportunities for strategic pricing adjustments during shoulder and low seasons. Explore the typical Airbnb income in Castlerock across different performance tiers:
- Best-in-class properties (Top 10%) achieve $3,968+ monthly, often utilizing dynamic pricing and superior guest experiences.
- Strong performing properties (Top 25%) earn $3,006 or more, indicating effective management and desirable locations/amenities.
- Typical properties (Median) generate around $2,011 per month, representing the average market performance.
- Entry-level properties (Bottom 25%) see earnings around $1,163, often with potential for optimization.
Average Monthly Airbnb Earnings Trend in Castlerock
Castlerock Airbnb Occupancy Rate Trends (2025)
Maximize your bookings by understanding the Castlerock STR occupancy trends. Seasonal demand shifts significantly influence how often properties are booked. Typically, Augustsees the highest demand (peak season occupancy), while March experiences the lowest (low season). Effective strategies, like adjusting minimum stays or offering promotions, can boost occupancy during slower periods. Here's how different property tiers perform in Castlerock:
- Best-in-class properties (Top 10%) achieve 79%+ occupancy, indicating high desirability and potentially optimized availability.
- Strong performing properties (Top 25%) maintain 63% or higher occupancy, suggesting good market fit and guest satisfaction.
- Typical properties (Median) have an occupancy rate around 40%.
- Entry-level properties (Bottom 25%) average 23% occupancy, potentially facing higher vacancy.
Average Monthly Occupancy Rate Trend in Castlerock
Average Daily Rate (ADR) Airbnb Trends in Castlerock (2025)
Effective short term rental pricing strategy in Castlerock involves understanding monthly ADR fluctuations. The Average Daily Rate (ADR) for Airbnb in Castlerock typically peaks in July and dips lowest during February. Leveraging Airbnb dynamic pricing tools or strategies based on this seasonality can significantly boost revenue. Here's a look at the typical nightly rates achieved:
- Best-in-class properties (Top 10%) command rates of $321+ per night, often due to premium features or locations.
- Strong performing properties (Top 25%) achieve nightly rates of $208 or more.
- Typical properties (Median) charge around $157 per night.
- Entry-level properties (Bottom 25%) earn around $127 per night.
Average Daily Rate (ADR) Trend by Month in Castlerock
Get Live Castlerock Market Intelligence 👇

Explore Real-time Analytics
Airbnb Seasonality Analysis & Trends in Castlerock (2025)
Peak Season (August, July, May)
- Revenue averages $3,327 per month
- Occupancy rates average 61.7%
- Daily rates average $192
Shoulder Season
- Revenue averages $2,127 per month
- Occupancy maintains around 39.8%
- Daily rates hold near $186
Low Season (January, February, March)
- Revenue drops to average $1,418 per month
- Occupancy decreases to average 29.7%
- Daily rates adjust to average $173
Seasonality Insights for Castlerock
- The Airbnb seasonality in Castlerock shows highly seasonal trends requiring careful strategy. While the sections above show seasonal averages, it's also insightful to look at the extremes:
- During the high season, the absolute peak month showcases Castlerock's highest earning potential, with monthly revenues capable of climbing to $3,596, occupancy reaching a high of 67.7%, and ADRs peaking at $193.
- Conversely, the slowest single month of the year, typically falling within the low season, marks the market's lowest point. In this month, revenue might dip to $1,176, occupancy could drop to 24.4%, and ADRs may adjust down to $172.
- Understanding both the seasonal averages and these monthly peaks and troughs in revenue, occupancy, and ADR is crucial for maximizing your Airbnb profit potential in Castlerock.
Seasonal Strategies for Maximizing Profit
- Peak Season: Maximize revenue through premium pricing and potentially longer minimum stays. Ensure high availability.
- Low Season: Offer competitive pricing, special promotions (e.g., extended stay discounts), and flexible cancellation policies. Target off-season travelers like remote workers or budget-conscious guests.
- Shoulder Seasons: Implement dynamic pricing that balances peak and low rates. Target weekend travelers or specific events. Offer slightly more flexible terms than peak season.
- Regularly analyze your own performance against these Castlerock seasonality benchmarks and adjust your pricing and availability strategy accordingly.
Best Areas for Airbnb Investment in Castlerock (2025)
Exploring the top neighborhoods for short-term rentals in Castlerock? This section highlights key areas, outlining why they are attractive for hosts and guests, along with notable local attractions. Consider these locations based on your target guest profile and investment strategy.
| Neighborhood / Area | Why Host Here? (Target Guests & Appeal) | Key Attractions & Landmarks |
|---|---|---|
| Castlerock Beach | A stunning stretch of sandy beach perfect for sunbathing and watersports. Offers a relaxing atmosphere, making it a favorite among families and beachgoers. | Castlerock Beach, Downhill Demesne, Mussenden Temple, Foyle estuary, Castlerock Golf Club |
| Giant's Causeway | Located nearby, this UNESCO World Heritage Site attracts numerous tourists intrigued by its unique geological formations and stunning coastal scenery. | Giant's Causeway, Visitor Centre, Bushmills, Causeway Coast, Antrim Coast |
| The Old Inn | A historic inn offering cozy accommodations with a traditional Northern Irish charm. A popular spot for tourists seeking a unique local experience. | The Old Inn, Local pubs, Historical sites, Guided tours of the area |
| Portstewart | A charming seaside resort with beautiful sandy beaches and scenic cliffs. Popular with tourists looking for seaside relaxation and exploration. | Portstewart Strand, The Promenade, Restaurants and cafes, Water sports |
| Dunluce Castle | A picturesque castle ruin set on the edge of the sea, it attracts history buffs and those looking for dramatic landscapes to explore. | Dunluce Castle, Scenic cliff walks, Local folklore tours |
| Binevenagh Mountain | Offers breathtaking views of the surrounding countryside and coastline. Great for hiking enthusiasts and nature lovers. | Hiking trails, Binevenagh Forest, Wildlife spotting |
| Coleraine | A bustling market town close to Castlerock, providing access to amenities and local culture. Appeals to visitors looking for a blend of urban and rural experiences. | Coleraine town centre, River Bann, Local markets, Historical sites |
| Portrush | A resort town known for its beaches and golf courses, attracting visitors year-round, particularly during the summer months. | Portrush Beach, Royal Portrush Golf Club, Caves and cliffs, Local entertainment |
Understanding Airbnb License Requirements & STR Laws in Castlerock (2025)
While Castlerock, Northern Ireland, United Kingdom currently shows low STR regulations, specific Airbnb license requirements might still exist or change. Always verify the latest short term rental regulations and Airbnb license requirements directly with local government authorities for Castlerock to ensure full compliance before hosting.
(Source: AirROI data, 2025, finding no licensed listings among those analyzed)
Top Performing Airbnb Properties in Castlerock (2025)
Benchmark your potential! Explore examples of top-performing Airbnb properties in Castlerockbased on Trailing Twelve Month (TTM) revenue. Analyze their characteristics, revenue, occupancy rate, and ADR to understand what drives success in this market.
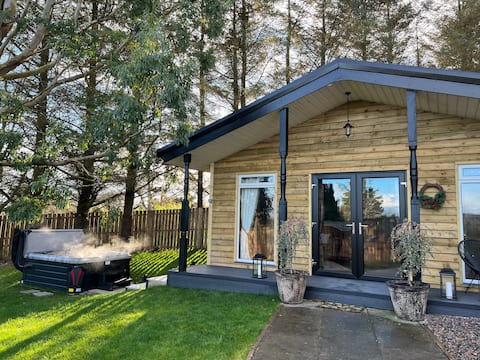
Hunters Glebe Lodge
Entire Place • 1 bedroom
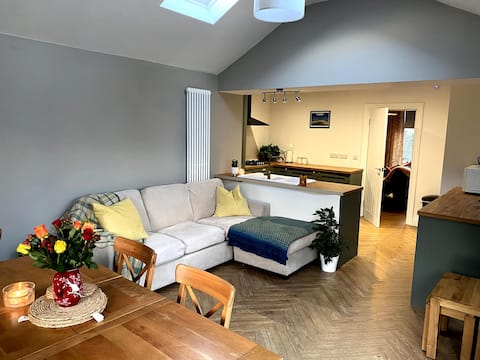
Castlerock cottage,
Entire Place • 3 bedrooms

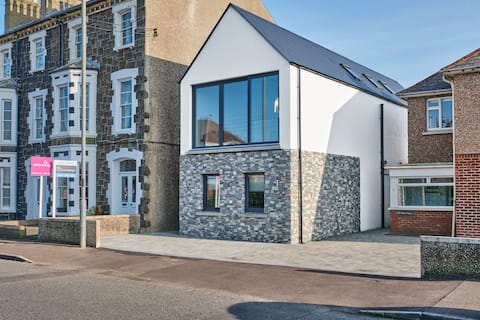
Family Holiday Home Near the Beach
Entire Place • 3 bedrooms
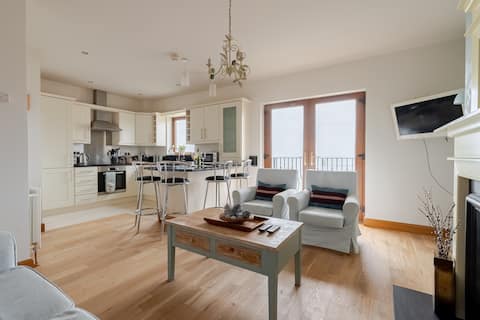
Luxury, Coastal, Cool in Castlerock
Entire Place • 2 bedrooms

Hunters Glebe Lodge Country Apt
Entire Place • 2 bedrooms
Beautiful coastal apt with spectacular views.
Entire Place • 2 bedrooms
Note: Performance varies based on location, size, amenities, seasonality, and management quality. Data reflects the past 12 months.
Top Performing Airbnb Hosts in Castlerock (2025)
Learn from the best! This table showcases top-performing Airbnb hosts in Castlerock based on the number of properties managed and estimated total revenue over the past year. Analyze their scale and performance metrics.
| Host Name | Properties | Grossing Revenue | Stay Reviews | Avg Rating |
|---|---|---|---|---|
| Ciaran | 2 | $86,970 | 39 | 5.00/5.0 |
| Emma | 2 | $50,000 | 25 | 4.87/5.0 |
| Diane | 1 | $44,790 | 28 | 4.93/5.0 |
| Hannah | 1 | $43,225 | 139 | 4.98/5.0 |
| Briege | 1 | $33,856 | 495 | 4.91/5.0 |
| Anita | 1 | $33,215 | 34 | 5.00/5.0 |
| Caroline | 1 | $30,881 | 113 | 4.96/5.0 |
| Nicola | 1 | $29,988 | 150 | 4.96/5.0 |
| Stephen | 1 | $29,360 | 216 | 4.94/5.0 |
| Ashley | 1 | $28,311 | 54 | 4.98/5.0 |
Analyzing the strategies of top hosts, such as their property selection, pricing, and guest communication, can offer valuable lessons for optimizing your own Airbnb operations in Castlerock.
Dive Deeper: Advanced Castlerock STR Market Data (2025)
Ready to unlock more insights? AirROI provides access to advanced metrics and comprehensive Airbnb data for Castlerock. Explore detailed analytics beyond this report to refine your investment strategy, optimize pricing, and maximize your vacation rental profits.
Explore Advanced MetricsCastlerock Short-Term Rental Market Composition (2025): Property & Room Types
Room Type Distribution
Property Type Distribution
Market Composition Insights for Castlerock
- The Castlerock Airbnb market composition is heavily skewed towards Entire Home/Apt listings, which make up 100% of the 41 active rentals. This indicates strong guest preference for privacy and space.
- Looking at the property type distribution in Castlerock, House properties are the most common (56.1%), reflecting the local real estate landscape.
- Houses represent a significant 56.1% portion, catering likely to families or larger groups.
- Smaller segments like unique stays, hotel/boutique (combined 7.3%) offer potential for unique stay experiences.
Castlerock Airbnb Room Capacity Analysis (2025): Bedroom Distribution
Distribution of Listings by Number of Bedrooms
Room Capacity Insights for Castlerock
- The dominant room capacity in Castlerock is 3 bedrooms listings, making up 39% of the market. This suggests a strong demand for properties suitable for families or small groups.
- Together, 3 bedrooms and 1 bedroom properties represent 61.0% of the active Airbnb listings in Castlerock, indicating a high concentration in these sizes.
- A significant 48.8% of listings offer 3+ bedrooms, catering to larger groups and families seeking more space in Castlerock.
Castlerock Vacation Rental Guest Capacity Trends (2025)
Distribution of Listings by Guest Capacity
Guest Capacity Insights for Castlerock
- The most common guest capacity trend in Castlerock vacation rentals is listings accommodating 6 guests (29.3%). This suggests the primary traveler segment is likely larger groups.
- Properties designed for 6 guests and 2 guests dominate the Castlerock STR market, accounting for 51.3% of listings.
- 51.2% of properties accommodate 6+ guests, serving the market segment for larger families or group travel in Castlerock.
- On average, properties in Castlerock are equipped to host 4.9 guests.
Castlerock Airbnb Booking Patterns (2025): Available vs. Booked Days
Available Days Distribution
Booked Days Distribution
Booking Pattern Insights for Castlerock
- The most common availability pattern in Castlerock falls within the 181-270 days range, representing 41.5% of listings. This suggests many properties have significant open periods on their calendars.
- Approximately 70.8% of listings show high availability (181+ days open annually), indicating potential for increased bookings or specific owner usage patterns.
- For booked days, the 91-180 days range is most frequent in Castlerock (39%), reflecting common guest stay durations or potential owner blocking patterns.
- A notable 31.7% of properties secure long booking periods (181+ days booked per year), highlighting successful long-term rental strategies or significant owner usage.
Castlerock Airbnb Minimum Stay Requirements Analysis
Distribution of Listings by Minimum Night Requirement
1 Night
5 listings
12.8% of total
2 Nights
18 listings
46.2% of total
3 Nights
8 listings
20.5% of total
4-6 Nights
7 listings
17.9% of total
30+ Nights
1 listings
2.6% of total
Key Insights
- The most prevalent minimum stay requirement in Castlerock is 2 Nights, adopted by 46.2% of listings. This highlights the market's preference for shorter, flexible bookings.
- Dedicated monthly rentals (30+ nights) represent a small niche (2.6%), possibly an untapped area for hosts.
Recommendations
- Align with the market by considering a 2 Nights minimum stay, as 46.2% of Castlerock hosts use this setting.
- If feasible, allowing 1-night stays, especially midweek or during low season, could capture last-minute bookings, as only 12.8% currently do.
- A 2-night minimum appears standard (46.2%). Consider this for weekends or peak periods.
- Adjust minimum nights based on seasonality – potentially shorter during low season and longer during peak demand periods in Castlerock.
Castlerock Airbnb Cancellation Policy Trends Analysis (2025)
Flexible
2 listings
5.3% of total
Moderate
16 listings
42.1% of total
Firm
10 listings
26.3% of total
Strict
10 listings
26.3% of total
Cancellation Policy Insights for Castlerock
- The prevailing Airbnb cancellation policy trend in Castlerock is Moderate, used by 42.1% of listings.
- A majority (52.6%) of hosts in Castlerock utilize Firm or Strict policies, indicating a market where hosts prioritize booking security.
Recommendations for Hosts
- Consider adopting a Moderate policy to align with the 42.1% market standard in Castlerock.
- Regularly review your cancellation policy against competitors and market demand shifts in Castlerock.
Castlerock STR Booking Lead Time Analysis (2025)
Average Booking Lead Time by Month
Booking Lead Time Insights for Castlerock
- The overall average booking lead time for vacation rentals in Castlerock is 60 days.
- Guests book furthest in advance for stays during July (average 117 days), likely coinciding with peak travel demand or local events.
- The shortest booking windows occur for stays in February (average 33 days), indicating more last-minute travel plans during this time.
- Seasonally, Summer (99 days avg.) sees the longest lead times, while Winter (38 days avg.) has the shortest, reflecting typical travel planning cycles.
Recommendations for Hosts
- Use the overall average lead time (60 days) as a baseline for your pricing and availability strategy in Castlerock.
- For July stays, consider implementing length-of-stay discounts or slightly higher rates for bookings made less than 117 days out to capitalize on advance planning.
- Target marketing efforts for the Summer season well in advance (at least 99 days) to capture early planners.
- Monitor your own booking lead times against these Castlerock averages to identify opportunities for dynamic pricing adjustments.
Popular & Essential Airbnb Amenities in Castlerock (2025)
Amenity Prevalence
Amenity Insights for Castlerock
- Essential amenities in Castlerock that guests expect include: Kitchen, Smoke alarm, Heating, Free parking on premises, TV. Lacking these (any) could significantly impact bookings.
- Popular amenities like Wifi, Hot water, Essentials are common but not universal. Offering these can provide a competitive edge.
- Warning: Wifi is not universally provided but is considered essential globally. Ensure reliable Wifi is offered.
Recommendations for Hosts
- Ensure your listing includes all essential amenities for Castlerock: Kitchen, Smoke alarm, Heating, Free parking on premises, TV.
- Prioritize adding missing essentials: Heating, Free parking on premises, TV.
- Consider adding popular differentiators like Wifi or Hot water to increase appeal.
- Highlight unique or less common amenities you offer (e.g., hot tub, dedicated workspace, EV charger) in your listing description and photos.
- Regularly check competitor amenities in Castlerock to stay competitive.
Castlerock Airbnb Guest Demographics & Profile Analysis (2025)
Guest Profile Summary for Castlerock
- The typical guest profile for Airbnb in Castlerock consists of primarily domestic travelers (66%), often arriving from nearby Belfast, typically belonging to the Post-2000s (Gen Z/Alpha) group (50%), primarily speaking English or French.
- Domestic travelers account for 65.9% of guests.
- Key international markets include United Kingdom (65.9%) and United States (13.2%).
- Top languages spoken are English (69.7%) followed by French (7.6%).
- A significant demographic segment is the Post-2000s (Gen Z/Alpha) group, representing 50% of guests.
Recommendations for Hosts
- Target domestic marketing efforts towards travelers from Belfast and Northern Ireland.
- Tailor amenities and listing descriptions to appeal to the dominant Post-2000s (Gen Z/Alpha) demographic (e.g., highlight fast WiFi, smart home features, local guides).
- Highlight unique local experiences or amenities relevant to the primary guest profile.
- Consider seasonal promotions aligned with peak travel times for key origin markets.
Nearby Short-Term Rental Market Comparison
How does the Castlerock Airbnb market stack up against its neighbors? Compare key performance metrics like average monthly revenue, ADR, and occupancy rates in surrounding areas to understand the broader regional STR landscape.
| Market | Active Properties | Monthly Revenue | Daily Rate | Avg. Occupancy |
|---|---|---|---|---|
| Glenachulish | 33 | $5,609 | $424.51 | 46% |
| Corran | 24 | $4,576 | $370.68 | 45% |
| Bruichladdich | 17 | $4,306 | $295.85 | 58% |
| Benderloch | 14 | $4,218 | $364.53 | 55% |
| North Ballachulish | 34 | $4,144 | $288.28 | 47% |
| Glen Nevis | 16 | $4,019 | $251.92 | 58% |
| Inveraray | 23 | $3,909 | $305.07 | 50% |
| Kilmartin | 11 | $3,703 | $359.77 | 34% |
| Glencoe | 36 | $3,583 | $321.78 | 49% |
| Duror | 15 | $3,515 | $230.98 | 59% |