Carnlough Airbnb Market Analysis 2025: Short Term Rental Data & Vacation Rental Statistics in Northern Ireland, United Kingdom
Is Airbnb profitable in Carnlough in 2025? Explore comprehensive Airbnb analytics for Carnlough, Northern Ireland, United Kingdom to uncover income potential. This 2025 STR market report for Carnlough, based on AirROI data from April 2024 to March 2025, reveals key trends in the niche market of 18 active listings.
Whether you're considering an Airbnb investment in Carnlough, optimizing your existing vacation rental, or exploring rental arbitrage opportunities, understanding the Carnlough Airbnb data is crucial. Leveraging the low regulation environment is key to maximizing your short term rental income potential. Let's dive into the specifics.
Key Carnlough Airbnb Performance Metrics Overview
Monthly Airbnb Revenue Variations & Income Potential in Carnlough (2025)
Understanding the monthly revenue variations for Airbnb listings in Carnlough is key to maximizing your short term rental income potential. Seasonality significantly impacts earnings. Our analysis, based on data from the past 12 months, shows that the peak revenue month for STRs in Carnlough is typically August, while January often presents the lowest earnings, highlighting opportunities for strategic pricing adjustments during shoulder and low seasons. Explore the typical Airbnb income in Carnlough across different performance tiers:
- Best-in-class properties (Top 10%) achieve $3,942+ monthly, often utilizing dynamic pricing and superior guest experiences.
- Strong performing properties (Top 25%) earn $2,624 or more, indicating effective management and desirable locations/amenities.
- Typical properties (Median) generate around $1,575 per month, representing the average market performance.
- Entry-level properties (Bottom 25%) see earnings around $1,020, often with potential for optimization.
Average Monthly Airbnb Earnings Trend in Carnlough
Carnlough Airbnb Occupancy Rate Trends (2025)
Maximize your bookings by understanding the Carnlough STR occupancy trends. Seasonal demand shifts significantly influence how often properties are booked. Typically, Augustsees the highest demand (peak season occupancy), while January experiences the lowest (low season). Effective strategies, like adjusting minimum stays or offering promotions, can boost occupancy during slower periods. Here's how different property tiers perform in Carnlough:
- Best-in-class properties (Top 10%) achieve 64%+ occupancy, indicating high desirability and potentially optimized availability.
- Strong performing properties (Top 25%) maintain 51% or higher occupancy, suggesting good market fit and guest satisfaction.
- Typical properties (Median) have an occupancy rate around 34%.
- Entry-level properties (Bottom 25%) average 22% occupancy, potentially facing higher vacancy.
Average Monthly Occupancy Rate Trend in Carnlough
Average Daily Rate (ADR) Airbnb Trends in Carnlough (2025)
Effective short term rental pricing strategy in Carnlough involves understanding monthly ADR fluctuations. The Average Daily Rate (ADR) for Airbnb in Carnlough typically peaks in July and dips lowest during April. Leveraging Airbnb dynamic pricing tools or strategies based on this seasonality can significantly boost revenue. Here's a look at the typical nightly rates achieved:
- Best-in-class properties (Top 10%) command rates of $230+ per night, often due to premium features or locations.
- Strong performing properties (Top 25%) achieve nightly rates of $189 or more.
- Typical properties (Median) charge around $140 per night.
- Entry-level properties (Bottom 25%) earn around $121 per night.
Average Daily Rate (ADR) Trend by Month in Carnlough
Get Live Carnlough Market Intelligence 👇

Explore Real-time Analytics
Airbnb Seasonality Analysis & Trends in Carnlough (2025)
Peak Season (August, July, June)
- Revenue averages $3,479 per month
- Occupancy rates average 64.2%
- Daily rates average $162
Shoulder Season
- Revenue averages $1,802 per month
- Occupancy maintains around 33.3%
- Daily rates hold near $153
Low Season (January, February, March)
- Revenue drops to average $925 per month
- Occupancy decreases to average 19.4%
- Daily rates adjust to average $158
Seasonality Insights for Carnlough
- The Airbnb seasonality in Carnlough shows highly seasonal trends requiring careful strategy. While the sections above show seasonal averages, it's also insightful to look at the extremes:
- During the high season, the absolute peak month showcases Carnlough's highest earning potential, with monthly revenues capable of climbing to $4,014, occupancy reaching a high of 75.5%, and ADRs peaking at $163.
- Conversely, the slowest single month of the year, typically falling within the low season, marks the market's lowest point. In this month, revenue might dip to $654, occupancy could drop to 8.2%, and ADRs may adjust down to $150.
- Understanding both the seasonal averages and these monthly peaks and troughs in revenue, occupancy, and ADR is crucial for maximizing your Airbnb profit potential in Carnlough.
Seasonal Strategies for Maximizing Profit
- Peak Season: Maximize revenue through premium pricing and potentially longer minimum stays. Ensure high availability.
- Low Season: Offer competitive pricing, special promotions (e.g., extended stay discounts), and flexible cancellation policies. Target off-season travelers like remote workers or budget-conscious guests.
- Shoulder Seasons: Implement dynamic pricing that balances peak and low rates. Target weekend travelers or specific events. Offer slightly more flexible terms than peak season.
- Regularly analyze your own performance against these Carnlough seasonality benchmarks and adjust your pricing and availability strategy accordingly.
Best Areas for Airbnb Investment in Carnlough (2025)
Exploring the top neighborhoods for short-term rentals in Carnlough? This section highlights key areas, outlining why they are attractive for hosts and guests, along with notable local attractions. Consider these locations based on your target guest profile and investment strategy.
| Neighborhood / Area | Why Host Here? (Target Guests & Appeal) | Key Attractions & Landmarks |
|---|---|---|
| Carnlough Harbour | A picturesque harbor town with stunning coastal views, perfect for visitors wanting to enjoy seaside walks and local seafood restaurants. Ideal for families and couples looking for a peaceful getaway. | Carnlough Harbour, Coastal Walks, Carnlough Beach, Local Seafood Restaurants, Scenic Boat Tours, Cave Hill Country Park |
| Antrim Coast Road | Known as one of the most scenic drives in the world, this area attracts tourists for its breathtaking landscapes and proximity to the Giant's Causeway and other natural wonders. | Giant's Causeway, Carrick-a-Rede Rope Bridge, Ballygally Castle, Cushendun Village, White Park Bay |
| Glenariff Forest Park | Famous for its beautiful waterfalls and hiking trails, this park draws nature enthusiasts and adventure seekers looking to explore Northern Ireland's natural beauty. | Glenariff Waterfall, Nature Trails, Picnic Areas, Scenic Views, Local Wildlife |
| Carnlough Village | A charming village with traditional Irish culture, local pubs, and community events. Offers a true taste of Northern Irish life, appealing to those looking for local experiences. | Traditional Pubs, Local Shops, Community Events, Irish Music and Dance, Historic Buildings |
| Ballygally Beach | A lovely beach location for families and couples, known for its soft sands and scenic views. Great for those looking to relax by the sea. | Ballygally Beach, Beachfront Cafés, Seaside Walks, Wedding Photographic Spots |
| Slemish Mountain | Rich in history and folklore, this mountain offers hiking opportunities and is associated with Saint Patrick. It's a unique attraction for those interested in both nature and local history. | Hiking Trails, Historic Significance, Panoramic Views, St. Patrick's Heritage |
| Dunluce Castle | An iconic and picturesque ruin with a rich history, attracting tourists interested in medieval architecture and stunning coastal views. | Dunluce Castle, Historic Tours, Photography Opportunities, Coastal Scenery |
| The Glens of Antrim | A stunning region of valleys, waterfalls, and lush landscapes, perfect for nature lovers and those seeking a tranquil retreat. | Scenic Valleys, Waterfalls, Hiking Trails, Local Wildlife |
Understanding Airbnb License Requirements & STR Laws in Carnlough (2025)
While Carnlough, Northern Ireland, United Kingdom currently shows low STR regulations, specific Airbnb license requirements might still exist or change. Always verify the latest short term rental regulations and Airbnb license requirements directly with local government authorities for Carnlough to ensure full compliance before hosting.
(Source: AirROI data, 2025, finding no licensed listings among those analyzed)
Top Performing Airbnb Properties in Carnlough (2025)
Benchmark your potential! Explore examples of top-performing Airbnb properties in Carnloughbased on Trailing Twelve Month (TTM) revenue. Analyze their characteristics, revenue, occupancy rate, and ADR to understand what drives success in this market.
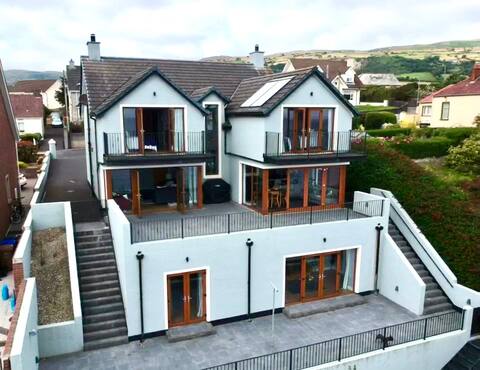
Beautiful, spacious modern home with coastal views
Entire Place • 4 bedrooms

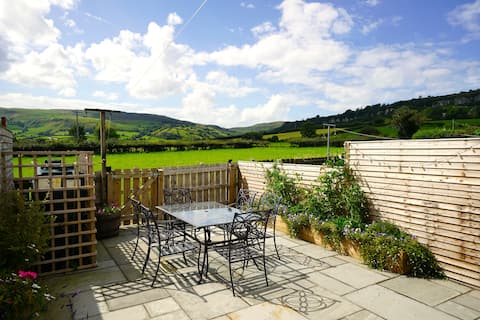
Beach front house in beautiful harbour location
Entire Place • 4 bedrooms

4 * Ned's Brae View in the Glens of Antrim.
Entire Place • 4 bedrooms

Beautiful cottage nestled in coastal village
Entire Place • 3 bedrooms
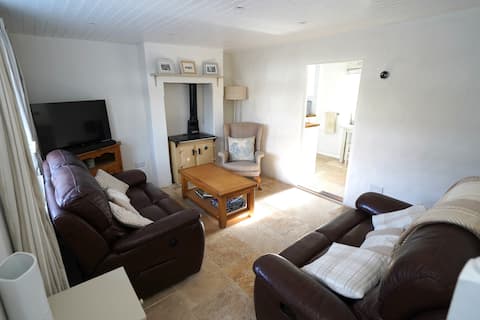
Cranny Cottage Carnlough
Entire Place • 2 bedrooms
Gortnagory Cottage Carnlough
Entire Place • 3 bedrooms
Note: Performance varies based on location, size, amenities, seasonality, and management quality. Data reflects the past 12 months.
Top Performing Airbnb Hosts in Carnlough (2025)
Learn from the best! This table showcases top-performing Airbnb hosts in Carnlough based on the number of properties managed and estimated total revenue over the past year. Analyze their scale and performance metrics.
| Host Name | Properties | Grossing Revenue | Stay Reviews | Avg Rating |
|---|---|---|---|---|
| Host #349340900 | 1 | $57,015 | 117 | 4.97/5.0 |
| Helen | 2 | $55,867 | 100 | 4.98/5.0 |
| Julie | 1 | $35,196 | 65 | 5.00/5.0 |
| Celaine Carmella | 1 | $34,555 | 50 | 4.90/5.0 |
| Roisin | 2 | $29,841 | 100 | 4.70/5.0 |
| Una | 1 | $29,566 | 188 | 4.93/5.0 |
| Kelly | 1 | $24,194 | 13 | 5.00/5.0 |
| Orla | 1 | $21,724 | 5 | 4.80/5.0 |
| Gillian | 2 | $21,349 | 59 | 4.79/5.0 |
| Robert And Tiffany | 1 | $20,493 | 80 | 4.95/5.0 |
Analyzing the strategies of top hosts, such as their property selection, pricing, and guest communication, can offer valuable lessons for optimizing your own Airbnb operations in Carnlough.
Dive Deeper: Advanced Carnlough STR Market Data (2025)
Ready to unlock more insights? AirROI provides access to advanced metrics and comprehensive Airbnb data for Carnlough. Explore detailed analytics beyond this report to refine your investment strategy, optimize pricing, and maximize your vacation rental profits.
Explore Advanced MetricsCarnlough Short-Term Rental Market Composition (2025): Property & Room Types
Room Type Distribution
Property Type Distribution
Market Composition Insights for Carnlough
- The Carnlough Airbnb market composition is heavily skewed towards Entire Home/Apt listings, which make up 94.4% of the 18 active rentals. This indicates strong guest preference for privacy and space.
- Looking at the property type distribution in Carnlough, House properties are the most common (77.8%), reflecting the local real estate landscape.
- Houses represent a significant 77.8% portion, catering likely to families or larger groups.
Carnlough Airbnb Room Capacity Analysis (2025): Bedroom Distribution
Distribution of Listings by Number of Bedrooms
Room Capacity Insights for Carnlough
- The dominant room capacity in Carnlough is 1 bedroom listings, making up 27.8% of the market. This suggests a strong demand for properties suitable for couples or solo travelers.
- Together, 1 bedroom and 3 bedrooms properties represent 55.6% of the active Airbnb listings in Carnlough, indicating a high concentration in these sizes.
- A significant 50.1% of listings offer 3+ bedrooms, catering to larger groups and families seeking more space in Carnlough.
Carnlough Vacation Rental Guest Capacity Trends (2025)
Distribution of Listings by Guest Capacity
Guest Capacity Insights for Carnlough
- The most common guest capacity trend in Carnlough vacation rentals is listings accommodating 8+ guests (22.2%). This suggests the primary traveler segment is likely larger groups.
- Properties designed for 8+ guests and 4 guests dominate the Carnlough STR market, accounting for 38.9% of listings.
- 44.5% of properties accommodate 6+ guests, serving the market segment for larger families or group travel in Carnlough.
- On average, properties in Carnlough are equipped to host 5.1 guests.
Carnlough Airbnb Booking Patterns (2025): Available vs. Booked Days
Available Days Distribution
Booked Days Distribution
Booking Pattern Insights for Carnlough
- The most common availability pattern in Carnlough falls within the 181-270 days range, representing 44.4% of listings. This suggests many properties have significant open periods on their calendars.
- Approximately 83.3% of listings show high availability (181+ days open annually), indicating potential for increased bookings or specific owner usage patterns.
- For booked days, the 91-180 days range is most frequent in Carnlough (55.6%), reflecting common guest stay durations or potential owner blocking patterns.
- A notable 16.7% of properties secure long booking periods (181+ days booked per year), highlighting successful long-term rental strategies or significant owner usage.
Carnlough Airbnb Minimum Stay Requirements Analysis
Distribution of Listings by Minimum Night Requirement
2 Nights
14 listings
77.8% of total
3 Nights
4 listings
22.2% of total
Key Insights
- The most prevalent minimum stay requirement in Carnlough is 2 Nights, adopted by 77.8% of listings. This highlights the market's preference for shorter, flexible bookings.
- A strong majority (77.8%) of the Carnlough Airbnb data shows acceptance of very short stays (1-2 nights), indicating a dynamic, high-turnover market.
Recommendations
- Align with the market by considering a 2 Nights minimum stay, as 77.8% of Carnlough hosts use this setting.
- A 2-night minimum appears standard (77.8%). Consider this for weekends or peak periods.
- Adjust minimum nights based on seasonality – potentially shorter during low season and longer during peak demand periods in Carnlough.
Carnlough Airbnb Cancellation Policy Trends Analysis (2025)
Flexible
4 listings
22.2% of total
Moderate
6 listings
33.3% of total
Firm
7 listings
38.9% of total
Strict
1 listings
5.6% of total
Cancellation Policy Insights for Carnlough
- The prevailing Airbnb cancellation policy trend in Carnlough is Firm, used by 38.9% of listings.
- There's a relatively balanced mix between guest-friendly (55.5%) and stricter (44.5%) policies, offering choices for different guest needs.
- Strict cancellation policies are quite rare (5.6%), potentially making listings with this policy less competitive unless justified by high demand or property type.
Recommendations for Hosts
- Consider adopting a Firm policy to align with the 38.9% market standard in Carnlough.
- Using a Strict policy might deter some guests, as only 5.6% of listings use it. Evaluate if potential revenue protection outweighs possible lower booking rates.
- Regularly review your cancellation policy against competitors and market demand shifts in Carnlough.
Carnlough STR Booking Lead Time Analysis (2025)
Average Booking Lead Time by Month
Booking Lead Time Insights for Carnlough
- The overall average booking lead time for vacation rentals in Carnlough is 77 days.
- Guests book furthest in advance for stays during October (average 114 days), likely coinciding with peak travel demand or local events.
- The shortest booking windows occur for stays in November (average 44 days), indicating more last-minute travel plans during this time.
- Seasonally, Summer (97 days avg.) sees the longest lead times, while Spring (67 days avg.) has the shortest, reflecting typical travel planning cycles.
Recommendations for Hosts
- Use the overall average lead time (77 days) as a baseline for your pricing and availability strategy in Carnlough.
- For October stays, consider implementing length-of-stay discounts or slightly higher rates for bookings made less than 114 days out to capitalize on advance planning.
- Target marketing efforts for the Summer season well in advance (at least 97 days) to capture early planners.
- Monitor your own booking lead times against these Carnlough averages to identify opportunities for dynamic pricing adjustments.
Popular & Essential Airbnb Amenities in Carnlough (2025)
Amenity Prevalence
Amenity Insights for Carnlough
- Essential amenities in Carnlough that guests expect include: Kitchen, Smoke alarm, Wifi. Lacking these (any) could significantly impact bookings.
- Popular amenities like Carbon monoxide alarm, TV, Iron are common but not universal. Offering these can provide a competitive edge.
Recommendations for Hosts
- Ensure your listing includes all essential amenities for Carnlough: Kitchen, Smoke alarm, Wifi.
- Consider adding popular differentiators like Carbon monoxide alarm or TV to increase appeal.
- Highlight unique or less common amenities you offer (e.g., hot tub, dedicated workspace, EV charger) in your listing description and photos.
- Regularly check competitor amenities in Carnlough to stay competitive.
Carnlough Airbnb Guest Demographics & Profile Analysis (2025)
Guest Profile Summary for Carnlough
- The typical guest profile for Airbnb in Carnlough consists of a mix of domestic (64%) and international guests, often arriving from nearby Belfast, typically belonging to the Post-2000s (Gen Z/Alpha) group (50%), primarily speaking English or Spanish.
- Domestic travelers account for 63.6% of guests.
- Key international markets include United Kingdom (63.6%) and Ireland (9.3%).
- Top languages spoken are English (64.9%) followed by Spanish (8.8%).
- A significant demographic segment is the Post-2000s (Gen Z/Alpha) group, representing 50% of guests.
Recommendations for Hosts
- Target domestic marketing efforts towards travelers from Belfast and London.
- Tailor amenities and listing descriptions to appeal to the dominant Post-2000s (Gen Z/Alpha) demographic (e.g., highlight fast WiFi, smart home features, local guides).
- Highlight unique local experiences or amenities relevant to the primary guest profile.
- Consider seasonal promotions aligned with peak travel times for key origin markets.
Nearby Short-Term Rental Market Comparison
How does the Carnlough Airbnb market stack up against its neighbors? Compare key performance metrics like average monthly revenue, ADR, and occupancy rates in surrounding areas to understand the broader regional STR landscape.
| Market | Active Properties | Monthly Revenue | Daily Rate | Avg. Occupancy |
|---|---|---|---|---|
| Galston | 11 | $7,951 | $676.77 | 46% |
| Fearnan | 19 | $6,440 | $421.92 | 53% |
| Glenachulish | 33 | $5,609 | $424.51 | 46% |
| Arrochar | 33 | $5,045 | $339.11 | 56% |
| Acharn | 10 | $4,813 | $278.43 | 57% |
| Croftamie | 19 | $4,609 | $267.39 | 52% |
| Carrick Castle | 11 | $4,591 | $586.01 | 42% |
| Corran | 24 | $4,576 | $370.68 | 45% |
| Gartocharn | 15 | $4,426 | $354.91 | 46% |
| Bruichladdich | 17 | $4,306 | $295.85 | 58% |