Wychavon Airbnb Market Analysis 2025: Short Term Rental Data & Vacation Rental Statistics in England, United Kingdom
Is Airbnb profitable in Wychavon in 2025? Explore comprehensive Airbnb analytics for Wychavon, England, United Kingdom to uncover income potential. This 2025 STR market report for Wychavon, based on AirROI data from April 2024 to March 2025, reveals key trends in the market of 439 active listings.
Whether you're considering an Airbnb investment in Wychavon, optimizing your existing vacation rental, or exploring rental arbitrage opportunities, understanding the Wychavon Airbnb data is crucial. Leveraging the low regulation environment is key to maximizing your short term rental income potential. Let's dive into the specifics.
Key Wychavon Airbnb Performance Metrics Overview
Monthly Airbnb Revenue Variations & Income Potential in Wychavon (2025)
Understanding the monthly revenue variations for Airbnb listings in Wychavon is key to maximizing your short term rental income potential. Seasonality significantly impacts earnings. Our analysis, based on data from the past 12 months, shows that the peak revenue month for STRs in Wychavon is typically August, while February often presents the lowest earnings, highlighting opportunities for strategic pricing adjustments during shoulder and low seasons. Explore the typical Airbnb income in Wychavon across different performance tiers:
- Best-in-class properties (Top 10%) achieve $6,481+ monthly, often utilizing dynamic pricing and superior guest experiences.
- Strong performing properties (Top 25%) earn $4,061 or more, indicating effective management and desirable locations/amenities.
- Typical properties (Median) generate around $2,447 per month, representing the average market performance.
- Entry-level properties (Bottom 25%) see earnings around $1,252, often with potential for optimization.
Average Monthly Airbnb Earnings Trend in Wychavon
Wychavon Airbnb Occupancy Rate Trends (2025)
Maximize your bookings by understanding the Wychavon STR occupancy trends. Seasonal demand shifts significantly influence how often properties are booked. Typically, Augustsees the highest demand (peak season occupancy), while March experiences the lowest (low season). Effective strategies, like adjusting minimum stays or offering promotions, can boost occupancy during slower periods. Here's how different property tiers perform in Wychavon:
- Best-in-class properties (Top 10%) achieve 85%+ occupancy, indicating high desirability and potentially optimized availability.
- Strong performing properties (Top 25%) maintain 68% or higher occupancy, suggesting good market fit and guest satisfaction.
- Typical properties (Median) have an occupancy rate around 45%.
- Entry-level properties (Bottom 25%) average 22% occupancy, potentially facing higher vacancy.
Average Monthly Occupancy Rate Trend in Wychavon
Average Daily Rate (ADR) Airbnb Trends in Wychavon (2025)
Effective short term rental pricing strategy in Wychavon involves understanding monthly ADR fluctuations. The Average Daily Rate (ADR) for Airbnb in Wychavon typically peaks in August and dips lowest during February. Leveraging Airbnb dynamic pricing tools or strategies based on this seasonality can significantly boost revenue. Here's a look at the typical nightly rates achieved:
- Best-in-class properties (Top 10%) command rates of $460+ per night, often due to premium features or locations.
- Strong performing properties (Top 25%) achieve nightly rates of $256 or more.
- Typical properties (Median) charge around $170 per night.
- Entry-level properties (Bottom 25%) earn around $118 per night.
Average Daily Rate (ADR) Trend by Month in Wychavon
Get Live Wychavon Market Intelligence 👇

Explore Real-time Analytics
Airbnb Seasonality Analysis & Trends in Wychavon (2025)
Peak Season (August, May, June)
- Revenue averages $3,984 per month
- Occupancy rates average 51.2%
- Daily rates average $252
Shoulder Season
- Revenue averages $3,508 per month
- Occupancy maintains around 48.0%
- Daily rates hold near $249
Low Season (January, February, March)
- Revenue drops to average $2,504 per month
- Occupancy decreases to average 38.6%
- Daily rates adjust to average $243
Seasonality Insights for Wychavon
- The Airbnb seasonality in Wychavon shows moderate seasonality with distinct peak and low periods. While the sections above show seasonal averages, it's also insightful to look at the extremes:
- During the high season, the absolute peak month showcases Wychavon's highest earning potential, with monthly revenues capable of climbing to $4,013, occupancy reaching a high of 56.0%, and ADRs peaking at $256.
- Conversely, the slowest single month of the year, typically falling within the low season, marks the market's lowest point. In this month, revenue might dip to $2,397, occupancy could drop to 37.4%, and ADRs may adjust down to $240.
- Understanding both the seasonal averages and these monthly peaks and troughs in revenue, occupancy, and ADR is crucial for maximizing your Airbnb profit potential in Wychavon.
Seasonal Strategies for Maximizing Profit
- Peak Season: Maximize revenue through premium pricing and potentially longer minimum stays. Ensure high availability.
- Low Season: Offer competitive pricing, special promotions (e.g., extended stay discounts), and flexible cancellation policies. Target off-season travelers like remote workers or budget-conscious guests.
- Shoulder Seasons: Implement dynamic pricing that balances peak and low rates. Target weekend travelers or specific events. Offer slightly more flexible terms than peak season.
- Regularly analyze your own performance against these Wychavon seasonality benchmarks and adjust your pricing and availability strategy accordingly.
Best Areas for Airbnb Investment in Wychavon (2025)
Exploring the top neighborhoods for short-term rentals in Wychavon? This section highlights key areas, outlining why they are attractive for hosts and guests, along with notable local attractions. Consider these locations based on your target guest profile and investment strategy.
| Neighborhood / Area | Why Host Here? (Target Guests & Appeal) | Key Attractions & Landmarks |
|---|---|---|
| Evesham | A historic market town with beautiful parks and gardens. Popular for its riverside activities and proximity to the Vale of Evesham, attracting tourists and families. | Evesham Abbey, The Almonry Museum, Evesham Arts Centre, The River Avon, Regency Market |
| Droitwich Spa | Known for its saltwater heritage and spa facilities. Attractive for wellness tourists and those seeking a relaxing getaway with access to natural springs. | Droitwich Spa Lido, The Salters, Droitwich Canal, St. Andrews Church, Salt Museum |
| Pershore | A quaint market town with picturesque architecture and a beautiful abbey. Ideal for visitors interested in local culture and rural charm. | Pershore Abbey, The River Avon, Pershore Market, Charlie's Garden, Veasey Park |
| Broadway | A charming village on the edge of the Cotswolds, famous for its historic buildings and vibrant arts scene. Great for visitors looking for a peaceful retreat and scenic beauty. | Broadway Tower, High Street, Gordon Russell Design Museum, The Lygon Arms, Cotswolds Art and Crafts |
| Malvern Hills | Stunning natural landscape famous for hiking and outdoor activities. Appeals to nature lovers and those seeking adventure. | Malvern Hills, The Wireless Hill, Great Malvern Priory, Malvern Theatres, Morgan Motor Company |
| Winchcombe | A historic town with an array of attractions and scenic walks. Popular for heritage tourism and those exploring the Cotswolds. | Sudeley Castle, Winchcombe Railway Walk, Winchcombe Museum, The Church of St. Peter |
| Inkberrow | A charming village with rich history and a peaceful rural atmosphere. Attractive to visitors looking for a quiet escape close to nature. | The Crooked House, Inkberrow Museum, Inkberrow Golf Club, Countryside walks |
| Bromsgrove | A town steeped in history, providing good access to Birmingham and the surrounding area. Popular with business travelers and families alike. | Bromsgrove Museum, Avoncroft Museum of Historic Buildings, Sanders Park, Lickey Hills |
Understanding Airbnb License Requirements & STR Laws in Wychavon (2025)
While Wychavon, England, United Kingdom currently shows low STR regulations, specific Airbnb license requirements might still exist or change. Always verify the latest short term rental regulations and Airbnb license requirements directly with local government authorities for Wychavon to ensure full compliance before hosting.
(Source: AirROI data, 2025, finding no licensed listings among those analyzed)
Top Performing Airbnb Properties in Wychavon (2025)
Benchmark your potential! Explore examples of top-performing Airbnb properties in Wychavonbased on Trailing Twelve Month (TTM) revenue. Analyze their characteristics, revenue, occupancy rate, and ADR to understand what drives success in this market.
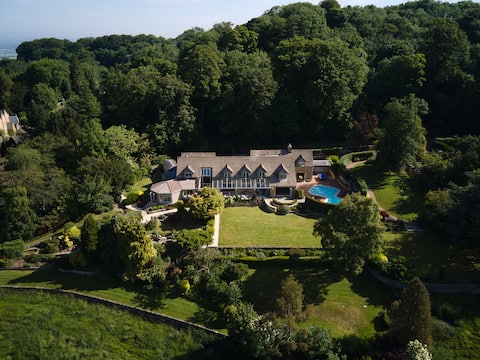
Pye Corner, Cotswold Manor w/outdoor heated pool
Entire Place • 8 bedrooms
Elsker
Entire Place • 8 bedrooms
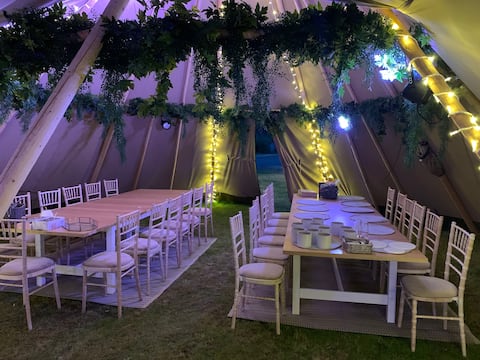
Exclusive tipi and bell tent Cotswold glamp site
Entire Place • 7 bedrooms

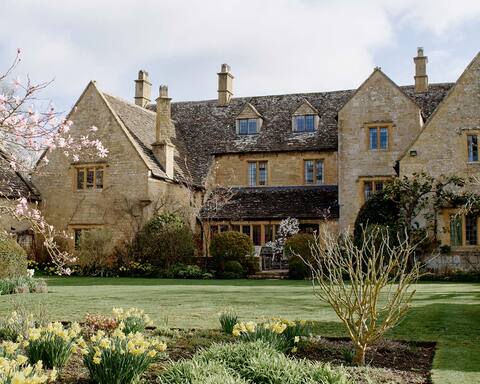
The Gingerbread House
Entire Place • 6 bedrooms
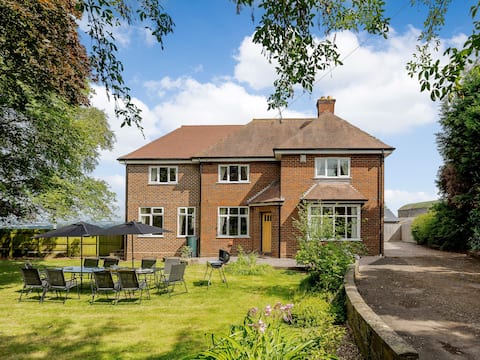
Renchers Farmhouse
Entire Place • 5 bedrooms
Exquisite character alpaca farm house Cotswolds
Entire Place • 7 bedrooms
Note: Performance varies based on location, size, amenities, seasonality, and management quality. Data reflects the past 12 months.
Top Performing Airbnb Hosts in Wychavon (2025)
Learn from the best! This table showcases top-performing Airbnb hosts in Wychavon based on the number of properties managed and estimated total revenue over the past year. Analyze their scale and performance metrics.
| Host Name | Properties | Grossing Revenue | Stay Reviews | Avg Rating |
|---|---|---|---|---|
| Cottages | 12 | $698,492 | 155 | 3.67/5.0 |
| Liberty Holdings | 24 | $581,398 | 3430 | 4.37/5.0 |
| Lisa | 1 | $457,313 | 38 | 4.97/5.0 |
| Host #491508995 | 2 | $431,758 | 0 | 0.00/5.0 |
| Watersedge | 8 | $386,483 | 546 | 4.78/5.0 |
| Tyler | 4 | $327,945 | 893 | 4.81/5.0 |
| StayCotswold | 6 | $305,620 | 131 | 4.75/5.0 |
| Host & Stay | 13 | $266,628 | 486 | 4.69/5.0 |
| Charlotte | 1 | $226,103 | 28 | 4.96/5.0 |
| Julie | 1 | $209,487 | 84 | 4.81/5.0 |
Analyzing the strategies of top hosts, such as their property selection, pricing, and guest communication, can offer valuable lessons for optimizing your own Airbnb operations in Wychavon.
Dive Deeper: Advanced Wychavon STR Market Data (2025)
Ready to unlock more insights? AirROI provides access to advanced metrics and comprehensive Airbnb data for Wychavon. Explore detailed analytics beyond this report to refine your investment strategy, optimize pricing, and maximize your vacation rental profits.
Explore Advanced MetricsWychavon Short-Term Rental Market Composition (2025): Property & Room Types
Room Type Distribution
Property Type Distribution
Market Composition Insights for Wychavon
- The Wychavon Airbnb market composition is heavily skewed towards Entire Home/Apt listings, which make up 89.3% of the 439 active rentals. This indicates strong guest preference for privacy and space.
- Looking at the property type distribution in Wychavon, House properties are the most common (59.7%), reflecting the local real estate landscape.
- Houses represent a significant 59.7% portion, catering likely to families or larger groups.
Wychavon Airbnb Room Capacity Analysis (2025): Bedroom Distribution
Distribution of Listings by Number of Bedrooms
Room Capacity Insights for Wychavon
- The dominant room capacity in Wychavon is 1 bedroom listings, making up 39.4% of the market. This suggests a strong demand for properties suitable for couples or solo travelers.
- Together, 1 bedroom and 2 bedrooms properties represent 69.5% of the active Airbnb listings in Wychavon, indicating a high concentration in these sizes.
- A significant 22.7% of listings offer 3+ bedrooms, catering to larger groups and families seeking more space in Wychavon.
Wychavon Vacation Rental Guest Capacity Trends (2025)
Distribution of Listings by Guest Capacity
Guest Capacity Insights for Wychavon
- The most common guest capacity trend in Wychavon vacation rentals is listings accommodating 2 guests (34.9%). This suggests the primary traveler segment is likely couples or solo travelers.
- Properties designed for 2 guests and 4 guests dominate the Wychavon STR market, accounting for 62.7% of listings.
- 20.5% of properties accommodate 6+ guests, serving the market segment for larger families or group travel in Wychavon.
- On average, properties in Wychavon are equipped to host 3.6 guests.
Wychavon Airbnb Booking Patterns (2025): Available vs. Booked Days
Available Days Distribution
Booked Days Distribution
Booking Pattern Insights for Wychavon
- The most common availability pattern in Wychavon falls within the 271-366 days range, representing 33.5% of listings. This suggests many properties have significant open periods on their calendars.
- Approximately 61.7% of listings show high availability (181+ days open annually), indicating potential for increased bookings or specific owner usage patterns.
- For booked days, the 181-270 days range is most frequent in Wychavon (29.6%), reflecting common guest stay durations or potential owner blocking patterns.
- A notable 39.9% of properties secure long booking periods (181+ days booked per year), highlighting successful long-term rental strategies or significant owner usage.
Wychavon Airbnb Minimum Stay Requirements Analysis
Distribution of Listings by Minimum Night Requirement
1 Night
125 listings
30.2% of total
2 Nights
162 listings
39.1% of total
3 Nights
54 listings
13% of total
4-6 Nights
8 listings
1.9% of total
7-29 Nights
1 listings
0.2% of total
30+ Nights
64 listings
15.5% of total
Key Insights
- The most prevalent minimum stay requirement in Wychavon is 2 Nights, adopted by 39.1% of listings. This highlights the market's preference for shorter, flexible bookings.
- A strong majority (69.3%) of the Wychavon Airbnb data shows acceptance of very short stays (1-2 nights), indicating a dynamic, high-turnover market.
- A significant segment (15.5%) caters to monthly stays (30+ nights) in Wychavon, pointing to opportunities in the extended-stay market.
Recommendations
- Align with the market by considering a 2 Nights minimum stay, as 39.1% of Wychavon hosts use this setting.
- Explore offering discounts for stays of 30+ nights to attract the 15.5% of the market seeking extended stays.
- Adjust minimum nights based on seasonality – potentially shorter during low season and longer during peak demand periods in Wychavon.
Wychavon Airbnb Cancellation Policy Trends Analysis (2025)
Non-refundable
3 listings
0.8% of total
Super Strict 30 Days
3 listings
0.8% of total
Super Strict 60 Days
18 listings
4.6% of total
Flexible
92 listings
23.5% of total
Moderate
120 listings
30.7% of total
Firm
63 listings
16.1% of total
Strict
92 listings
23.5% of total
Cancellation Policy Insights for Wychavon
- The prevailing Airbnb cancellation policy trend in Wychavon is Moderate, used by 30.7% of listings.
- There's a relatively balanced mix between guest-friendly (54.2%) and stricter (39.6%) policies, offering choices for different guest needs.
Recommendations for Hosts
- Consider adopting a Moderate policy to align with the 30.7% market standard in Wychavon.
- Regularly review your cancellation policy against competitors and market demand shifts in Wychavon.
Wychavon STR Booking Lead Time Analysis (2025)
Average Booking Lead Time by Month
Booking Lead Time Insights for Wychavon
- The overall average booking lead time for vacation rentals in Wychavon is 54 days.
- Guests book furthest in advance for stays during May (average 81 days), likely coinciding with peak travel demand or local events.
- The shortest booking windows occur for stays in February (average 47 days), indicating more last-minute travel plans during this time.
- Seasonally, Summer (74 days avg.) sees the longest lead times, while Fall (55 days avg.) has the shortest, reflecting typical travel planning cycles.
Recommendations for Hosts
- Use the overall average lead time (54 days) as a baseline for your pricing and availability strategy in Wychavon.
- For May stays, consider implementing length-of-stay discounts or slightly higher rates for bookings made less than 81 days out to capitalize on advance planning.
- Target marketing efforts for the Summer season well in advance (at least 74 days) to capture early planners.
- Monitor your own booking lead times against these Wychavon averages to identify opportunities for dynamic pricing adjustments.
Popular & Essential Airbnb Amenities in Wychavon (2025)
Amenity Prevalence
Amenity Insights for Wychavon
- Essential amenities in Wychavon that guests expect include: Smoke alarm, Heating. Lacking these (any) could significantly impact bookings.
- Popular amenities like TV, Free parking on premises, Hot water are common but not universal. Offering these can provide a competitive edge.
- Warning: Wifi is not universally provided but is considered essential globally. Ensure reliable Wifi is offered.
Recommendations for Hosts
- Ensure your listing includes all essential amenities for Wychavon: Smoke alarm, Heating.
- Prioritize adding missing essentials: Smoke alarm, Heating.
- Consider adding popular differentiators like TV or Free parking on premises to increase appeal.
- Highlight unique or less common amenities you offer (e.g., hot tub, dedicated workspace, EV charger) in your listing description and photos.
- Regularly check competitor amenities in Wychavon to stay competitive.
Wychavon Airbnb Guest Demographics & Profile Analysis (2025)
Guest Profile Summary for Wychavon
- The typical guest profile for Airbnb in Wychavon consists of primarily domestic travelers (87%), often arriving from nearby England, typically belonging to the Post-2000s (Gen Z/Alpha) group (50%), primarily speaking English or French.
- Domestic travelers account for 87.4% of guests.
- Key international markets include United Kingdom (87.4%) and United States (3.4%).
- Top languages spoken are English (71.1%) followed by French (6.9%).
- A significant demographic segment is the Post-2000s (Gen Z/Alpha) group, representing 50% of guests.
Recommendations for Hosts
- Target domestic marketing efforts towards travelers from England and London.
- Tailor amenities and listing descriptions to appeal to the dominant Post-2000s (Gen Z/Alpha) demographic (e.g., highlight fast WiFi, smart home features, local guides).
- Highlight unique local experiences or amenities relevant to the primary guest profile.
- Consider seasonal promotions aligned with peak travel times for key origin markets.
Nearby Short-Term Rental Market Comparison
How does the Wychavon Airbnb market stack up against its neighbors? Compare key performance metrics like average monthly revenue, ADR, and occupancy rates in surrounding areas to understand the broader regional STR landscape.
| Market | Active Properties | Monthly Revenue | Daily Rate | Avg. Occupancy |
|---|---|---|---|---|
| Englishcombe | 13 | $8,558 | $573.69 | 49% |
| Chew Magna | 14 | $6,649 | $399.59 | 46% |
| Lambourn | 11 | $6,081 | $669.47 | 28% |
| Long Sutton | 17 | $5,726 | $383.88 | 46% |
| Stoke St. Michael | 10 | $5,277 | $424.04 | 42% |
| Oldland Common | 13 | $5,093 | $355.47 | 43% |
| Crai | 20 | $4,799 | $371.85 | 46% |
| Dinton | 11 | $4,637 | $242.16 | 58% |
| Limpley Stoke | 10 | $4,598 | $523.47 | 52% |
| Flore | 10 | $4,534 | $347.03 | 40% |