Woolland Airbnb Market Analysis 2025: Short Term Rental Data & Vacation Rental Statistics in England, United Kingdom
Is Airbnb profitable in Woolland in 2025? Explore comprehensive Airbnb analytics for Woolland, England, United Kingdom to uncover income potential. This 2025 STR market report for Woolland, based on AirROI data from April 2024 to March 2025, reveals key trends in the niche market of 20 active listings.
Whether you're considering an Airbnb investment in Woolland, optimizing your existing vacation rental, or exploring rental arbitrage opportunities, understanding the Woolland Airbnb data is crucial. Leveraging the low regulation environment is key to maximizing your short term rental income potential. Let's dive into the specifics.
Key Woolland Airbnb Performance Metrics Overview
Monthly Airbnb Revenue Variations & Income Potential in Woolland (2025)
Understanding the monthly revenue variations for Airbnb listings in Woolland is key to maximizing your short term rental income potential. Seasonality significantly impacts earnings. Our analysis, based on data from the past 12 months, shows that the peak revenue month for STRs in Woolland is typically August, while March often presents the lowest earnings, highlighting opportunities for strategic pricing adjustments during shoulder and low seasons. Explore the typical Airbnb income in Woolland across different performance tiers:
- Best-in-class properties (Top 10%) achieve $6,168+ monthly, often utilizing dynamic pricing and superior guest experiences.
- Strong performing properties (Top 25%) earn $4,171 or more, indicating effective management and desirable locations/amenities.
- Typical properties (Median) generate around $2,432 per month, representing the average market performance.
- Entry-level properties (Bottom 25%) see earnings around $1,488, often with potential for optimization.
Average Monthly Airbnb Earnings Trend in Woolland
Woolland Airbnb Occupancy Rate Trends (2025)
Maximize your bookings by understanding the Woolland STR occupancy trends. Seasonal demand shifts significantly influence how often properties are booked. Typically, Augustsees the highest demand (peak season occupancy), while January experiences the lowest (low season). Effective strategies, like adjusting minimum stays or offering promotions, can boost occupancy during slower periods. Here's how different property tiers perform in Woolland:
- Best-in-class properties (Top 10%) achieve 67%+ occupancy, indicating high desirability and potentially optimized availability.
- Strong performing properties (Top 25%) maintain 36% or higher occupancy, suggesting good market fit and guest satisfaction.
- Typical properties (Median) have an occupancy rate around 16%.
- Entry-level properties (Bottom 25%) average 9% occupancy, potentially facing higher vacancy.
Average Monthly Occupancy Rate Trend in Woolland
Average Daily Rate (ADR) Airbnb Trends in Woolland (2025)
Effective short term rental pricing strategy in Woolland involves understanding monthly ADR fluctuations. The Average Daily Rate (ADR) for Airbnb in Woolland typically peaks in February and dips lowest during October. Leveraging Airbnb dynamic pricing tools or strategies based on this seasonality can significantly boost revenue. Here's a look at the typical nightly rates achieved:
- Best-in-class properties (Top 10%) command rates of $1,024+ per night, often due to premium features or locations.
- Strong performing properties (Top 25%) achieve nightly rates of $705 or more.
- Typical properties (Median) charge around $423 per night.
- Entry-level properties (Bottom 25%) earn around $299 per night.
Average Daily Rate (ADR) Trend by Month in Woolland
Get Live Woolland Market Intelligence 👇

Explore Real-time Analytics
Airbnb Seasonality Analysis & Trends in Woolland (2025)
Peak Season (August, May, July)
- Revenue averages $4,741 per month
- Occupancy rates average 35.5%
- Daily rates average $561
Shoulder Season
- Revenue averages $3,305 per month
- Occupancy maintains around 27.5%
- Daily rates hold near $575
Low Season (January, March, November)
- Revenue drops to average $1,968 per month
- Occupancy decreases to average 21.1%
- Daily rates adjust to average $642
Seasonality Insights for Woolland
- The Airbnb seasonality in Woolland shows highly seasonal trends requiring careful strategy. While the sections above show seasonal averages, it's also insightful to look at the extremes:
- During the high season, the absolute peak month showcases Woolland's highest earning potential, with monthly revenues capable of climbing to $5,004, occupancy reaching a high of 40.9%, and ADRs peaking at $713.
- Conversely, the slowest single month of the year, typically falling within the low season, marks the market's lowest point. In this month, revenue might dip to $1,718, occupancy could drop to 14.1%, and ADRs may adjust down to $490.
- Understanding both the seasonal averages and these monthly peaks and troughs in revenue, occupancy, and ADR is crucial for maximizing your Airbnb profit potential in Woolland.
Seasonal Strategies for Maximizing Profit
- Peak Season: Maximize revenue through premium pricing and potentially longer minimum stays. Ensure high availability.
- Low Season: Offer competitive pricing, special promotions (e.g., extended stay discounts), and flexible cancellation policies. Target off-season travelers like remote workers or budget-conscious guests.
- Shoulder Seasons: Implement dynamic pricing that balances peak and low rates. Target weekend travelers or specific events. Offer slightly more flexible terms than peak season.
- Regularly analyze your own performance against these Woolland seasonality benchmarks and adjust your pricing and availability strategy accordingly.
Best Areas for Airbnb Investment in Woolland (2025)
Exploring the top neighborhoods for short-term rentals in Woolland? This section highlights key areas, outlining why they are attractive for hosts and guests, along with notable local attractions. Consider these locations based on your target guest profile and investment strategy.
| Neighborhood / Area | Why Host Here? (Target Guests & Appeal) | Key Attractions & Landmarks |
|---|---|---|
| Dorset Countryside | Scenic rural beauty attracting tourists seeking tranquility and outdoor activities, perfect for nature lovers and families looking to relax in a picturesque environment. | Cerne Abbas Giant, Gold Hill, Dorchester Museum, Max Gate, Lulworth Cove |
| Blandford Forum | A historic market town with charming Georgian architecture, great for visitors interested in history and local culture. Close to various outdoor activities and attractions. | Blandford Town Museum, The Blandford Forum, Stourpaine Mill, North Dorset Trails, running, cycling and walking paths |
| Dorchester | The county town of Dorset with rich history and culture, ideal for guests interested in exploring museums and historical sites. Great transport links to other parts of Dorset. | Roman Town House, Dorset County Museum, Maumbury Rings, Kingston Maurward Gardens, Thomas Hardye's birthplace |
| Sherborne | A charming town with stunning historical architecture and beautiful gardens, appealing to tourists fascinated by castles and quaint English towns. | Sherborne Abbey, Sherborne Castle, Judith's Cafe, The Castle Gardens, Sherborne Museum |
| Wimborne Minster | Known for its historic minster and vibrant market, this area attracts guests interested in history, arts, and local culture. | Wimborne Minster, The Tivoli Theatre, Knobourough Castle, Elder Gardens, Bishop's Palace |
| Lyme Regis | A coastal resort town famous for its fossils and beautiful beaches, making it popular among families and outdoor enthusiasts. | Lyme Regis fossil beach, The Cobb, Dinosaurland Fossil Museum, Lyme Regis Marine Aquarium, Charmouth Heritage Coast Centre |
| Corfe Castle | A picturesque village dominated by the ruins of a famous castle, great for heritage tourism and outdoor exploration in the stunning Purbeck Hills. | Corfe Castle, The Purbeck Railway, St. Edward's Church, Corfe Castle Model Village, Dorset Wildlife Trust |
| Swanage | A vibrant seaside town known for its sandy beaches and stunning coastline, ideal for beachgoers and families looking for a fun getaway. | Swanage Beach, The Swanage Railway, Durlston Country Park, Swanage Pier, Anvil Point Lighthouse |
Understanding Airbnb License Requirements & STR Laws in Woolland (2025)
While Woolland, England, United Kingdom currently shows low STR regulations, specific Airbnb license requirements might still exist or change. Always verify the latest short term rental regulations and Airbnb license requirements directly with local government authorities for Woolland to ensure full compliance before hosting.
(Source: AirROI data, 2025, finding no licensed listings among those analyzed)
Top Performing Airbnb Properties in Woolland (2025)
Benchmark your potential! Explore examples of top-performing Airbnb properties in Woollandbased on Trailing Twelve Month (TTM) revenue. Analyze their characteristics, revenue, occupancy rate, and ADR to understand what drives success in this market.
Group Accommodation for 16 people in rural Dorset
Entire Place • 5 bedrooms
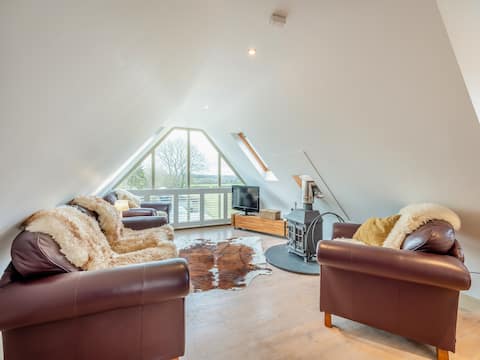
The Studio
Entire Place • 1 bedroom
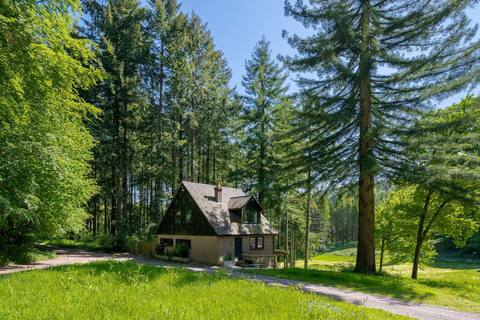
Woodland Cabin with Sauna in the Heart of Dorset
Entire Place • 2 bedrooms
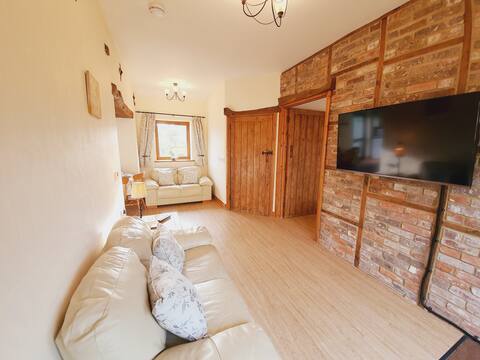
Dogs welcome! Lodge for 4, enclosed garden Dorset
Entire Place • 2 bedrooms
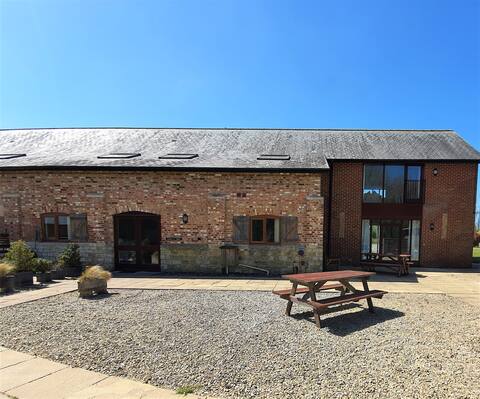
Barn conversion for 10 for group getaways Dorset
Entire Place • 4 bedrooms
Escape to the country! hot tub cottage for 7
Entire Place • 3 bedrooms
Note: Performance varies based on location, size, amenities, seasonality, and management quality. Data reflects the past 12 months.
Top Performing Airbnb Hosts in Woolland (2025)
Learn from the best! This table showcases top-performing Airbnb hosts in Woolland based on the number of properties managed and estimated total revenue over the past year. Analyze their scale and performance metrics.
| Host Name | Properties | Grossing Revenue | Stay Reviews | Avg Rating |
|---|---|---|---|---|
| The Victorian Barn Dorset | 14 | $370,756 | 145 | 4.80/5.0 |
| Cottages | 1 | $64,650 | 15 | 4.80/5.0 |
| Laura | 1 | $49,546 | 109 | 4.94/5.0 |
| Eliza | 1 | $24,466 | 29 | 4.69/5.0 |
| Host #184936338 | 1 | $24,416 | 0 | 0.00/5.0 |
| Lucy | 1 | $17,122 | 156 | 4.89/5.0 |
| Host #2873666 | 1 | $13,487 | 75 | 4.97/5.0 |
Analyzing the strategies of top hosts, such as their property selection, pricing, and guest communication, can offer valuable lessons for optimizing your own Airbnb operations in Woolland.
Dive Deeper: Advanced Woolland STR Market Data (2025)
Ready to unlock more insights? AirROI provides access to advanced metrics and comprehensive Airbnb data for Woolland. Explore detailed analytics beyond this report to refine your investment strategy, optimize pricing, and maximize your vacation rental profits.
Explore Advanced MetricsWoolland Short-Term Rental Market Composition (2025): Property & Room Types
Room Type Distribution
Property Type Distribution
Market Composition Insights for Woolland
- The Woolland Airbnb market composition is heavily skewed towards Entire Home/Apt listings, which make up 100% of the 20 active rentals. This indicates strong guest preference for privacy and space.
- Looking at the property type distribution in Woolland, House properties are the most common (50%), reflecting the local real estate landscape.
- Houses represent a significant 50% portion, catering likely to families or larger groups.
Woolland Airbnb Room Capacity Analysis (2025): Bedroom Distribution
Distribution of Listings by Number of Bedrooms
Room Capacity Insights for Woolland
- The dominant room capacity in Woolland is 2 bedrooms listings, making up 55% of the market. This suggests a strong demand for properties suitable for couples or solo travelers.
- Together, 2 bedrooms and 4 bedrooms properties represent 70.0% of the active Airbnb listings in Woolland, indicating a high concentration in these sizes.
- A significant 35.0% of listings offer 3+ bedrooms, catering to larger groups and families seeking more space in Woolland.
Woolland Vacation Rental Guest Capacity Trends (2025)
Distribution of Listings by Guest Capacity
Guest Capacity Insights for Woolland
- The most common guest capacity trend in Woolland vacation rentals is listings accommodating 4 guests (45%). This suggests the primary traveler segment is likely small families or groups.
- Properties designed for 4 guests and 8+ guests dominate the Woolland STR market, accounting for 65.0% of listings.
- 40.0% of properties accommodate 6+ guests, serving the market segment for larger families or group travel in Woolland.
- On average, properties in Woolland are equipped to host 5.2 guests.
Woolland Airbnb Booking Patterns (2025): Available vs. Booked Days
Available Days Distribution
Booked Days Distribution
Booking Pattern Insights for Woolland
- The most common availability pattern in Woolland falls within the 271-366 days range, representing 80% of listings. This suggests many properties have significant open periods on their calendars.
- Approximately 90.0% of listings show high availability (181+ days open annually), indicating potential for increased bookings or specific owner usage patterns.
- For booked days, the 31-90 days range is most frequent in Woolland (50%), reflecting common guest stay durations or potential owner blocking patterns.
- A notable 10.0% of properties secure long booking periods (181+ days booked per year), highlighting successful long-term rental strategies or significant owner usage.
Woolland Airbnb Minimum Stay Requirements Analysis
Distribution of Listings by Minimum Night Requirement
2 Nights
15 listings
78.9% of total
7-29 Nights
1 listings
5.3% of total
30+ Nights
3 listings
15.8% of total
Key Insights
- The most prevalent minimum stay requirement in Woolland is 2 Nights, adopted by 78.9% of listings. This highlights the market's preference for shorter, flexible bookings.
- A strong majority (78.9%) of the Woolland Airbnb data shows acceptance of very short stays (1-2 nights), indicating a dynamic, high-turnover market.
- A significant segment (15.8%) caters to monthly stays (30+ nights) in Woolland, pointing to opportunities in the extended-stay market.
Recommendations
- Align with the market by considering a 2 Nights minimum stay, as 78.9% of Woolland hosts use this setting.
- A 2-night minimum appears standard (78.9%). Consider this for weekends or peak periods.
- Explore offering discounts for stays of 30+ nights to attract the 15.8% of the market seeking extended stays.
- Adjust minimum nights based on seasonality – potentially shorter during low season and longer during peak demand periods in Woolland.
Woolland Airbnb Cancellation Policy Trends Analysis (2025)
Super Strict 60 Days
13 listings
68.4% of total
Flexible
1 listings
5.3% of total
Firm
2 listings
10.5% of total
Strict
3 listings
15.8% of total
Cancellation Policy Insights for Woolland
- The prevailing Airbnb cancellation policy trend in Woolland is Super Strict 60 Days, used by 68.4% of listings.
- There's a relatively balanced mix between guest-friendly (5.3%) and stricter (26.3%) policies, offering choices for different guest needs.
Recommendations for Hosts
- Consider adopting a Super Strict 60 Days policy to align with the 68.4% market standard in Woolland.
- Regularly review your cancellation policy against competitors and market demand shifts in Woolland.
Woolland STR Booking Lead Time Analysis (2025)
Average Booking Lead Time by Month
Booking Lead Time Insights for Woolland
- The overall average booking lead time for vacation rentals in Woolland is 108 days.
- Guests book furthest in advance for stays during November (average 242 days), likely coinciding with peak travel demand or local events.
- The shortest booking windows occur for stays in March (average 26 days), indicating more last-minute travel plans during this time.
- Seasonally, Fall (114 days avg.) sees the longest lead times, while Winter (73 days avg.) has the shortest, reflecting typical travel planning cycles.
Recommendations for Hosts
- Use the overall average lead time (108 days) as a baseline for your pricing and availability strategy in Woolland.
- For November stays, consider implementing length-of-stay discounts or slightly higher rates for bookings made less than 242 days out to capitalize on advance planning.
- Target marketing efforts for the Fall season well in advance (at least 114 days) to capture early planners.
- Monitor your own booking lead times against these Woolland averages to identify opportunities for dynamic pricing adjustments.
Popular & Essential Airbnb Amenities in Woolland (2025)
Amenity Prevalence
No amenities with partial availability (less than 100%) were found to display in the chart. All essential amenities might be present in all listings. Check insights below.
Amenity Insights for Woolland
- Essential amenities in Woolland that guests expect include: Kitchen, Free parking on premises, Private entrance, TV, Fire extinguisher, Heating, Cooking basics, Smoke alarm, Backyard, Wifi. Lacking these (any) could significantly impact bookings.
Recommendations for Hosts
- Ensure your listing includes all essential amenities for Woolland: Kitchen, Free parking on premises, Private entrance, TV, Fire extinguisher, Heating, Cooking basics, Smoke alarm, Backyard, Wifi.
- Highlight unique or less common amenities you offer (e.g., hot tub, dedicated workspace, EV charger) in your listing description and photos.
- Regularly check competitor amenities in Woolland to stay competitive.
Woolland Airbnb Guest Demographics & Profile Analysis (2025)
Guest Profile Summary for Woolland
- The typical guest profile for Airbnb in Woolland consists of primarily domestic travelers (86%), often arriving from nearby England, typically belonging to the Post-2000s (Gen Z/Alpha) group (50%), primarily speaking English or Spanish.
- Domestic travelers account for 86.0% of guests.
- Key international markets include United Kingdom (86%) and Netherlands (5.3%).
- Top languages spoken are English (71.4%) followed by Spanish (7.1%).
- A significant demographic segment is the Post-2000s (Gen Z/Alpha) group, representing 50% of guests.
Recommendations for Hosts
- Target domestic marketing efforts towards travelers from England and London.
- Tailor amenities and listing descriptions to appeal to the dominant Post-2000s (Gen Z/Alpha) demographic (e.g., highlight fast WiFi, smart home features, local guides).
- Highlight unique local experiences or amenities relevant to the primary guest profile.
- Consider seasonal promotions aligned with peak travel times for key origin markets.
Nearby Short-Term Rental Market Comparison
How does the Woolland Airbnb market stack up against its neighbors? Compare key performance metrics like average monthly revenue, ADR, and occupancy rates in surrounding areas to understand the broader regional STR landscape.
| Market | Active Properties | Monthly Revenue | Daily Rate | Avg. Occupancy |
|---|---|---|---|---|
| Englishcombe | 13 | $8,558 | $573.69 | 49% |
| Chew Magna | 14 | $6,649 | $399.59 | 46% |
| Lambourn | 11 | $6,081 | $669.47 | 28% |
| Long Sutton | 17 | $5,726 | $383.88 | 46% |
| Stoke St. Michael | 10 | $5,277 | $424.04 | 42% |
| Winsham | 10 | $5,154 | $484.22 | 52% |
| Oldland Common | 13 | $5,093 | $355.47 | 43% |
| Crai | 20 | $4,799 | $371.85 | 46% |
| Dinton | 11 | $4,637 | $242.16 | 58% |
| Limpley Stoke | 10 | $4,598 | $523.47 | 52% |