Wool Airbnb Market Analysis 2025: Short Term Rental Data & Vacation Rental Statistics in England, United Kingdom
Is Airbnb profitable in Wool in 2025? Explore comprehensive Airbnb analytics for Wool, England, United Kingdom to uncover income potential. This 2025 STR market report for Wool, based on AirROI data from April 2024 to March 2025, reveals key trends in the niche market of 21 active listings.
Whether you're considering an Airbnb investment in Wool, optimizing your existing vacation rental, or exploring rental arbitrage opportunities, understanding the Wool Airbnb data is crucial. Leveraging the low regulation environment is key to maximizing your short term rental income potential. Let's dive into the specifics.
Key Wool Airbnb Performance Metrics Overview
Monthly Airbnb Revenue Variations & Income Potential in Wool (2025)
Understanding the monthly revenue variations for Airbnb listings in Wool is key to maximizing your short term rental income potential. Seasonality significantly impacts earnings. Our analysis, based on data from the past 12 months, shows that the peak revenue month for STRs in Wool is typically June, while December often presents the lowest earnings, highlighting opportunities for strategic pricing adjustments during shoulder and low seasons. Explore the typical Airbnb income in Wool across different performance tiers:
- Best-in-class properties (Top 10%) achieve $3,632+ monthly, often utilizing dynamic pricing and superior guest experiences.
- Strong performing properties (Top 25%) earn $2,585 or more, indicating effective management and desirable locations/amenities.
- Typical properties (Median) generate around $1,346 per month, representing the average market performance.
- Entry-level properties (Bottom 25%) see earnings around $702, often with potential for optimization.
Average Monthly Airbnb Earnings Trend in Wool
Wool Airbnb Occupancy Rate Trends (2025)
Maximize your bookings by understanding the Wool STR occupancy trends. Seasonal demand shifts significantly influence how often properties are booked. Typically, Augustsees the highest demand (peak season occupancy), while December experiences the lowest (low season). Effective strategies, like adjusting minimum stays or offering promotions, can boost occupancy during slower periods. Here's how different property tiers perform in Wool:
- Best-in-class properties (Top 10%) achieve 69%+ occupancy, indicating high desirability and potentially optimized availability.
- Strong performing properties (Top 25%) maintain 57% or higher occupancy, suggesting good market fit and guest satisfaction.
- Typical properties (Median) have an occupancy rate around 27%.
- Entry-level properties (Bottom 25%) average 16% occupancy, potentially facing higher vacancy.
Average Monthly Occupancy Rate Trend in Wool
Average Daily Rate (ADR) Airbnb Trends in Wool (2025)
Effective short term rental pricing strategy in Wool involves understanding monthly ADR fluctuations. The Average Daily Rate (ADR) for Airbnb in Wool typically peaks in August and dips lowest during March. Leveraging Airbnb dynamic pricing tools or strategies based on this seasonality can significantly boost revenue. Here's a look at the typical nightly rates achieved:
- Best-in-class properties (Top 10%) command rates of $442+ per night, often due to premium features or locations.
- Strong performing properties (Top 25%) achieve nightly rates of $228 or more.
- Typical properties (Median) charge around $135 per night.
- Entry-level properties (Bottom 25%) earn around $113 per night.
Average Daily Rate (ADR) Trend by Month in Wool
Get Live Wool Market Intelligence 👇

Explore Real-time Analytics
Airbnb Seasonality Analysis & Trends in Wool (2025)
Peak Season (June, August, September)
- Revenue averages $3,061 per month
- Occupancy rates average 48.6%
- Daily rates average $233
Shoulder Season
- Revenue averages $1,839 per month
- Occupancy maintains around 37.1%
- Daily rates hold near $207
Low Season (January, February, December)
- Revenue drops to average $1,141 per month
- Occupancy decreases to average 21.9%
- Daily rates adjust to average $179
Seasonality Insights for Wool
- The Airbnb seasonality in Wool shows highly seasonal trends requiring careful strategy. While the sections above show seasonal averages, it's also insightful to look at the extremes:
- During the high season, the absolute peak month showcases Wool's highest earning potential, with monthly revenues capable of climbing to $3,400, occupancy reaching a high of 55.1%, and ADRs peaking at $238.
- Conversely, the slowest single month of the year, typically falling within the low season, marks the market's lowest point. In this month, revenue might dip to $1,102, occupancy could drop to 16.5%, and ADRs may adjust down to $150.
- Understanding both the seasonal averages and these monthly peaks and troughs in revenue, occupancy, and ADR is crucial for maximizing your Airbnb profit potential in Wool.
Seasonal Strategies for Maximizing Profit
- Peak Season: Maximize revenue through premium pricing and potentially longer minimum stays. Ensure high availability.
- Low Season: Offer competitive pricing, special promotions (e.g., extended stay discounts), and flexible cancellation policies. Target off-season travelers like remote workers or budget-conscious guests.
- Shoulder Seasons: Implement dynamic pricing that balances peak and low rates. Target weekend travelers or specific events. Offer slightly more flexible terms than peak season.
- Regularly analyze your own performance against these Wool seasonality benchmarks and adjust your pricing and availability strategy accordingly.
Best Areas for Airbnb Investment in Wool (2025)
Exploring the top neighborhoods for short-term rentals in Wool? This section highlights key areas, outlining why they are attractive for hosts and guests, along with notable local attractions. Consider these locations based on your target guest profile and investment strategy.
| Neighborhood / Area | Why Host Here? (Target Guests & Appeal) | Key Attractions & Landmarks |
|---|---|---|
| Wool Village | A charming village with a rich history, ideal for families and couples looking for a peaceful countryside getaway. | Wool Museum, The River Frome, Thomas Hardy's Cottage, Countryside walks and trails, Wool Circular Walk |
| Wareham | Close to Wool, this historic market town is popular with tourists visiting the Jurassic Coast, offering beautiful scenery and local attractions. | Wareham Quay, Corfe Castle, Monkey World, Brownsea Island, The Jurassic Coast |
| Dorset Craft Village | A unique shopping experience with local artisans creating beautiful crafts, attracting visitors looking for handmade goods and pottery. | Local artisan shops, Craft workshops, Cafes and eateries, Art exhibitions, The beauty of the Dorset countryside |
| Lulworth Cove | A UNESCO World Heritage site known for its stunning natural beauty, it's perfect for travelers interested in outdoor activities and geological wonders. | Lulworth Cove, Durdle Door, Coastal walks, Lulworth Castle, The Lulworth Estate |
| Corfe Castle | A historic castle with magnificent views, attracts history buffs and families looking for a fun day out with a mix of culture and adventure. | Corfe Castle ruins, Steam train rides, The Purbeck Hills, Local pubs and eateries, Scenic walks |
| Swanage | A coastal town popular for its beach and vibrant town center, ideal for summer holiday rentals focusing on beachgoers and families. | Swanage Beach, Old Harry Rocks, Swanage Railway, Peveril Point, The Pier |
| Purbeck Hills | Offering stunning views and walking trails, it is a great spot for nature lovers and hikers, providing a retreat from city life. | Walking trails, Panoramic views, Wildlife watching, Charming villages, Cycling routes |
| Poole | A lively coastal town known for its large natural harbor, ideal for tourists interested in water sports and beach activities as well as cultural events. | Poole Harbour, Brownsea Island, Sandbanks Beach, Poole Museum, Seafood restaurants |
Understanding Airbnb License Requirements & STR Laws in Wool (2025)
While Wool, England, United Kingdom currently shows low STR regulations, specific Airbnb license requirements might still exist or change. Always verify the latest short term rental regulations and Airbnb license requirements directly with local government authorities for Wool to ensure full compliance before hosting.
(Source: AirROI data, 2025, finding no licensed listings among those analyzed)
Top Performing Airbnb Properties in Wool (2025)
Benchmark your potential! Explore examples of top-performing Airbnb properties in Woolbased on Trailing Twelve Month (TTM) revenue. Analyze their characteristics, revenue, occupancy rate, and ADR to understand what drives success in this market.
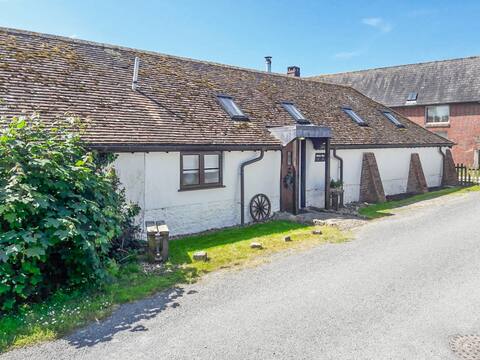
Meadow Barn
Entire Place • 2 bedrooms
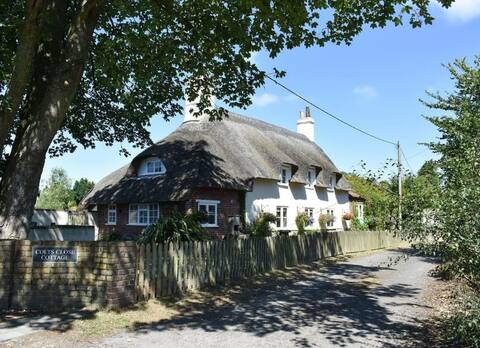
Beautiful Country Cottage
Entire Place • 5 bedrooms
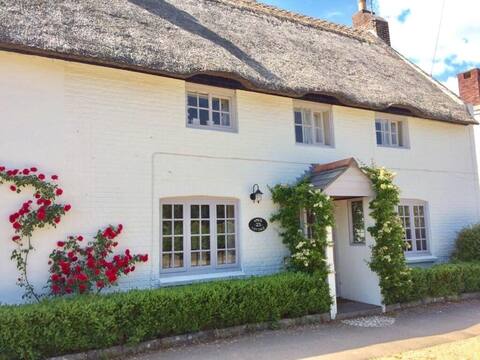
The Duck House
Entire Place • 2 bedrooms
The Piggery At The Cottage - Nr Lulworth Cove!
Entire Place • 1 bedroom

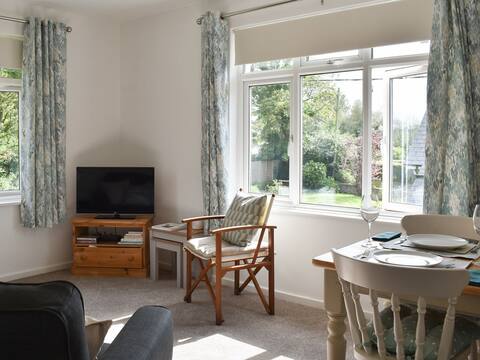
A spacious and tranquil place to stay
Entire Place • 1 bedroom

Self catering 1 bedroom flat in Wool Dorset
Entire Place • 1 bedroom
Note: Performance varies based on location, size, amenities, seasonality, and management quality. Data reflects the past 12 months.
Top Performing Airbnb Hosts in Wool (2025)
Learn from the best! This table showcases top-performing Airbnb hosts in Wool based on the number of properties managed and estimated total revenue over the past year. Analyze their scale and performance metrics.
| Host Name | Properties | Grossing Revenue | Stay Reviews | Avg Rating |
|---|---|---|---|---|
| Cottages | 3 | $116,642 | 35 | 3.27/5.0 |
| Sharron | 2 | $57,682 | 8 | 2.38/5.0 |
| Tracy | 2 | $47,858 | 143 | 4.97/5.0 |
| Cheryl | 2 | $26,391 | 288 | 4.75/5.0 |
| Carl | 1 | $23,988 | 49 | 4.98/5.0 |
| Elizabeth | 1 | $20,568 | 22 | 5.00/5.0 |
| Jenny | 1 | $16,643 | 45 | 4.96/5.0 |
| Sheren | 3 | $15,350 | 408 | 4.55/5.0 |
| Host #185605781 | 1 | $12,944 | 115 | 4.88/5.0 |
| Gillian | 2 | $11,472 | 182 | 4.87/5.0 |
Analyzing the strategies of top hosts, such as their property selection, pricing, and guest communication, can offer valuable lessons for optimizing your own Airbnb operations in Wool.
Dive Deeper: Advanced Wool STR Market Data (2025)
Ready to unlock more insights? AirROI provides access to advanced metrics and comprehensive Airbnb data for Wool. Explore detailed analytics beyond this report to refine your investment strategy, optimize pricing, and maximize your vacation rental profits.
Explore Advanced MetricsWool Short-Term Rental Market Composition (2025): Property & Room Types
Room Type Distribution
Property Type Distribution
Market Composition Insights for Wool
- The Wool Airbnb market composition is heavily skewed towards Entire Home/Apt listings, which make up 76.2% of the 21 active rentals. This indicates strong guest preference for privacy and space.
- Looking at the property type distribution in Wool, House properties are the most common (47.6%), reflecting the local real estate landscape.
- Houses represent a significant 47.6% portion, catering likely to families or larger groups.
- Smaller segments like hotel/boutique (combined 4.8%) offer potential for unique stay experiences.
Wool Airbnb Room Capacity Analysis (2025): Bedroom Distribution
Distribution of Listings by Number of Bedrooms
Room Capacity Insights for Wool
- The dominant room capacity in Wool is 1 bedroom listings, making up 42.9% of the market. This suggests a strong demand for properties suitable for couples or solo travelers.
- Together, 1 bedroom and 2 bedrooms properties represent 66.7% of the active Airbnb listings in Wool, indicating a high concentration in these sizes.
Wool Vacation Rental Guest Capacity Trends (2025)
Distribution of Listings by Guest Capacity
Guest Capacity Insights for Wool
- The most common guest capacity trend in Wool vacation rentals is listings accommodating 2 guests (42.9%). This suggests the primary traveler segment is likely couples or solo travelers.
- Properties designed for 2 guests and 4 guests dominate the Wool STR market, accounting for 57.2% of listings.
- A significant 42.9% of listings cater specifically to 1-2 guests, highlighting strong demand from couples and solo travelers in Wool.
- On average, properties in Wool are equipped to host 2.7 guests.
Wool Airbnb Booking Patterns (2025): Available vs. Booked Days
Available Days Distribution
Booked Days Distribution
Booking Pattern Insights for Wool
- The most common availability pattern in Wool falls within the 271-366 days range, representing 52.4% of listings. This suggests many properties have significant open periods on their calendars.
- Approximately 81.0% of listings show high availability (181+ days open annually), indicating potential for increased bookings or specific owner usage patterns.
- For booked days, the 31-90 days range is most frequent in Wool (38.1%), reflecting common guest stay durations or potential owner blocking patterns.
- A notable 19.0% of properties secure long booking periods (181+ days booked per year), highlighting successful long-term rental strategies or significant owner usage.
Wool Airbnb Minimum Stay Requirements Analysis
Distribution of Listings by Minimum Night Requirement
1 Night
8 listings
42.1% of total
2 Nights
8 listings
42.1% of total
4-6 Nights
2 listings
10.5% of total
30+ Nights
1 listings
5.3% of total
Key Insights
- The most prevalent minimum stay requirement in Wool is 1 Night, adopted by 42.1% of listings. This highlights the market's preference for shorter, flexible bookings.
- A strong majority (84.2%) of the Wool Airbnb data shows acceptance of very short stays (1-2 nights), indicating a dynamic, high-turnover market.
Recommendations
- Align with the market by considering a 1 Night minimum stay, as 42.1% of Wool hosts use this setting.
- Explore offering discounts for stays of 30+ nights to attract the 5.3% of the market seeking extended stays.
- Adjust minimum nights based on seasonality – potentially shorter during low season and longer during peak demand periods in Wool.
Wool Airbnb Cancellation Policy Trends Analysis (2025)
Super Strict 60 Days
2 listings
11.8% of total
Flexible
5 listings
29.4% of total
Moderate
6 listings
35.3% of total
Firm
2 listings
11.8% of total
Strict
2 listings
11.8% of total
Cancellation Policy Insights for Wool
- The prevailing Airbnb cancellation policy trend in Wool is Moderate, used by 35.3% of listings.
- There's a relatively balanced mix between guest-friendly (64.7%) and stricter (23.6%) policies, offering choices for different guest needs.
Recommendations for Hosts
- Consider adopting a Moderate policy to align with the 35.3% market standard in Wool.
- Using a Strict policy might deter some guests, as only 11.8% of listings use it. Evaluate if potential revenue protection outweighs possible lower booking rates.
- Regularly review your cancellation policy against competitors and market demand shifts in Wool.
Wool STR Booking Lead Time Analysis (2025)
Average Booking Lead Time by Month
Booking Lead Time Insights for Wool
- The overall average booking lead time for vacation rentals in Wool is 64 days.
- Guests book furthest in advance for stays during June (average 125 days), likely coinciding with peak travel demand or local events.
- The shortest booking windows occur for stays in February (average 35 days), indicating more last-minute travel plans during this time.
- Seasonally, Summer (84 days avg.) sees the longest lead times, while Winter (55 days avg.) has the shortest, reflecting typical travel planning cycles.
Recommendations for Hosts
- Use the overall average lead time (64 days) as a baseline for your pricing and availability strategy in Wool.
- For June stays, consider implementing length-of-stay discounts or slightly higher rates for bookings made less than 125 days out to capitalize on advance planning.
- Target marketing efforts for the Summer season well in advance (at least 84 days) to capture early planners.
- Monitor your own booking lead times against these Wool averages to identify opportunities for dynamic pricing adjustments.
Popular & Essential Airbnb Amenities in Wool (2025)
Amenity Prevalence
Amenity Insights for Wool
- Essential amenities in Wool that guests expect include: Wifi, Smoke alarm, Heating. Lacking these (any) could significantly impact bookings.
- Popular amenities like Carbon monoxide alarm, Free parking on premises, TV are common but not universal. Offering these can provide a competitive edge.
Recommendations for Hosts
- Ensure your listing includes all essential amenities for Wool: Wifi, Smoke alarm, Heating.
- Prioritize adding missing essentials: Wifi, Smoke alarm, Heating.
- Consider adding popular differentiators like Carbon monoxide alarm or Free parking on premises to increase appeal.
- Highlight unique or less common amenities you offer (e.g., hot tub, dedicated workspace, EV charger) in your listing description and photos.
- Regularly check competitor amenities in Wool to stay competitive.
Wool Airbnb Guest Demographics & Profile Analysis (2025)
Guest Profile Summary for Wool
- The typical guest profile for Airbnb in Wool consists of primarily domestic travelers (85%), often arriving from nearby England, typically belonging to the Post-2000s (Gen Z/Alpha) group (50%), primarily speaking English or Spanish.
- Domestic travelers account for 85.1% of guests.
- Key international markets include United Kingdom (85.1%) and Germany (2.4%).
- Top languages spoken are English (67.3%) followed by Spanish (5.1%).
- A significant demographic segment is the Post-2000s (Gen Z/Alpha) group, representing 50% of guests.
Recommendations for Hosts
- Target domestic marketing efforts towards travelers from England and London.
- Tailor amenities and listing descriptions to appeal to the dominant Post-2000s (Gen Z/Alpha) demographic (e.g., highlight fast WiFi, smart home features, local guides).
- Highlight unique local experiences or amenities relevant to the primary guest profile.
- Consider seasonal promotions aligned with peak travel times for key origin markets.
Nearby Short-Term Rental Market Comparison
How does the Wool Airbnb market stack up against its neighbors? Compare key performance metrics like average monthly revenue, ADR, and occupancy rates in surrounding areas to understand the broader regional STR landscape.
| Market | Active Properties | Monthly Revenue | Daily Rate | Avg. Occupancy |
|---|---|---|---|---|
| Englishcombe | 13 | $8,558 | $573.69 | 49% |
| Chew Magna | 14 | $6,649 | $399.59 | 46% |
| Lambourn | 11 | $6,081 | $669.47 | 28% |
| Long Sutton | 17 | $5,726 | $383.88 | 46% |
| Stoke St. Michael | 10 | $5,277 | $424.04 | 42% |
| Winsham | 10 | $5,154 | $484.22 | 52% |
| Oldland Common | 13 | $5,093 | $355.47 | 43% |
| Crai | 20 | $4,799 | $371.85 | 46% |
| Dinton | 11 | $4,637 | $242.16 | 58% |
| Limpley Stoke | 10 | $4,598 | $523.47 | 52% |