Windsor Airbnb Market Analysis 2025: Short Term Rental Data & Vacation Rental Statistics in England, United Kingdom
Is Airbnb profitable in Windsor in 2025? Explore comprehensive Airbnb analytics for Windsor, England, United Kingdom to uncover income potential. This 2025 STR market report for Windsor, based on AirROI data from April 2024 to March 2025, reveals key trends in the market of 320 active listings.
Whether you're considering an Airbnb investment in Windsor, optimizing your existing vacation rental, or exploring rental arbitrage opportunities, understanding the Windsor Airbnb data is crucial. Leveraging the low regulation environment is key to maximizing your short term rental income potential. Let's dive into the specifics.
Key Windsor Airbnb Performance Metrics Overview
Monthly Airbnb Revenue Variations & Income Potential in Windsor (2025)
Understanding the monthly revenue variations for Airbnb listings in Windsor is key to maximizing your short term rental income potential. Seasonality significantly impacts earnings. Our analysis, based on data from the past 12 months, shows that the peak revenue month for STRs in Windsor is typically May, while February often presents the lowest earnings, highlighting opportunities for strategic pricing adjustments during shoulder and low seasons. Explore the typical Airbnb income in Windsor across different performance tiers:
- Best-in-class properties (Top 10%) achieve $7,354+ monthly, often utilizing dynamic pricing and superior guest experiences.
- Strong performing properties (Top 25%) earn $5,141 or more, indicating effective management and desirable locations/amenities.
- Typical properties (Median) generate around $3,043 per month, representing the average market performance.
- Entry-level properties (Bottom 25%) see earnings around $1,449, often with potential for optimization.
Average Monthly Airbnb Earnings Trend in Windsor
Windsor Airbnb Occupancy Rate Trends (2025)
Maximize your bookings by understanding the Windsor STR occupancy trends. Seasonal demand shifts significantly influence how often properties are booked. Typically, Julysees the highest demand (peak season occupancy), while January experiences the lowest (low season). Effective strategies, like adjusting minimum stays or offering promotions, can boost occupancy during slower periods. Here's how different property tiers perform in Windsor:
- Best-in-class properties (Top 10%) achieve 80%+ occupancy, indicating high desirability and potentially optimized availability.
- Strong performing properties (Top 25%) maintain 66% or higher occupancy, suggesting good market fit and guest satisfaction.
- Typical properties (Median) have an occupancy rate around 47%.
- Entry-level properties (Bottom 25%) average 24% occupancy, potentially facing higher vacancy.
Average Monthly Occupancy Rate Trend in Windsor
Average Daily Rate (ADR) Airbnb Trends in Windsor (2025)
Effective short term rental pricing strategy in Windsor involves understanding monthly ADR fluctuations. The Average Daily Rate (ADR) for Airbnb in Windsor typically peaks in December and dips lowest during March. Leveraging Airbnb dynamic pricing tools or strategies based on this seasonality can significantly boost revenue. Here's a look at the typical nightly rates achieved:
- Best-in-class properties (Top 10%) command rates of $390+ per night, often due to premium features or locations.
- Strong performing properties (Top 25%) achieve nightly rates of $278 or more.
- Typical properties (Median) charge around $195 per night.
- Entry-level properties (Bottom 25%) earn around $139 per night.
Average Daily Rate (ADR) Trend by Month in Windsor
Get Live Windsor Market Intelligence 👇

Explore Real-time Analytics
Airbnb Seasonality Analysis & Trends in Windsor (2025)
Peak Season (May, June, July)
- Revenue averages $5,007 per month
- Occupancy rates average 52.7%
- Daily rates average $241
Shoulder Season
- Revenue averages $3,751 per month
- Occupancy maintains around 47.2%
- Daily rates hold near $233
Low Season (January, February, March)
- Revenue drops to average $2,319 per month
- Occupancy decreases to average 35.8%
- Daily rates adjust to average $209
Seasonality Insights for Windsor
- The Airbnb seasonality in Windsor shows highly seasonal trends requiring careful strategy. While the sections above show seasonal averages, it's also insightful to look at the extremes:
- During the high season, the absolute peak month showcases Windsor's highest earning potential, with monthly revenues capable of climbing to $5,226, occupancy reaching a high of 62.1%, and ADRs peaking at $243.
- Conversely, the slowest single month of the year, typically falling within the low season, marks the market's lowest point. In this month, revenue might dip to $2,273, occupancy could drop to 32.8%, and ADRs may adjust down to $208.
- Understanding both the seasonal averages and these monthly peaks and troughs in revenue, occupancy, and ADR is crucial for maximizing your Airbnb profit potential in Windsor.
Seasonal Strategies for Maximizing Profit
- Peak Season: Maximize revenue through premium pricing and potentially longer minimum stays. Ensure high availability.
- Low Season: Offer competitive pricing, special promotions (e.g., extended stay discounts), and flexible cancellation policies. Target off-season travelers like remote workers or budget-conscious guests.
- Shoulder Seasons: Implement dynamic pricing that balances peak and low rates. Target weekend travelers or specific events. Offer slightly more flexible terms than peak season.
- Regularly analyze your own performance against these Windsor seasonality benchmarks and adjust your pricing and availability strategy accordingly.
Best Areas for Airbnb Investment in Windsor (2025)
Exploring the top neighborhoods for short-term rentals in Windsor? This section highlights key areas, outlining why they are attractive for hosts and guests, along with notable local attractions. Consider these locations based on your target guest profile and investment strategy.
| Neighborhood / Area | Why Host Here? (Target Guests & Appeal) | Key Attractions & Landmarks |
|---|---|---|
| The Long Walk | A picturesque and historic area leading from Windsor Castle with beautiful views and a peaceful atmosphere. Ideal for tourists visiting the castle and looking for a serene stay close to nature. | Windsor Castle, The Long Walk, The Great Park, Changing of the Guard, Windsor Parish Church |
| Windsor Town Center | The bustling heart of Windsor with shops, restaurants, and attractions. Perfect for those wanting to stay close to local amenities and cultural experiences. | Theatre Royal Windsor, Shops on Peascod Street, Restaurants and cafes, King Edward Court, Windsor and Royal Borough Museum |
| Eton | Charming and historic, Eton is home to Eton College and offers a quaint, picturesque setting. A favorite for families and those interested in exploring historic England. | Eton College, Eton High Street, The River Thames, Eton Bridge, Eton Wick |
| Windsor Great Park | A vast and beautiful park ideal for nature lovers, with extensive walking trails and scenic views. Attracts those looking for relaxation and outdoor activities. | The Savill Garden, The Long Walk, Virginia Water Lake, The Deer Park, The Canadian War Memorial |
| Old Windsor | A quieter, suburban area that retains historic charm. Appeals to those looking for a peaceful getaway while still being close to Windsor's main attractions. | Old Windsor Village, The Crooked House, St. Peter's Church, The Village Green, River Thames |
| Datchet | A charming village area just outside Windsor, offering a more local and low-key experience. Great for visitors who want a retreat from the busier town center. | Datchet Common, The River Thames, Local pubs and cafes, St. Mary's Church, Ashridge Park |
| Wraysbury | A small village location perfect for those seeking a tranquil experience by the river, with great views and a sense of community. Ideal for families and couples. | Wraysbury River, Local parks, Fishing and boating, Historic buildings, Nature walks |
| Hyde Park | Although official in nearby London, the vicinity near Windsor connects travelers to expansive green spaces with easy access to both culminate in a blend of city and nature. | Hyde Park, Kensington Gardens, Royal Albert Hall, Serpentine Lake, Speaker's Corner |
Understanding Airbnb License Requirements & STR Laws in Windsor (2025)
While Windsor, England, United Kingdom currently shows low STR regulations, specific Airbnb license requirements might still exist or change. Always verify the latest short term rental regulations and Airbnb license requirements directly with local government authorities for Windsor to ensure full compliance before hosting.
(Source: AirROI data, 2025, finding no licensed listings among those analyzed)
Top Performing Airbnb Properties in Windsor (2025)
Benchmark your potential! Explore examples of top-performing Airbnb properties in Windsorbased on Trailing Twelve Month (TTM) revenue. Analyze their characteristics, revenue, occupancy rate, and ADR to understand what drives success in this market.

Riverside Retreat: Hot Tub, Sauna & Plunge | 16pax
Entire Place • 8 bedrooms
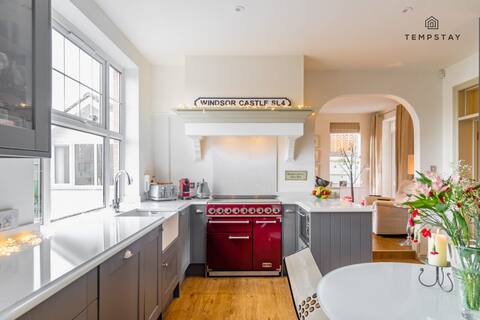
LUXURY HOME ❤ GATED PARKING, WALK 2 THE SIGHTS!
Entire Place • 4 bedrooms
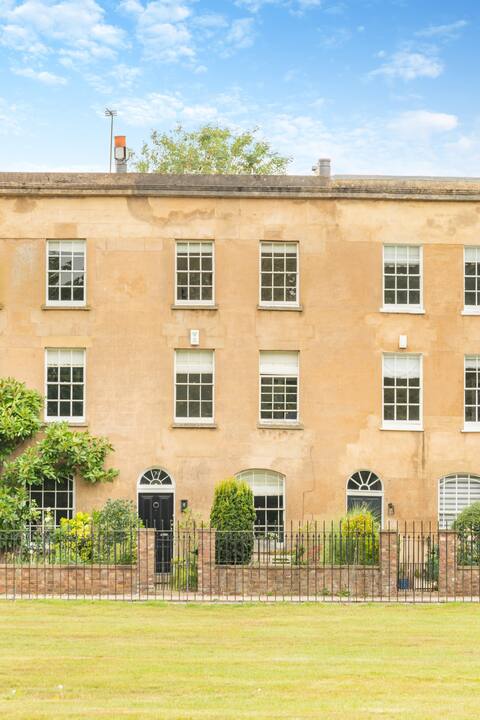
Beautiful Georgian House in Central Windsor
Entire Place • 3 bedrooms
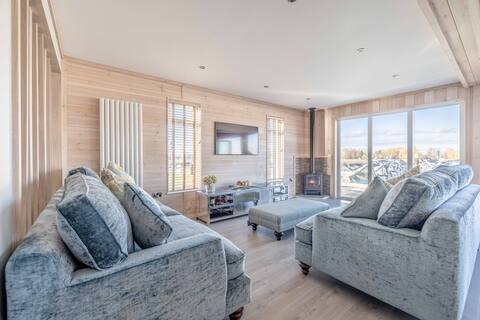
Stylish Lodge At Windsor Racecourse Marina
Entire Place • 3 bedrooms

Walk to Windsor Castle from a Charming Period Townhouse
Entire Place • 5 bedrooms

Castle View: Lux Apartment, Spa!Walk to River/Pubs
Entire Place • 1 bedroom
Note: Performance varies based on location, size, amenities, seasonality, and management quality. Data reflects the past 12 months.
Top Performing Airbnb Hosts in Windsor (2025)
Learn from the best! This table showcases top-performing Airbnb hosts in Windsor based on the number of properties managed and estimated total revenue over the past year. Analyze their scale and performance metrics.
| Host Name | Properties | Grossing Revenue | Stay Reviews | Avg Rating |
|---|---|---|---|---|
| Tempstay | 62 | $2,812,902 | 1424 | 4.08/5.0 |
| Jeremy | 12 | $882,488 | 1163 | 4.84/5.0 |
| Lawsons Windsor | 11 | $464,683 | 277 | 4.81/5.0 |
| Entr | 13 | $432,071 | 414 | 4.68/5.0 |
| The Accommodation Club | 2 | $349,905 | 14 | 2.43/5.0 |
| Andre | 5 | $349,631 | 292 | 4.88/5.0 |
| Nigel | 32 | $337,569 | 292 | 4.26/5.0 |
| Jakob | 17 | $314,460 | 59 | 2.80/5.0 |
| Tim | 2 | $203,517 | 138 | 4.70/5.0 |
| Nikki | 1 | $136,901 | 4 | 5.00/5.0 |
Analyzing the strategies of top hosts, such as their property selection, pricing, and guest communication, can offer valuable lessons for optimizing your own Airbnb operations in Windsor.
Dive Deeper: Advanced Windsor STR Market Data (2025)
Ready to unlock more insights? AirROI provides access to advanced metrics and comprehensive Airbnb data for Windsor. Explore detailed analytics beyond this report to refine your investment strategy, optimize pricing, and maximize your vacation rental profits.
Explore Advanced MetricsWindsor Short-Term Rental Market Composition (2025): Property & Room Types
Room Type Distribution
Property Type Distribution
Market Composition Insights for Windsor
- The Windsor Airbnb market composition is heavily skewed towards Entire Home/Apt listings, which make up 82.8% of the 320 active rentals. This indicates strong guest preference for privacy and space.
- Looking at the property type distribution in Windsor, Apartment/Condo properties are the most common (50%), reflecting the local real estate landscape.
- Houses represent a significant 40.3% portion, catering likely to families or larger groups.
- The presence of 7.2% Hotel/Boutique listings indicates integration with traditional hospitality.
- Smaller segments like others, outdoor/unique (combined 2.5%) offer potential for unique stay experiences.
Windsor Airbnb Room Capacity Analysis (2025): Bedroom Distribution
Distribution of Listings by Number of Bedrooms
Room Capacity Insights for Windsor
- The dominant room capacity in Windsor is 2 bedrooms listings, making up 39.7% of the market. This suggests a strong demand for properties suitable for couples or solo travelers.
- Together, 2 bedrooms and 1 bedroom properties represent 69.1% of the active Airbnb listings in Windsor, indicating a high concentration in these sizes.
- A significant 22.2% of listings offer 3+ bedrooms, catering to larger groups and families seeking more space in Windsor.
Windsor Vacation Rental Guest Capacity Trends (2025)
Distribution of Listings by Guest Capacity
Guest Capacity Insights for Windsor
- The most common guest capacity trend in Windsor vacation rentals is listings accommodating 4 guests (30.6%). This suggests the primary traveler segment is likely small families or groups.
- Properties designed for 4 guests and 2 guests dominate the Windsor STR market, accounting for 47.2% of listings.
- 25.3% of properties accommodate 6+ guests, serving the market segment for larger families or group travel in Windsor.
- On average, properties in Windsor are equipped to host 4.0 guests.
Windsor Airbnb Booking Patterns (2025): Available vs. Booked Days
Available Days Distribution
Booked Days Distribution
Booking Pattern Insights for Windsor
- The most common availability pattern in Windsor falls within the 91-180 days range, representing 33.8% of listings. This suggests many properties have significant open periods on their calendars.
- Approximately 61.9% of listings show high availability (181+ days open annually), indicating potential for increased bookings or specific owner usage patterns.
- For booked days, the 181-270 days range is most frequent in Windsor (33.8%), reflecting common guest stay durations or potential owner blocking patterns.
- A notable 39.4% of properties secure long booking periods (181+ days booked per year), highlighting successful long-term rental strategies or significant owner usage.
Windsor Airbnb Minimum Stay Requirements Analysis
Distribution of Listings by Minimum Night Requirement
1 Night
81 listings
26.3% of total
2 Nights
81 listings
26.3% of total
3 Nights
17 listings
5.5% of total
4-6 Nights
11 listings
3.6% of total
7-29 Nights
33 listings
10.7% of total
30+ Nights
85 listings
27.6% of total
Key Insights
- The most prevalent minimum stay requirement in Windsor is 30+ Nights, adopted by 27.6% of listings. This highlights the market's preference for longer commitments.
- A significant segment (27.6%) caters to monthly stays (30+ nights) in Windsor, pointing to opportunities in the extended-stay market.
Recommendations
- Align with the market by considering a 30+ Nights minimum stay, as 27.6% of Windsor hosts use this setting.
- If feasible, allowing 1-night stays, especially midweek or during low season, could capture last-minute bookings, as only 26.3% currently do.
- Explore offering discounts for stays of 30+ nights to attract the 27.6% of the market seeking extended stays.
- Adjust minimum nights based on seasonality – potentially shorter during low season and longer during peak demand periods in Windsor.
Windsor Airbnb Cancellation Policy Trends Analysis (2025)
Non-refundable
1 listings
0.4% of total
Refundable
2 listings
0.7% of total
Super Strict 30 Days
2 listings
0.7% of total
Flexible
33 listings
11.9% of total
Moderate
75 listings
27% of total
Firm
89 listings
32% of total
Strict
76 listings
27.3% of total
Cancellation Policy Insights for Windsor
- The prevailing Airbnb cancellation policy trend in Windsor is Firm, used by 32% of listings.
- A majority (59.3%) of hosts in Windsor utilize Firm or Strict policies, indicating a market where hosts prioritize booking security.
Recommendations for Hosts
- Consider adopting a Firm policy to align with the 32% market standard in Windsor.
- Regularly review your cancellation policy against competitors and market demand shifts in Windsor.
Windsor STR Booking Lead Time Analysis (2025)
Average Booking Lead Time by Month
Booking Lead Time Insights for Windsor
- The overall average booking lead time for vacation rentals in Windsor is 38 days.
- Guests book furthest in advance for stays during June (average 83 days), likely coinciding with peak travel demand or local events.
- The shortest booking windows occur for stays in March (average 31 days), indicating more last-minute travel plans during this time.
- Seasonally, Summer (67 days avg.) sees the longest lead times, while Winter (41 days avg.) has the shortest, reflecting typical travel planning cycles.
Recommendations for Hosts
- Use the overall average lead time (38 days) as a baseline for your pricing and availability strategy in Windsor.
- For June stays, consider implementing length-of-stay discounts or slightly higher rates for bookings made less than 83 days out to capitalize on advance planning.
- Target marketing efforts for the Summer season well in advance (at least 67 days) to capture early planners.
- Monitor your own booking lead times against these Windsor averages to identify opportunities for dynamic pricing adjustments.
Popular & Essential Airbnb Amenities in Windsor (2025)
Amenity Prevalence
Amenity Insights for Windsor
- Essential amenities in Windsor that guests expect include: Wifi, Smoke alarm, Heating. Lacking these (any) could significantly impact bookings.
- Popular amenities like TV, Essentials, Hot water are common but not universal. Offering these can provide a competitive edge.
Recommendations for Hosts
- Ensure your listing includes all essential amenities for Windsor: Wifi, Smoke alarm, Heating.
- Prioritize adding missing essentials: Wifi, Smoke alarm, Heating.
- Consider adding popular differentiators like TV or Essentials to increase appeal.
- Highlight unique or less common amenities you offer (e.g., hot tub, dedicated workspace, EV charger) in your listing description and photos.
- Regularly check competitor amenities in Windsor to stay competitive.
Windsor Airbnb Guest Demographics & Profile Analysis (2025)
Guest Profile Summary for Windsor
- The typical guest profile for Airbnb in Windsor consists of a mix of domestic (62%) and international guests, often arriving from nearby England, typically belonging to the Post-2000s (Gen Z/Alpha) group (50%), primarily speaking English or Spanish.
- Domestic travelers account for 61.6% of guests.
- Key international markets include United Kingdom (61.6%) and United States (15.9%).
- Top languages spoken are English (64.8%) followed by Spanish (7.1%).
- A significant demographic segment is the Post-2000s (Gen Z/Alpha) group, representing 50% of guests.
Recommendations for Hosts
- Target domestic marketing efforts towards travelers from England and London.
- Tailor amenities and listing descriptions to appeal to the dominant Post-2000s (Gen Z/Alpha) demographic (e.g., highlight fast WiFi, smart home features, local guides).
- Highlight unique local experiences or amenities relevant to the primary guest profile.
- Consider seasonal promotions aligned with peak travel times for key origin markets.
Nearby Short-Term Rental Market Comparison
How does the Windsor Airbnb market stack up against its neighbors? Compare key performance metrics like average monthly revenue, ADR, and occupancy rates in surrounding areas to understand the broader regional STR landscape.
| Market | Active Properties | Monthly Revenue | Daily Rate | Avg. Occupancy |
|---|---|---|---|---|
| Dorney | 12 | $8,335 | $622.48 | 45% |
| Lambourn | 11 | $6,081 | $669.47 | 28% |
| City of Westminster | 1,327 | $6,043 | $486.66 | 52% |
| Wraysbury | 14 | $4,719 | $396.18 | 46% |
| Old Windsor | 22 | $4,655 | $347.12 | 54% |
| Dinton | 11 | $4,637 | $242.16 | 58% |
| Flore | 10 | $4,534 | $347.03 | 40% |
| Kintbury | 12 | $4,015 | $250.13 | 54% |
| Nettlestone | 26 | $3,980 | $391.99 | 42% |
| Cotswold District | 1,829 | $3,905 | $362.83 | 44% |