Whiteparish Airbnb Market Analysis 2025: Short Term Rental Data & Vacation Rental Statistics in England, United Kingdom
Is Airbnb profitable in Whiteparish in 2025? Explore comprehensive Airbnb analytics for Whiteparish, England, United Kingdom to uncover income potential. This 2025 STR market report for Whiteparish, based on AirROI data from April 2024 to March 2025, reveals key trends in the niche market of 18 active listings.
Whether you're considering an Airbnb investment in Whiteparish, optimizing your existing vacation rental, or exploring rental arbitrage opportunities, understanding the Whiteparish Airbnb data is crucial. Leveraging the low regulation environment is key to maximizing your short term rental income potential. Let's dive into the specifics.
Key Whiteparish Airbnb Performance Metrics Overview
Monthly Airbnb Revenue Variations & Income Potential in Whiteparish (2025)
Understanding the monthly revenue variations for Airbnb listings in Whiteparish is key to maximizing your short term rental income potential. Seasonality significantly impacts earnings. Our analysis, based on data from the past 12 months, shows that the peak revenue month for STRs in Whiteparish is typically July, while February often presents the lowest earnings, highlighting opportunities for strategic pricing adjustments during shoulder and low seasons. Explore the typical Airbnb income in Whiteparish across different performance tiers:
- Best-in-class properties (Top 10%) achieve $10,590+ monthly, often utilizing dynamic pricing and superior guest experiences.
- Strong performing properties (Top 25%) earn $3,644 or more, indicating effective management and desirable locations/amenities.
- Typical properties (Median) generate around $2,081 per month, representing the average market performance.
- Entry-level properties (Bottom 25%) see earnings around $1,373, often with potential for optimization.
Average Monthly Airbnb Earnings Trend in Whiteparish
Whiteparish Airbnb Occupancy Rate Trends (2025)
Maximize your bookings by understanding the Whiteparish STR occupancy trends. Seasonal demand shifts significantly influence how often properties are booked. Typically, Julysees the highest demand (peak season occupancy), while February experiences the lowest (low season). Effective strategies, like adjusting minimum stays or offering promotions, can boost occupancy during slower periods. Here's how different property tiers perform in Whiteparish:
- Best-in-class properties (Top 10%) achieve 74%+ occupancy, indicating high desirability and potentially optimized availability.
- Strong performing properties (Top 25%) maintain 60% or higher occupancy, suggesting good market fit and guest satisfaction.
- Typical properties (Median) have an occupancy rate around 41%.
- Entry-level properties (Bottom 25%) average 29% occupancy, potentially facing higher vacancy.
Average Monthly Occupancy Rate Trend in Whiteparish
Average Daily Rate (ADR) Airbnb Trends in Whiteparish (2025)
Effective short term rental pricing strategy in Whiteparish involves understanding monthly ADR fluctuations. The Average Daily Rate (ADR) for Airbnb in Whiteparish typically peaks in August and dips lowest during March. Leveraging Airbnb dynamic pricing tools or strategies based on this seasonality can significantly boost revenue. Here's a look at the typical nightly rates achieved:
- Best-in-class properties (Top 10%) command rates of $925+ per night, often due to premium features or locations.
- Strong performing properties (Top 25%) achieve nightly rates of $188 or more.
- Typical properties (Median) charge around $152 per night.
- Entry-level properties (Bottom 25%) earn around $112 per night.
Average Daily Rate (ADR) Trend by Month in Whiteparish
Get Live Whiteparish Market Intelligence 👇

Explore Real-time Analytics
Airbnb Seasonality Analysis & Trends in Whiteparish (2025)
Peak Season (July, August, January)
- Revenue averages $6,047 per month
- Occupancy rates average 53.5%
- Daily rates average $321
Shoulder Season
- Revenue averages $4,134 per month
- Occupancy maintains around 44.5%
- Daily rates hold near $331
Low Season (February, March, November)
- Revenue drops to average $3,209 per month
- Occupancy decreases to average 32.9%
- Daily rates adjust to average $246
Seasonality Insights for Whiteparish
- The Airbnb seasonality in Whiteparish shows highly seasonal trends requiring careful strategy. While the sections above show seasonal averages, it's also insightful to look at the extremes:
- During the high season, the absolute peak month showcases Whiteparish's highest earning potential, with monthly revenues capable of climbing to $7,017, occupancy reaching a high of 69.3%, and ADRs peaking at $364.
- Conversely, the slowest single month of the year, typically falling within the low season, marks the market's lowest point. In this month, revenue might dip to $3,046, occupancy could drop to 30.4%, and ADRs may adjust down to $244.
- Understanding both the seasonal averages and these monthly peaks and troughs in revenue, occupancy, and ADR is crucial for maximizing your Airbnb profit potential in Whiteparish.
Seasonal Strategies for Maximizing Profit
- Peak Season: Maximize revenue through premium pricing and potentially longer minimum stays. Ensure high availability.
- Low Season: Offer competitive pricing, special promotions (e.g., extended stay discounts), and flexible cancellation policies. Target off-season travelers like remote workers or budget-conscious guests.
- Shoulder Seasons: Implement dynamic pricing that balances peak and low rates. Target weekend travelers or specific events. Offer slightly more flexible terms than peak season.
- Regularly analyze your own performance against these Whiteparish seasonality benchmarks and adjust your pricing and availability strategy accordingly.
Best Areas for Airbnb Investment in Whiteparish (2025)
Exploring the top neighborhoods for short-term rentals in Whiteparish? This section highlights key areas, outlining why they are attractive for hosts and guests, along with notable local attractions. Consider these locations based on your target guest profile and investment strategy.
| Neighborhood / Area | Why Host Here? (Target Guests & Appeal) | Key Attractions & Landmarks |
|---|---|---|
| Downtown Salisbury | A historical city center offering access to the stunning Salisbury Cathedral and a rich array of shops and dining. Ideal for tourists exploring the medieval architecture and local culture. | Salisbury Cathedral, The Market Square, The Salisbury Museum, Old Sarum, Mompesson House |
| New Forest National Park | A picturesque park complete with ancient woodlands and wildlife, perfect for outdoor enthusiasts. Attracts visitors looking for nature walks and tranquility. | Lyndhurst Village, Beaulieu, Exbury Gardens, Hurst Castle, Bolderwood Deer Sanctuary |
| Stonehenge | One of the most famous prehistoric monuments in the world, attracting tourists from all corners. A must-visit site for history lovers and those interested in archaeology. | Stonehenge Visitor Centre, The monument itself, Woodhenge, Amesbury, Salisbury Plain |
| Salisbury Plain | A vast area of protected countryside, popular for walking and cycling. Offers a peaceful setting amidst rolling hills and rich history. | The Great Ridge, The Woodford Valley, Pitton, Bishopstone, The Vale of Pewsey |
| Romsey | A charming market town with a great mix of history and quaint local shops. Draws visitors interested in exploring the rural English lifestyle. | Romsey Abbey, The Rapids, Hurstbourne Priors, Sir Harold Hillier Gardens, The Castle |
| Fordingbridge | Located on the edge of the New Forest, perfect for those seeking outdoor adventure as well as a quiet place to relax. Popular with nature lovers and families. | Fordingbridge Church, The New Forest Water Park, The River Avon, Breamore House, Breamore Heritage Museum |
| Sherfield English | A quiet village near Romsey known for tranquility and beautiful countryside, ideal for guests who prefer a serene environment away from busy tourist spots. | The Test Valley, Local walking paths, St. Leonard's Church, Fish Lake, Village pubs |
| Totton | A suburban area with easy access to Southampton, appealing to guests looking for a base from which to explore both the New Forest and the city. | Totton Health & Leisure, Testwood Lakes, The New Forest, Redbridge School, Local shops and cafes |
Understanding Airbnb License Requirements & STR Laws in Whiteparish (2025)
While Whiteparish, England, United Kingdom currently shows low STR regulations, specific Airbnb license requirements might still exist or change. Always verify the latest short term rental regulations and Airbnb license requirements directly with local government authorities for Whiteparish to ensure full compliance before hosting.
(Source: AirROI data, 2025, finding no licensed listings among those analyzed)
Top Performing Airbnb Properties in Whiteparish (2025)
Benchmark your potential! Explore examples of top-performing Airbnb properties in Whiteparishbased on Trailing Twelve Month (TTM) revenue. Analyze their characteristics, revenue, occupancy rate, and ADR to understand what drives success in this market.
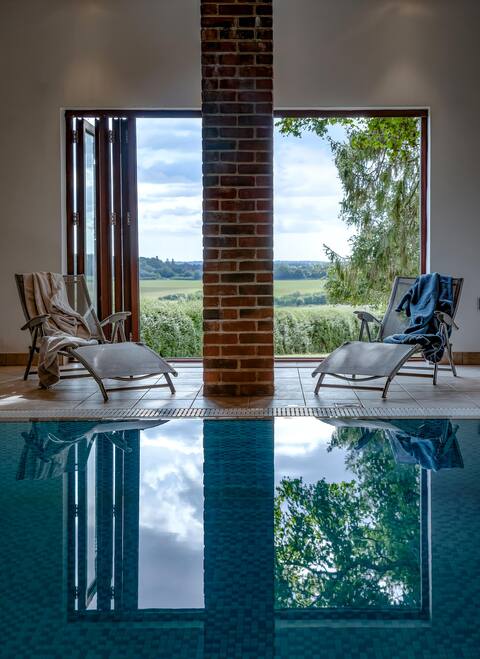
New Forest Country Home with Indoor Swimming Pool
Entire Place • 5 bedrooms
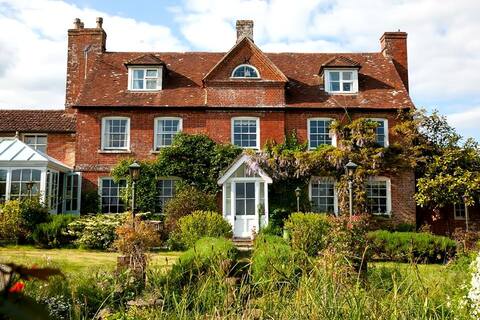
Stunning Farmhouse near New Forest
Entire Place • 5 bedrooms
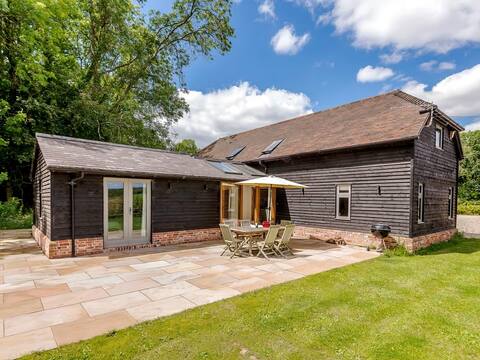
Stride’s Barn
Entire Place • 3 bedrooms
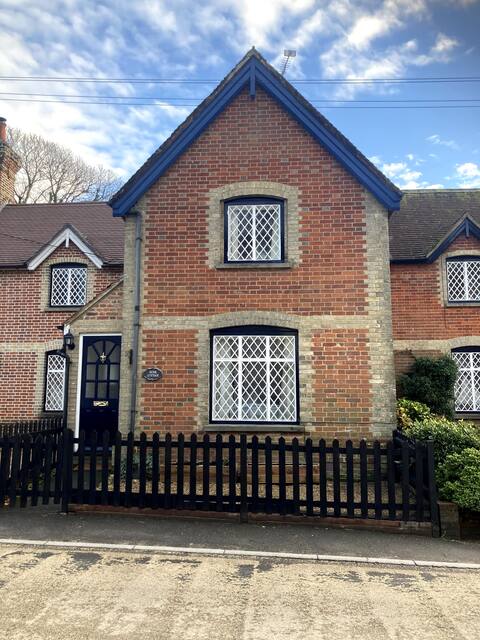
Home Cottage
Entire Place • 2 bedrooms
Self contained Annex In Rural Whiteparish Sleeps 6
Entire Place • 3 bedrooms

Cottage Near Peppa Pig World and New Forest
Entire Place • 2 bedrooms
Note: Performance varies based on location, size, amenities, seasonality, and management quality. Data reflects the past 12 months.
Top Performing Airbnb Hosts in Whiteparish (2025)
Learn from the best! This table showcases top-performing Airbnb hosts in Whiteparish based on the number of properties managed and estimated total revenue over the past year. Analyze their scale and performance metrics.
| Host Name | Properties | Grossing Revenue | Stay Reviews | Avg Rating |
|---|---|---|---|---|
| Nicola | 2 | $342,475 | 112 | 4.95/5.0 |
| Sharon | 2 | $129,795 | 94 | 4.96/5.0 |
| Jo | 3 | $106,388 | 727 | 4.96/5.0 |
| David | 3 | $51,212 | 143 | 4.95/5.0 |
| Anna | 1 | $37,895 | 33 | 5.00/5.0 |
| Trudi | 1 | $34,040 | 249 | 4.69/5.0 |
| Nancy | 1 | $32,651 | 119 | 4.95/5.0 |
| Jane | 1 | $32,401 | 29 | 5.00/5.0 |
| Ian | 1 | $16,480 | 15 | 4.93/5.0 |
| Claire | 1 | $16,442 | 47 | 4.94/5.0 |
Analyzing the strategies of top hosts, such as their property selection, pricing, and guest communication, can offer valuable lessons for optimizing your own Airbnb operations in Whiteparish.
Dive Deeper: Advanced Whiteparish STR Market Data (2025)
Ready to unlock more insights? AirROI provides access to advanced metrics and comprehensive Airbnb data for Whiteparish. Explore detailed analytics beyond this report to refine your investment strategy, optimize pricing, and maximize your vacation rental profits.
Explore Advanced MetricsWhiteparish Short-Term Rental Market Composition (2025): Property & Room Types
Room Type Distribution
Property Type Distribution
Market Composition Insights for Whiteparish
- The Whiteparish Airbnb market composition is heavily skewed towards Entire Home/Apt listings, which make up 100% of the 18 active rentals. This indicates strong guest preference for privacy and space.
- Looking at the property type distribution in Whiteparish, House properties are the most common (55.6%), reflecting the local real estate landscape.
- Houses represent a significant 55.6% portion, catering likely to families or larger groups.
- The presence of 33.3% Hotel/Boutique listings indicates integration with traditional hospitality.
Whiteparish Airbnb Room Capacity Analysis (2025): Bedroom Distribution
Distribution of Listings by Number of Bedrooms
Room Capacity Insights for Whiteparish
- The dominant room capacity in Whiteparish is 1 bedroom listings, making up 50% of the market. This suggests a strong demand for properties suitable for couples or solo travelers.
- Together, 1 bedroom and 2 bedrooms properties represent 66.7% of the active Airbnb listings in Whiteparish, indicating a high concentration in these sizes.
- A significant 22.2% of listings offer 3+ bedrooms, catering to larger groups and families seeking more space in Whiteparish.
Whiteparish Vacation Rental Guest Capacity Trends (2025)
Distribution of Listings by Guest Capacity
Guest Capacity Insights for Whiteparish
- The most common guest capacity trend in Whiteparish vacation rentals is listings accommodating 2 guests (50%). This suggests the primary traveler segment is likely couples or solo travelers.
- Properties designed for 2 guests and 4 guests dominate the Whiteparish STR market, accounting for 72.2% of listings.
- A significant 50.0% of listings cater specifically to 1-2 guests, highlighting strong demand from couples and solo travelers in Whiteparish.
- 22.2% of properties accommodate 6+ guests, serving the market segment for larger families or group travel in Whiteparish.
- On average, properties in Whiteparish are equipped to host 3.7 guests.
Whiteparish Airbnb Booking Patterns (2025): Available vs. Booked Days
Available Days Distribution
Booked Days Distribution
Booking Pattern Insights for Whiteparish
- The most common availability pattern in Whiteparish falls within the 181-270 days range, representing 44.4% of listings. This suggests many properties have significant open periods on their calendars.
- Approximately 61.1% of listings show high availability (181+ days open annually), indicating potential for increased bookings or specific owner usage patterns.
- For booked days, the 91-180 days range is most frequent in Whiteparish (38.9%), reflecting common guest stay durations or potential owner blocking patterns.
- A notable 44.5% of properties secure long booking periods (181+ days booked per year), highlighting successful long-term rental strategies or significant owner usage.
Whiteparish Airbnb Minimum Stay Requirements Analysis
Distribution of Listings by Minimum Night Requirement
1 Night
4 listings
22.2% of total
2 Nights
6 listings
33.3% of total
3 Nights
5 listings
27.8% of total
30+ Nights
3 listings
16.7% of total
Key Insights
- The most prevalent minimum stay requirement in Whiteparish is 2 Nights, adopted by 33.3% of listings. This highlights the market's preference for shorter, flexible bookings.
- A significant segment (16.7%) caters to monthly stays (30+ nights) in Whiteparish, pointing to opportunities in the extended-stay market.
Recommendations
- Align with the market by considering a 2 Nights minimum stay, as 33.3% of Whiteparish hosts use this setting.
- If feasible, allowing 1-night stays, especially midweek or during low season, could capture last-minute bookings, as only 22.2% currently do.
- Explore offering discounts for stays of 30+ nights to attract the 16.7% of the market seeking extended stays.
- Adjust minimum nights based on seasonality – potentially shorter during low season and longer during peak demand periods in Whiteparish.
Whiteparish Airbnb Cancellation Policy Trends Analysis (2025)
Flexible
5 listings
27.8% of total
Moderate
8 listings
44.4% of total
Firm
2 listings
11.1% of total
Strict
3 listings
16.7% of total
Cancellation Policy Insights for Whiteparish
- The prevailing Airbnb cancellation policy trend in Whiteparish is Moderate, used by 44.4% of listings.
- The market strongly favors guest-friendly terms, with 72.2% of listings offering Flexible or Moderate policies. This suggests guests in Whiteparish may expect booking flexibility.
Recommendations for Hosts
- Consider adopting a Moderate policy to align with the 44.4% market standard in Whiteparish.
- Regularly review your cancellation policy against competitors and market demand shifts in Whiteparish.
Whiteparish STR Booking Lead Time Analysis (2025)
Average Booking Lead Time by Month
Booking Lead Time Insights for Whiteparish
- The overall average booking lead time for vacation rentals in Whiteparish is 46 days.
- Guests book furthest in advance for stays during June (average 82 days), likely coinciding with peak travel demand or local events.
- The shortest booking windows occur for stays in January (average 19 days), indicating more last-minute travel plans during this time.
- Seasonally, Summer (74 days avg.) sees the longest lead times, while Winter (36 days avg.) has the shortest, reflecting typical travel planning cycles.
Recommendations for Hosts
- Use the overall average lead time (46 days) as a baseline for your pricing and availability strategy in Whiteparish.
- For June stays, consider implementing length-of-stay discounts or slightly higher rates for bookings made less than 82 days out to capitalize on advance planning.
- Target marketing efforts for the Summer season well in advance (at least 74 days) to capture early planners.
- Monitor your own booking lead times against these Whiteparish averages to identify opportunities for dynamic pricing adjustments.
Popular & Essential Airbnb Amenities in Whiteparish (2025)
Amenity Prevalence
Amenity Insights for Whiteparish
- Essential amenities in Whiteparish that guests expect include: Free parking on premises. Lacking these (this) could significantly impact bookings.
- Popular amenities like Wifi, Smoke alarm, Essentials are common but not universal. Offering these can provide a competitive edge.
- Warning: Wifi is not universally provided but is considered essential globally. Ensure reliable Wifi is offered.
Recommendations for Hosts
- Ensure your listing includes all essential amenities for Whiteparish: Free parking on premises.
- Consider adding popular differentiators like Wifi or Smoke alarm to increase appeal.
- Highlight unique or less common amenities you offer (e.g., hot tub, dedicated workspace, EV charger) in your listing description and photos.
- Regularly check competitor amenities in Whiteparish to stay competitive.
Whiteparish Airbnb Guest Demographics & Profile Analysis (2025)
Guest Profile Summary for Whiteparish
- The typical guest profile for Airbnb in Whiteparish consists of primarily domestic travelers (90%), often arriving from nearby England, typically belonging to the Post-2000s (Gen Z/Alpha) group (50%), primarily speaking English or French.
- Domestic travelers account for 89.7% of guests.
- Key international markets include United Kingdom (89.7%) and United States (1.7%).
- Top languages spoken are English (61.2%) followed by French (9.2%).
- A significant demographic segment is the Post-2000s (Gen Z/Alpha) group, representing 50% of guests.
Recommendations for Hosts
- Target domestic marketing efforts towards travelers from England and London.
- Tailor amenities and listing descriptions to appeal to the dominant Post-2000s (Gen Z/Alpha) demographic (e.g., highlight fast WiFi, smart home features, local guides).
- Highlight unique local experiences or amenities relevant to the primary guest profile.
- Consider seasonal promotions aligned with peak travel times for key origin markets.
Nearby Short-Term Rental Market Comparison
How does the Whiteparish Airbnb market stack up against its neighbors? Compare key performance metrics like average monthly revenue, ADR, and occupancy rates in surrounding areas to understand the broader regional STR landscape.
| Market | Active Properties | Monthly Revenue | Daily Rate | Avg. Occupancy |
|---|---|---|---|---|
| Englishcombe | 13 | $8,558 | $573.69 | 49% |
| Dorney | 12 | $8,335 | $622.48 | 45% |
| Chew Magna | 14 | $6,649 | $399.59 | 46% |
| Lambourn | 11 | $6,081 | $669.47 | 28% |
| City of Westminster | 1,327 | $6,043 | $486.66 | 52% |
| Long Sutton | 17 | $5,726 | $383.88 | 46% |
| Stoke St. Michael | 10 | $5,277 | $424.04 | 42% |
| Winsham | 10 | $5,154 | $484.22 | 52% |
| Oldland Common | 13 | $5,093 | $355.47 | 43% |
| Wraysbury | 14 | $4,719 | $396.18 | 46% |