Whippingham Airbnb Market Analysis 2025: Short Term Rental Data & Vacation Rental Statistics in England, United Kingdom
Is Airbnb profitable in Whippingham in 2025? Explore comprehensive Airbnb analytics for Whippingham, England, United Kingdom to uncover income potential. This 2025 STR market report for Whippingham, based on AirROI data from April 2024 to March 2025, reveals key trends in the niche market of 19 active listings.
Whether you're considering an Airbnb investment in Whippingham, optimizing your existing vacation rental, or exploring rental arbitrage opportunities, understanding the Whippingham Airbnb data is crucial. Leveraging the low regulation environment is key to maximizing your short term rental income potential. Let's dive into the specifics.
Key Whippingham Airbnb Performance Metrics Overview
Monthly Airbnb Revenue Variations & Income Potential in Whippingham (2025)
Understanding the monthly revenue variations for Airbnb listings in Whippingham is key to maximizing your short term rental income potential. Seasonality significantly impacts earnings. Our analysis, based on data from the past 12 months, shows that the peak revenue month for STRs in Whippingham is typically August, while February often presents the lowest earnings, highlighting opportunities for strategic pricing adjustments during shoulder and low seasons. Explore the typical Airbnb income in Whippingham across different performance tiers:
- Best-in-class properties (Top 10%) achieve $6,601+ monthly, often utilizing dynamic pricing and superior guest experiences.
- Strong performing properties (Top 25%) earn $3,520 or more, indicating effective management and desirable locations/amenities.
- Typical properties (Median) generate around $2,008 per month, representing the average market performance.
- Entry-level properties (Bottom 25%) see earnings around $1,037, often with potential for optimization.
Average Monthly Airbnb Earnings Trend in Whippingham
Whippingham Airbnb Occupancy Rate Trends (2025)
Maximize your bookings by understanding the Whippingham STR occupancy trends. Seasonal demand shifts significantly influence how often properties are booked. Typically, Augustsees the highest demand (peak season occupancy), while February experiences the lowest (low season). Effective strategies, like adjusting minimum stays or offering promotions, can boost occupancy during slower periods. Here's how different property tiers perform in Whippingham:
- Best-in-class properties (Top 10%) achieve 80%+ occupancy, indicating high desirability and potentially optimized availability.
- Strong performing properties (Top 25%) maintain 52% or higher occupancy, suggesting good market fit and guest satisfaction.
- Typical properties (Median) have an occupancy rate around 34%.
- Entry-level properties (Bottom 25%) average 16% occupancy, potentially facing higher vacancy.
Average Monthly Occupancy Rate Trend in Whippingham
Average Daily Rate (ADR) Airbnb Trends in Whippingham (2025)
Effective short term rental pricing strategy in Whippingham involves understanding monthly ADR fluctuations. The Average Daily Rate (ADR) for Airbnb in Whippingham typically peaks in August and dips lowest during November. Leveraging Airbnb dynamic pricing tools or strategies based on this seasonality can significantly boost revenue. Here's a look at the typical nightly rates achieved:
- Best-in-class properties (Top 10%) command rates of $424+ per night, often due to premium features or locations.
- Strong performing properties (Top 25%) achieve nightly rates of $323 or more.
- Typical properties (Median) charge around $228 per night.
- Entry-level properties (Bottom 25%) earn around $135 per night.
Average Daily Rate (ADR) Trend by Month in Whippingham
Get Live Whippingham Market Intelligence 👇

Explore Real-time Analytics
Airbnb Seasonality Analysis & Trends in Whippingham (2025)
Peak Season (August, May, July)
- Revenue averages $3,552 per month
- Occupancy rates average 44.9%
- Daily rates average $276
Shoulder Season
- Revenue averages $2,834 per month
- Occupancy maintains around 39.5%
- Daily rates hold near $262
Low Season (February, March, November)
- Revenue drops to average $1,545 per month
- Occupancy decreases to average 27.7%
- Daily rates adjust to average $245
Seasonality Insights for Whippingham
- The Airbnb seasonality in Whippingham shows highly seasonal trends requiring careful strategy. While the sections above show seasonal averages, it's also insightful to look at the extremes:
- During the high season, the absolute peak month showcases Whippingham's highest earning potential, with monthly revenues capable of climbing to $4,183, occupancy reaching a high of 55.5%, and ADRs peaking at $281.
- Conversely, the slowest single month of the year, typically falling within the low season, marks the market's lowest point. In this month, revenue might dip to $774, occupancy could drop to 18.4%, and ADRs may adjust down to $237.
- Understanding both the seasonal averages and these monthly peaks and troughs in revenue, occupancy, and ADR is crucial for maximizing your Airbnb profit potential in Whippingham.
Seasonal Strategies for Maximizing Profit
- Peak Season: Maximize revenue through premium pricing and potentially longer minimum stays. Ensure high availability.
- Low Season: Offer competitive pricing, special promotions (e.g., extended stay discounts), and flexible cancellation policies. Target off-season travelers like remote workers or budget-conscious guests.
- Shoulder Seasons: Implement dynamic pricing that balances peak and low rates. Target weekend travelers or specific events. Offer slightly more flexible terms than peak season.
- Regularly analyze your own performance against these Whippingham seasonality benchmarks and adjust your pricing and availability strategy accordingly.
Best Areas for Airbnb Investment in Whippingham (2025)
Exploring the top neighborhoods for short-term rentals in Whippingham? This section highlights key areas, outlining why they are attractive for hosts and guests, along with notable local attractions. Consider these locations based on your target guest profile and investment strategy.
| Neighborhood / Area | Why Host Here? (Target Guests & Appeal) | Key Attractions & Landmarks |
|---|---|---|
| Whippingham Village | Charming village setting with picturesque views and local charm. Ideal for guests looking for a peaceful retreat close to nature and historical sites. | Whippingham Church, Isle of Wight Coastal Path, Northwood Park, The Medina Estuary, The Egyptian House |
| East Cowes | Nearby seaside town with vibrant community feel. Offers guests a mix of local shops, dining options, and access to the marina and waterfront activities. | Egypt Point, Cowes Maritime Museum, Northwood House, East Cowes Marina, Seaclose Park |
| Cowes | Famous for its yachting events and regattas, Cowes is a popular destination for sailing enthusiasts and tourists alike, providing a lively atmosphere and cultural experiences. | Cowes Week, Royal Yacht Squadron, Cowes Maritime Museum, Northwood Park, Cowes Beach |
| Newport | The county town of the Isle of Wight, offering a range of amenities and attractions. Good access to public transport and a hub for exploring the island. | Newport Roman Villa, Carisbrooke Castle, The Isle of Wight Museum, Quay Arts, Newport Market |
| Ventnor | Coastal town known for its beautiful beaches and subtropical climate. Popular with tourists for its scenic coastline and relaxed ambiance. | Ventnor Beach, Steephill Cove, Ventnor Botanical Gardens, Ventnor Heritage Museum, The Spyglass Inn |
| Shanklin | Popular seaside resort with beautiful beaches, ideal for family vacations. Offers a range of entertainment options and proximity to lush countryside. | Shanklin Chine, Shanklin Beach, Old Village, Rylstone Gardens, Shanklin Theatre |
| Sandown | Known for its long sandy beach and family-friendly attractions, Sandown is perfect for those seeking a classic British seaside holiday experience. | Sandown Pier, Dinosaur Isle, Sandown Beach, Shanklin and Sandown Golf Club, Sandown Zoo |
| Ryde | The largest town on the Isle of Wight, Ryde offers a mix of beach activities, cultural experiences, and excellent transport links to the mainland. | Ryde Beach, Ryde Pier, Isle of Wight Bus Museum, Ryde Castle, Appley Park |
Understanding Airbnb License Requirements & STR Laws in Whippingham (2025)
While Whippingham, England, United Kingdom currently shows low STR regulations, specific Airbnb license requirements might still exist or change. Always verify the latest short term rental regulations and Airbnb license requirements directly with local government authorities for Whippingham to ensure full compliance before hosting.
(Source: AirROI data, 2025, finding no licensed listings among those analyzed)
Top Performing Airbnb Properties in Whippingham (2025)
Benchmark your potential! Explore examples of top-performing Airbnb properties in Whippinghambased on Trailing Twelve Month (TTM) revenue. Analyze their characteristics, revenue, occupancy rate, and ADR to understand what drives success in this market.

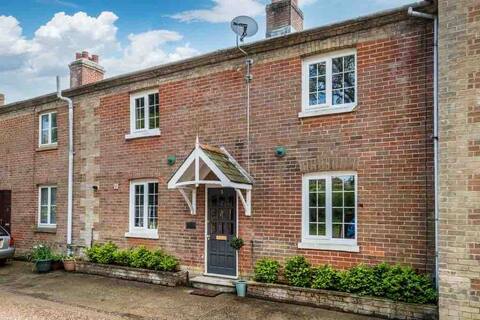
La Bon Frank ~ A town house on the water
Entire Place • 3 bedrooms
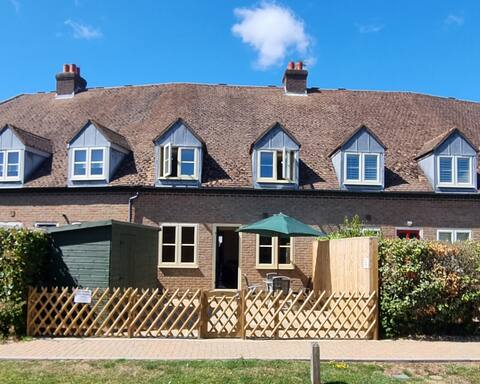
Woodpeckers Cottage. 3-bed & lovely garden
Entire Place • 3 bedrooms

Olive House- 4 bedroom property on the harbour!
Entire Place • 4 bedrooms

Bosun’s Retreat, a break by the water
Entire Place • 3 bedrooms
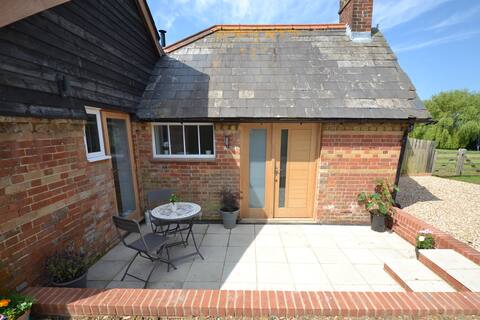
Albert’s Dairy Cottage, Whippingham
Entire Place • 1 bedroom
Spring Cottage
Entire Place • 2 bedrooms
Note: Performance varies based on location, size, amenities, seasonality, and management quality. Data reflects the past 12 months.
Top Performing Airbnb Hosts in Whippingham (2025)
Learn from the best! This table showcases top-performing Airbnb hosts in Whippingham based on the number of properties managed and estimated total revenue over the past year. Analyze their scale and performance metrics.
| Host Name | Properties | Grossing Revenue | Stay Reviews | Avg Rating |
|---|---|---|---|---|
| Sofie | 1 | $63,047 | 10 | 5.00/5.0 |
| Sarah | 1 | $61,325 | 25 | 4.96/5.0 |
| Kimberley | 1 | $44,722 | 73 | 5.00/5.0 |
| Sian | 1 | $37,421 | 44 | 4.93/5.0 |
| Rachael & Andy | 1 | $31,725 | 186 | 4.97/5.0 |
| Darren | 1 | $23,873 | 14 | 5.00/5.0 |
| June | 1 | $21,198 | 266 | 4.73/5.0 |
| Wendy | 1 | $21,104 | 64 | 4.92/5.0 |
| Host #457259218 | 1 | $18,487 | 10 | 4.40/5.0 |
| The Island Holiday Company | 1 | $17,128 | 3 | 5.00/5.0 |
Analyzing the strategies of top hosts, such as their property selection, pricing, and guest communication, can offer valuable lessons for optimizing your own Airbnb operations in Whippingham.
Dive Deeper: Advanced Whippingham STR Market Data (2025)
Ready to unlock more insights? AirROI provides access to advanced metrics and comprehensive Airbnb data for Whippingham. Explore detailed analytics beyond this report to refine your investment strategy, optimize pricing, and maximize your vacation rental profits.
Explore Advanced MetricsWhippingham Short-Term Rental Market Composition (2025): Property & Room Types
Room Type Distribution
Property Type Distribution
Market Composition Insights for Whippingham
- The Whippingham Airbnb market composition is heavily skewed towards Entire Home/Apt listings, which make up 84.2% of the 19 active rentals. This indicates strong guest preference for privacy and space.
- Looking at the property type distribution in Whippingham, House properties are the most common (84.2%), reflecting the local real estate landscape.
- Houses represent a significant 84.2% portion, catering likely to families or larger groups.
Whippingham Airbnb Room Capacity Analysis (2025): Bedroom Distribution
Distribution of Listings by Number of Bedrooms
Room Capacity Insights for Whippingham
- The dominant room capacity in Whippingham is 3 bedrooms listings, making up 36.8% of the market. This suggests a strong demand for properties suitable for families or small groups.
- Together, 3 bedrooms and 2 bedrooms properties represent 68.4% of the active Airbnb listings in Whippingham, indicating a high concentration in these sizes.
- A significant 47.3% of listings offer 3+ bedrooms, catering to larger groups and families seeking more space in Whippingham.
Whippingham Vacation Rental Guest Capacity Trends (2025)
Distribution of Listings by Guest Capacity
Guest Capacity Insights for Whippingham
- The most common guest capacity trend in Whippingham vacation rentals is listings accommodating 6 guests (42.1%). This suggests the primary traveler segment is likely larger groups.
- Properties designed for 6 guests and 4 guests dominate the Whippingham STR market, accounting for 68.4% of listings.
- 52.6% of properties accommodate 6+ guests, serving the market segment for larger families or group travel in Whippingham.
- On average, properties in Whippingham are equipped to host 4.6 guests.
Whippingham Airbnb Booking Patterns (2025): Available vs. Booked Days
Available Days Distribution
Booked Days Distribution
Booking Pattern Insights for Whippingham
- The most common availability pattern in Whippingham falls within the 271-366 days range, representing 57.9% of listings. This suggests many properties have significant open periods on their calendars.
- Approximately 84.2% of listings show high availability (181+ days open annually), indicating potential for increased bookings or specific owner usage patterns.
- For booked days, the 91-180 days range is most frequent in Whippingham (31.6%), reflecting common guest stay durations or potential owner blocking patterns.
- A notable 15.8% of properties secure long booking periods (181+ days booked per year), highlighting successful long-term rental strategies or significant owner usage.
Whippingham Airbnb Minimum Stay Requirements Analysis
Distribution of Listings by Minimum Night Requirement
1 Night
1 listings
6.7% of total
2 Nights
5 listings
33.3% of total
3 Nights
7 listings
46.7% of total
4-6 Nights
1 listings
6.7% of total
30+ Nights
1 listings
6.7% of total
Key Insights
- The most prevalent minimum stay requirement in Whippingham is 3 Nights, adopted by 46.7% of listings. This highlights the market's preference for longer commitments.
Recommendations
- Align with the market by considering a 3 Nights minimum stay, as 46.7% of Whippingham hosts use this setting.
- If feasible, allowing 1-night stays, especially midweek or during low season, could capture last-minute bookings, as only 6.7% currently do.
- A 2-night minimum appears standard (33.3%). Consider this for weekends or peak periods.
- Explore offering discounts for stays of 30+ nights to attract the 6.7% of the market seeking extended stays.
- Adjust minimum nights based on seasonality – potentially shorter during low season and longer during peak demand periods in Whippingham.
Whippingham Airbnb Cancellation Policy Trends Analysis (2025)
Super Strict 60 Days
1 listings
6.3% of total
Super Strict 30 Days
1 listings
6.3% of total
Flexible
1 listings
6.3% of total
Moderate
5 listings
31.3% of total
Firm
4 listings
25% of total
Strict
4 listings
25% of total
Cancellation Policy Insights for Whippingham
- The prevailing Airbnb cancellation policy trend in Whippingham is Moderate, used by 31.3% of listings.
- There's a relatively balanced mix between guest-friendly (37.6%) and stricter (50.0%) policies, offering choices for different guest needs.
Recommendations for Hosts
- Consider adopting a Moderate policy to align with the 31.3% market standard in Whippingham.
- Regularly review your cancellation policy against competitors and market demand shifts in Whippingham.
Whippingham STR Booking Lead Time Analysis (2025)
Average Booking Lead Time by Month
Booking Lead Time Insights for Whippingham
- The overall average booking lead time for vacation rentals in Whippingham is 77 days.
- Guests book furthest in advance for stays during June (average 166 days), likely coinciding with peak travel demand or local events.
- The shortest booking windows occur for stays in February (average 14 days), indicating more last-minute travel plans during this time.
- Seasonally, Summer (104 days avg.) sees the longest lead times, while Fall (65 days avg.) has the shortest, reflecting typical travel planning cycles.
Recommendations for Hosts
- Use the overall average lead time (77 days) as a baseline for your pricing and availability strategy in Whippingham.
- For June stays, consider implementing length-of-stay discounts or slightly higher rates for bookings made less than 166 days out to capitalize on advance planning.
- During February, focus on last-minute booking availability and promotions, as guests book with very short notice (14 days avg.).
- Target marketing efforts for the Summer season well in advance (at least 104 days) to capture early planners.
- Monitor your own booking lead times against these Whippingham averages to identify opportunities for dynamic pricing adjustments.
Popular & Essential Airbnb Amenities in Whippingham (2025)
Amenity Prevalence
Amenity Insights for Whippingham
- Essential amenities in Whippingham that guests expect include: Hot water, Smoke alarm, Heating. Lacking these (any) could significantly impact bookings.
- Popular amenities like Washer, TV, Wifi are common but not universal. Offering these can provide a competitive edge.
- Warning: Wifi is not universally provided but is considered essential globally. Ensure reliable Wifi is offered.
Recommendations for Hosts
- Ensure your listing includes all essential amenities for Whippingham: Hot water, Smoke alarm, Heating.
- Consider adding popular differentiators like Washer or TV to increase appeal.
- Highlight unique or less common amenities you offer (e.g., hot tub, dedicated workspace, EV charger) in your listing description and photos.
- Regularly check competitor amenities in Whippingham to stay competitive.
Whippingham Airbnb Guest Demographics & Profile Analysis (2025)
Guest Profile Summary for Whippingham
- The typical guest profile for Airbnb in Whippingham consists of primarily domestic travelers (90%), often arriving from nearby England, typically belonging to the Post-2000s (Gen Z/Alpha) group (50%), primarily speaking English or German.
- Domestic travelers account for 89.5% of guests.
- Key international markets include United Kingdom (89.5%) and New Zealand (1.8%).
- Top languages spoken are English (71.1%) followed by German (7.9%).
- A significant demographic segment is the Post-2000s (Gen Z/Alpha) group, representing 50% of guests.
Recommendations for Hosts
- Target domestic marketing efforts towards travelers from England and London.
- Tailor amenities and listing descriptions to appeal to the dominant Post-2000s (Gen Z/Alpha) demographic (e.g., highlight fast WiFi, smart home features, local guides).
- Highlight unique local experiences or amenities relevant to the primary guest profile.
- Consider seasonal promotions aligned with peak travel times for key origin markets.
Nearby Short-Term Rental Market Comparison
How does the Whippingham Airbnb market stack up against its neighbors? Compare key performance metrics like average monthly revenue, ADR, and occupancy rates in surrounding areas to understand the broader regional STR landscape.
| Market | Active Properties | Monthly Revenue | Daily Rate | Avg. Occupancy |
|---|---|---|---|---|
| Englishcombe | 13 | $8,558 | $573.69 | 49% |
| Dorney | 12 | $8,335 | $622.48 | 45% |
| Chew Magna | 14 | $6,649 | $399.59 | 46% |
| Lambourn | 11 | $6,081 | $669.47 | 28% |
| City of Westminster | 1,327 | $6,043 | $486.66 | 52% |
| Long Sutton | 17 | $5,726 | $383.88 | 46% |
| Stoke St. Michael | 10 | $5,277 | $424.04 | 42% |
| Winsham | 10 | $5,154 | $484.22 | 52% |
| Oldland Common | 13 | $5,093 | $355.47 | 43% |
| Wraysbury | 14 | $4,719 | $396.18 | 46% |