Wheddon Cross Airbnb Market Analysis 2025: Short Term Rental Data & Vacation Rental Statistics in England, United Kingdom
Is Airbnb profitable in Wheddon Cross in 2025? Explore comprehensive Airbnb analytics for Wheddon Cross, England, United Kingdom to uncover income potential. This 2025 STR market report for Wheddon Cross, based on AirROI data from April 2024 to March 2025, reveals key trends in the niche market of 26 active listings.
Whether you're considering an Airbnb investment in Wheddon Cross, optimizing your existing vacation rental, or exploring rental arbitrage opportunities, understanding the Wheddon Cross Airbnb data is crucial. Leveraging the low regulation environment is key to maximizing your short term rental income potential. Let's dive into the specifics.
Key Wheddon Cross Airbnb Performance Metrics Overview
Monthly Airbnb Revenue Variations & Income Potential in Wheddon Cross (2025)
Understanding the monthly revenue variations for Airbnb listings in Wheddon Cross is key to maximizing your short term rental income potential. Seasonality significantly impacts earnings. Our analysis, based on data from the past 12 months, shows that the peak revenue month for STRs in Wheddon Cross is typically August, while February often presents the lowest earnings, highlighting opportunities for strategic pricing adjustments during shoulder and low seasons. Explore the typical Airbnb income in Wheddon Cross across different performance tiers:
- Best-in-class properties (Top 10%) achieve $4,594+ monthly, often utilizing dynamic pricing and superior guest experiences.
- Strong performing properties (Top 25%) earn $2,479 or more, indicating effective management and desirable locations/amenities.
- Typical properties (Median) generate around $1,143 per month, representing the average market performance.
- Entry-level properties (Bottom 25%) see earnings around $633, often with potential for optimization.
Average Monthly Airbnb Earnings Trend in Wheddon Cross
Wheddon Cross Airbnb Occupancy Rate Trends (2025)
Maximize your bookings by understanding the Wheddon Cross STR occupancy trends. Seasonal demand shifts significantly influence how often properties are booked. Typically, Augustsees the highest demand (peak season occupancy), while January experiences the lowest (low season). Effective strategies, like adjusting minimum stays or offering promotions, can boost occupancy during slower periods. Here's how different property tiers perform in Wheddon Cross:
- Best-in-class properties (Top 10%) achieve 54%+ occupancy, indicating high desirability and potentially optimized availability.
- Strong performing properties (Top 25%) maintain 39% or higher occupancy, suggesting good market fit and guest satisfaction.
- Typical properties (Median) have an occupancy rate around 22%.
- Entry-level properties (Bottom 25%) average 12% occupancy, potentially facing higher vacancy.
Average Monthly Occupancy Rate Trend in Wheddon Cross
Average Daily Rate (ADR) Airbnb Trends in Wheddon Cross (2025)
Effective short term rental pricing strategy in Wheddon Cross involves understanding monthly ADR fluctuations. The Average Daily Rate (ADR) for Airbnb in Wheddon Cross typically peaks in December and dips lowest during March. Leveraging Airbnb dynamic pricing tools or strategies based on this seasonality can significantly boost revenue. Here's a look at the typical nightly rates achieved:
- Best-in-class properties (Top 10%) command rates of $369+ per night, often due to premium features or locations.
- Strong performing properties (Top 25%) achieve nightly rates of $222 or more.
- Typical properties (Median) charge around $161 per night.
- Entry-level properties (Bottom 25%) earn around $120 per night.
Average Daily Rate (ADR) Trend by Month in Wheddon Cross
Get Live Wheddon Cross Market Intelligence 👇

Explore Real-time Analytics
Airbnb Seasonality Analysis & Trends in Wheddon Cross (2025)
Peak Season (August, November, May)
- Revenue averages $2,944 per month
- Occupancy rates average 38.6%
- Daily rates average $198
Shoulder Season
- Revenue averages $2,050 per month
- Occupancy maintains around 26.3%
- Daily rates hold near $201
Low Season (February, March, April)
- Revenue drops to average $1,096 per month
- Occupancy decreases to average 18.2%
- Daily rates adjust to average $185
Seasonality Insights for Wheddon Cross
- The Airbnb seasonality in Wheddon Cross shows highly seasonal trends requiring careful strategy. While the sections above show seasonal averages, it's also insightful to look at the extremes:
- During the high season, the absolute peak month showcases Wheddon Cross's highest earning potential, with monthly revenues capable of climbing to $3,079, occupancy reaching a high of 45.2%, and ADRs peaking at $227.
- Conversely, the slowest single month of the year, typically falling within the low season, marks the market's lowest point. In this month, revenue might dip to $820, occupancy could drop to 17.1%, and ADRs may adjust down to $179.
- Understanding both the seasonal averages and these monthly peaks and troughs in revenue, occupancy, and ADR is crucial for maximizing your Airbnb profit potential in Wheddon Cross.
Seasonal Strategies for Maximizing Profit
- Peak Season: Maximize revenue through premium pricing and potentially longer minimum stays. Ensure high availability.
- Low Season: Offer competitive pricing, special promotions (e.g., extended stay discounts), and flexible cancellation policies. Target off-season travelers like remote workers or budget-conscious guests.
- Shoulder Seasons: Implement dynamic pricing that balances peak and low rates. Target weekend travelers or specific events. Offer slightly more flexible terms than peak season.
- Regularly analyze your own performance against these Wheddon Cross seasonality benchmarks and adjust your pricing and availability strategy accordingly.
Best Areas for Airbnb Investment in Wheddon Cross (2025)
Exploring the top neighborhoods for short-term rentals in Wheddon Cross? This section highlights key areas, outlining why they are attractive for hosts and guests, along with notable local attractions. Consider these locations based on your target guest profile and investment strategy.
| Neighborhood / Area | Why Host Here? (Target Guests & Appeal) | Key Attractions & Landmarks |
|---|---|---|
| Exmoor National Park | A breathtaking natural reserve with stunning landscapes, perfect for nature lovers and outdoor activities like hiking and bird watching. | Dunkery Beacon, Tarr Steps, Exmoor Forest, Lynmouth and Lynton, Porlock Weir |
| Porlock | A picturesque village with scenic views and close proximity to the coast, ideal for holidaymakers seeking tranquility and beautiful scenery. | Porlock Weir Harbour, Holnicote Estate, St. Dubricius Church, Porlock Marsh, Exmoor Owl & Hawk Centre |
| Dunkery Beacon | The highest point on Exmoor, offering panoramic views and a popular spot for walkers and photographers. | Dunkery Beacon summit, Breath-taking views, Walking trails, Nature walks, Wildlife watching |
| Cloutsham | A peaceful village located in the heart of Exmoor, providing a serene escape for those looking to unwind in nature. | Nature walks, Countryside views, Exmoor ponies, Historic buildings |
| Wheddon Cross itself | A charming village and a great base for exploring surrounding attractions, making it appealing for those visiting Exmoor. | Local pubs and restaurants, Cottage accommodations, Hiking trails, Community events |
| Minehead | A coastal town with a sandy beach and family-friendly attractions, attracting tourists during summer months. | Minehead Beach, West Somerset Railway, Butlins Minehead, South West Coast Path, The Old Market |
| Winsford | A small village offering a glimpse of rural life with easy access to scenic walks and local history. | Winsford Hill, Historic bridges, Exmoor horse riding, Walking trails |
| Lynton and Lynmouth | Known as the 'Gem of North Devon', these twin villages offer stunning views and coastal walks, making them popular tourist destinations. | Lynton Cliff Railway, Lynmouth Bay, Lyn Valley, Exmoor Coastal Walks, Art galleries |
Understanding Airbnb License Requirements & STR Laws in Wheddon Cross (2025)
While Wheddon Cross, England, United Kingdom currently shows low STR regulations, specific Airbnb license requirements might still exist or change. Always verify the latest short term rental regulations and Airbnb license requirements directly with local government authorities for Wheddon Cross to ensure full compliance before hosting.
(Source: AirROI data, 2025, finding no licensed listings among those analyzed)
Top Performing Airbnb Properties in Wheddon Cross (2025)
Benchmark your potential! Explore examples of top-performing Airbnb properties in Wheddon Crossbased on Trailing Twelve Month (TTM) revenue. Analyze their characteristics, revenue, occupancy rate, and ADR to understand what drives success in this market.

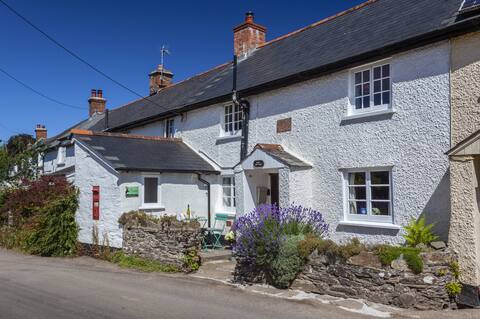
Blagdon Cottage, Wheddon Cross
Entire Place • 1 bedroom
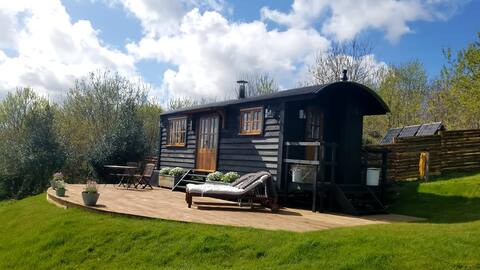
Pleasant Pheasant on Exmoor Shepherd Hut & Hot Tub
Entire Place • 1 bedroom

Happy Hare on Exmoor Shepherd Hut & Hot Tub
Entire Place • 1 bedroom
Syms Cottage, Cutcombe
Entire Place • 2 bedrooms

Barn Owl Cottage, Wheddon Cross
Entire Place • 2 bedrooms

Barn Owl Cottage
Entire Place • 2 bedrooms
Note: Performance varies based on location, size, amenities, seasonality, and management quality. Data reflects the past 12 months.
Top Performing Airbnb Hosts in Wheddon Cross (2025)
Learn from the best! This table showcases top-performing Airbnb hosts in Wheddon Cross based on the number of properties managed and estimated total revenue over the past year. Analyze their scale and performance metrics.
| Host Name | Properties | Grossing Revenue | Stay Reviews | Avg Rating |
|---|---|---|---|---|
| Chris | 4 | $130,314 | 16 | 3.58/5.0 |
| Alison | 2 | $65,889 | 88 | 5.00/5.0 |
| Ruth | 5 | $28,432 | 129 | 4.69/5.0 |
| Host #247416919 | 1 | $22,470 | 1 | 0.00/5.0 |
| Woodruff | 1 | $22,366 | 57 | 4.86/5.0 |
| Katherine | 4 | $20,703 | 104 | 4.99/5.0 |
| Sandra | 1 | $17,859 | 27 | 5.00/5.0 |
| Cally | 1 | $12,915 | 17 | 5.00/5.0 |
| Caroline | 2 | $8,740 | 12 | 4.61/5.0 |
| Sophie | 1 | $8,529 | 22 | 4.64/5.0 |
Analyzing the strategies of top hosts, such as their property selection, pricing, and guest communication, can offer valuable lessons for optimizing your own Airbnb operations in Wheddon Cross.
Dive Deeper: Advanced Wheddon Cross STR Market Data (2025)
Ready to unlock more insights? AirROI provides access to advanced metrics and comprehensive Airbnb data for Wheddon Cross. Explore detailed analytics beyond this report to refine your investment strategy, optimize pricing, and maximize your vacation rental profits.
Explore Advanced MetricsWheddon Cross Short-Term Rental Market Composition (2025): Property & Room Types
Room Type Distribution
Property Type Distribution
Market Composition Insights for Wheddon Cross
- The Wheddon Cross Airbnb market composition is heavily skewed towards Entire Home/Apt listings, which make up 92.3% of the 26 active rentals. This indicates strong guest preference for privacy and space.
- Looking at the property type distribution in Wheddon Cross, House properties are the most common (65.4%), reflecting the local real estate landscape.
- Houses represent a significant 65.4% portion, catering likely to families or larger groups.
- The presence of 7.7% Hotel/Boutique listings indicates integration with traditional hospitality.
Wheddon Cross Airbnb Room Capacity Analysis (2025): Bedroom Distribution
Distribution of Listings by Number of Bedrooms
Room Capacity Insights for Wheddon Cross
- The dominant room capacity in Wheddon Cross is 1 bedroom listings, making up 53.8% of the market. This suggests a strong demand for properties suitable for couples or solo travelers.
- Together, 1 bedroom and 2 bedrooms properties represent 88.4% of the active Airbnb listings in Wheddon Cross, indicating a high concentration in these sizes.
- With over half the market (53.8%) consisting of studios or 1-bedroom units, Wheddon Cross is particularly well-suited for individuals or couples.
- Listings with 3+ bedrooms (7.7%) represent a smaller niche, potentially indicating an underserved market for larger group accommodations in Wheddon Cross.
Wheddon Cross Vacation Rental Guest Capacity Trends (2025)
Distribution of Listings by Guest Capacity
Guest Capacity Insights for Wheddon Cross
- The most common guest capacity trend in Wheddon Cross vacation rentals is listings accommodating 2 guests (46.2%). This suggests the primary traveler segment is likely couples or solo travelers.
- Properties designed for 2 guests and 4 guests dominate the Wheddon Cross STR market, accounting for 77.0% of listings.
- A significant 46.2% of listings cater specifically to 1-2 guests, highlighting strong demand from couples and solo travelers in Wheddon Cross.
- 19.2% of properties accommodate 6+ guests, serving the market segment for larger families or group travel in Wheddon Cross.
- On average, properties in Wheddon Cross are equipped to host 3.6 guests.
Wheddon Cross Airbnb Booking Patterns (2025): Available vs. Booked Days
Available Days Distribution
Booked Days Distribution
Booking Pattern Insights for Wheddon Cross
- The most common availability pattern in Wheddon Cross falls within the 271-366 days range, representing 73.1% of listings. This suggests many properties have significant open periods on their calendars.
- Approximately 100.0% of listings show high availability (181+ days open annually), indicating potential for increased bookings or specific owner usage patterns.
- For booked days, the 31-90 days range is most frequent in Wheddon Cross (38.5%), reflecting common guest stay durations or potential owner blocking patterns.
- A notable 3.8% of properties secure long booking periods (181+ days booked per year), highlighting successful long-term rental strategies or significant owner usage.
Wheddon Cross Airbnb Minimum Stay Requirements Analysis
Distribution of Listings by Minimum Night Requirement
1 Night
6 listings
23.1% of total
2 Nights
9 listings
34.6% of total
3 Nights
4 listings
15.4% of total
30+ Nights
7 listings
26.9% of total
Key Insights
- The most prevalent minimum stay requirement in Wheddon Cross is 2 Nights, adopted by 34.6% of listings. This highlights the market's preference for shorter, flexible bookings.
- A significant segment (26.9%) caters to monthly stays (30+ nights) in Wheddon Cross, pointing to opportunities in the extended-stay market.
Recommendations
- Align with the market by considering a 2 Nights minimum stay, as 34.6% of Wheddon Cross hosts use this setting.
- If feasible, allowing 1-night stays, especially midweek or during low season, could capture last-minute bookings, as only 23.1% currently do.
- Explore offering discounts for stays of 30+ nights to attract the 26.9% of the market seeking extended stays.
- Adjust minimum nights based on seasonality – potentially shorter during low season and longer during peak demand periods in Wheddon Cross.
Wheddon Cross Airbnb Cancellation Policy Trends Analysis (2025)
Super Strict 60 Days
1 listings
4.2% of total
Flexible
3 listings
12.5% of total
Moderate
9 listings
37.5% of total
Firm
6 listings
25% of total
Strict
5 listings
20.8% of total
Cancellation Policy Insights for Wheddon Cross
- The prevailing Airbnb cancellation policy trend in Wheddon Cross is Moderate, used by 37.5% of listings.
- There's a relatively balanced mix between guest-friendly (50.0%) and stricter (45.8%) policies, offering choices for different guest needs.
Recommendations for Hosts
- Consider adopting a Moderate policy to align with the 37.5% market standard in Wheddon Cross.
- Regularly review your cancellation policy against competitors and market demand shifts in Wheddon Cross.
Wheddon Cross STR Booking Lead Time Analysis (2025)
Average Booking Lead Time by Month
Booking Lead Time Insights for Wheddon Cross
- The overall average booking lead time for vacation rentals in Wheddon Cross is 55 days.
- Guests book furthest in advance for stays during May (average 117 days), likely coinciding with peak travel demand or local events.
- The shortest booking windows occur for stays in February (average 26 days), indicating more last-minute travel plans during this time.
- Seasonally, Summer (80 days avg.) sees the longest lead times, while Fall (54 days avg.) has the shortest, reflecting typical travel planning cycles.
Recommendations for Hosts
- Use the overall average lead time (55 days) as a baseline for your pricing and availability strategy in Wheddon Cross.
- For May stays, consider implementing length-of-stay discounts or slightly higher rates for bookings made less than 117 days out to capitalize on advance planning.
- Target marketing efforts for the Summer season well in advance (at least 80 days) to capture early planners.
- Monitor your own booking lead times against these Wheddon Cross averages to identify opportunities for dynamic pricing adjustments.
Popular & Essential Airbnb Amenities in Wheddon Cross (2025)
Amenity Prevalence
Amenity Insights for Wheddon Cross
- Essential amenities in Wheddon Cross that guests expect include: Free parking on premises, Heating, Smoke alarm. Lacking these (any) could significantly impact bookings.
- Popular amenities like Kitchen, Refrigerator, Wifi are common but not universal. Offering these can provide a competitive edge.
- Warning: Wifi is not universally provided but is considered essential globally. Ensure reliable Wifi is offered.
Recommendations for Hosts
- Ensure your listing includes all essential amenities for Wheddon Cross: Free parking on premises, Heating, Smoke alarm.
- Prioritize adding missing essentials: Heating, Smoke alarm.
- Consider adding popular differentiators like Kitchen or Refrigerator to increase appeal.
- Highlight unique or less common amenities you offer (e.g., hot tub, dedicated workspace, EV charger) in your listing description and photos.
- Regularly check competitor amenities in Wheddon Cross to stay competitive.
Wheddon Cross Airbnb Guest Demographics & Profile Analysis (2025)
Guest Profile Summary for Wheddon Cross
- The typical guest profile for Airbnb in Wheddon Cross consists of primarily domestic travelers (85%), often arriving from nearby England, typically belonging to the Post-2000s (Gen Z/Alpha) group (50%), primarily speaking English or French.
- Domestic travelers account for 85.2% of guests.
- Key international markets include United Kingdom (85.2%) and Netherlands (4.9%).
- Top languages spoken are English (73.7%) followed by French (10.5%).
- A significant demographic segment is the Post-2000s (Gen Z/Alpha) group, representing 50% of guests.
Recommendations for Hosts
- Target domestic marketing efforts towards travelers from England and London.
- Tailor amenities and listing descriptions to appeal to the dominant Post-2000s (Gen Z/Alpha) demographic (e.g., highlight fast WiFi, smart home features, local guides).
- Highlight unique local experiences or amenities relevant to the primary guest profile.
- Consider seasonal promotions aligned with peak travel times for key origin markets.
Nearby Short-Term Rental Market Comparison
How does the Wheddon Cross Airbnb market stack up against its neighbors? Compare key performance metrics like average monthly revenue, ADR, and occupancy rates in surrounding areas to understand the broader regional STR landscape.
| Market | Active Properties | Monthly Revenue | Daily Rate | Avg. Occupancy |
|---|---|---|---|---|
| Englishcombe | 13 | $8,558 | $573.69 | 49% |
| Chew Magna | 14 | $6,649 | $399.59 | 46% |
| Long Sutton | 17 | $5,726 | $383.88 | 46% |
| Stoke St. Michael | 10 | $5,277 | $424.04 | 42% |
| Winsham | 10 | $5,154 | $484.22 | 52% |
| Oldland Common | 13 | $5,093 | $355.47 | 43% |
| Llanrhidian | 15 | $4,842 | $386.18 | 53% |
| Crai | 20 | $4,799 | $371.85 | 46% |
| Limpley Stoke | 10 | $4,598 | $523.47 | 52% |
| Abbeycwmhir | 10 | $4,502 | $259.18 | 49% |