Wellington Airbnb Market Analysis 2025: Short Term Rental Data & Vacation Rental Statistics in England, United Kingdom
Is Airbnb profitable in Wellington in 2025? Explore comprehensive Airbnb analytics for Wellington, England, United Kingdom to uncover income potential. This 2025 STR market report for Wellington, based on AirROI data from April 2024 to March 2025, reveals key trends in the niche market of 47 active listings.
Whether you're considering an Airbnb investment in Wellington, optimizing your existing vacation rental, or exploring rental arbitrage opportunities, understanding the Wellington Airbnb data is crucial. Leveraging the low regulation environment is key to maximizing your short term rental income potential. Let's dive into the specifics.
Key Wellington Airbnb Performance Metrics Overview
Monthly Airbnb Revenue Variations & Income Potential in Wellington (2025)
Understanding the monthly revenue variations for Airbnb listings in Wellington is key to maximizing your short term rental income potential. Seasonality significantly impacts earnings. Our analysis, based on data from the past 12 months, shows that the peak revenue month for STRs in Wellington is typically December, while February often presents the lowest earnings, highlighting opportunities for strategic pricing adjustments during shoulder and low seasons. Explore the typical Airbnb income in Wellington across different performance tiers:
- Best-in-class properties (Top 10%) achieve $3,455+ monthly, often utilizing dynamic pricing and superior guest experiences.
- Strong performing properties (Top 25%) earn $2,414 or more, indicating effective management and desirable locations/amenities.
- Typical properties (Median) generate around $1,471 per month, representing the average market performance.
- Entry-level properties (Bottom 25%) see earnings around $822, often with potential for optimization.
Average Monthly Airbnb Earnings Trend in Wellington
Wellington Airbnb Occupancy Rate Trends (2025)
Maximize your bookings by understanding the Wellington STR occupancy trends. Seasonal demand shifts significantly influence how often properties are booked. Typically, Augustsees the highest demand (peak season occupancy), while March experiences the lowest (low season). Effective strategies, like adjusting minimum stays or offering promotions, can boost occupancy during slower periods. Here's how different property tiers perform in Wellington:
- Best-in-class properties (Top 10%) achieve 80%+ occupancy, indicating high desirability and potentially optimized availability.
- Strong performing properties (Top 25%) maintain 66% or higher occupancy, suggesting good market fit and guest satisfaction.
- Typical properties (Median) have an occupancy rate around 40%.
- Entry-level properties (Bottom 25%) average 21% occupancy, potentially facing higher vacancy.
Average Monthly Occupancy Rate Trend in Wellington
Average Daily Rate (ADR) Airbnb Trends in Wellington (2025)
Effective short term rental pricing strategy in Wellington involves understanding monthly ADR fluctuations. The Average Daily Rate (ADR) for Airbnb in Wellington typically peaks in June and dips lowest during April. Leveraging Airbnb dynamic pricing tools or strategies based on this seasonality can significantly boost revenue. Here's a look at the typical nightly rates achieved:
- Best-in-class properties (Top 10%) command rates of $202+ per night, often due to premium features or locations.
- Strong performing properties (Top 25%) achieve nightly rates of $140 or more.
- Typical properties (Median) charge around $111 per night.
- Entry-level properties (Bottom 25%) earn around $78 per night.
Average Daily Rate (ADR) Trend by Month in Wellington
Get Live Wellington Market Intelligence 👇

Explore Real-time Analytics
Airbnb Seasonality Analysis & Trends in Wellington (2025)
Peak Season (December, August, June)
- Revenue averages $2,267 per month
- Occupancy rates average 49.7%
- Daily rates average $175
Shoulder Season
- Revenue averages $1,766 per month
- Occupancy maintains around 42.7%
- Daily rates hold near $162
Low Season (February, March, November)
- Revenue drops to average $1,355 per month
- Occupancy decreases to average 39.6%
- Daily rates adjust to average $163
Seasonality Insights for Wellington
- The Airbnb seasonality in Wellington shows moderate seasonality with distinct peak and low periods. While the sections above show seasonal averages, it's also insightful to look at the extremes:
- During the high season, the absolute peak month showcases Wellington's highest earning potential, with monthly revenues capable of climbing to $2,318, occupancy reaching a high of 55.7%, and ADRs peaking at $181.
- Conversely, the slowest single month of the year, typically falling within the low season, marks the market's lowest point. In this month, revenue might dip to $1,291, occupancy could drop to 36.0%, and ADRs may adjust down to $158.
- Understanding both the seasonal averages and these monthly peaks and troughs in revenue, occupancy, and ADR is crucial for maximizing your Airbnb profit potential in Wellington.
Seasonal Strategies for Maximizing Profit
- Peak Season: Maximize revenue through premium pricing and potentially longer minimum stays. Ensure high availability.
- Low Season: Offer competitive pricing, special promotions (e.g., extended stay discounts), and flexible cancellation policies. Target off-season travelers like remote workers or budget-conscious guests.
- Shoulder Seasons: Implement dynamic pricing that balances peak and low rates. Target weekend travelers or specific events. Offer slightly more flexible terms than peak season.
- Regularly analyze your own performance against these Wellington seasonality benchmarks and adjust your pricing and availability strategy accordingly.
Best Areas for Airbnb Investment in Wellington (2025)
Exploring the top neighborhoods for short-term rentals in Wellington? This section highlights key areas, outlining why they are attractive for hosts and guests, along with notable local attractions. Consider these locations based on your target guest profile and investment strategy.
| Neighborhood / Area | Why Host Here? (Target Guests & Appeal) | Key Attractions & Landmarks |
|---|---|---|
| Oriental Bay | A vibrant waterfront area known for its beautiful beach, cafes, and stunning views of the harbor and city. Popular among tourists seeking a scenic and lively atmosphere. | Oriental Parade, Cuba Street, Wellington Botanical Gardens, Te Papa Museum, Wellington Waterfront |
| Cuba Street | A bohemian area filled with boutique shops, cafes, and bars. Known for its cultural vibe, it attracts young travelers and those looking to experience Wellington's local scene. | Cuba Street, Wellington's street art, Lambton Quay, The Dinner at The White House, The Fringe Festival |
| Lyall Bay | A laid-back beach area popular with surfers and families. Close to the city but offers a more relaxed environment with beach access and seaside cafes. | Lyall Bay Beach, Surfing and water sports, Lyall Bay restaurants, Wellington Airport, Kahurangi National Park |
| Mount Victoria | Known for its breathtaking views of the city and harbor, Mount Victoria is popular with nature lovers and those seeking panoramic vistas. | Mount Victoria Lookout, Walking and biking trails, Wellington Wind Turbine, Cemetery Viewpoint, Botanical Gardens |
| Thorndon | A historic and leafy suburb close to government buildings and the city center, appealing to those interested in Wellington's political and cultural history. | Old St Paul's, Wellington Cathedral of St Paul, The Beehive, Parliament Buildings, Botanical Gardens |
| Kelburn | A charming suburb with a mix of family homes and student accommodation due to its proximity to Victoria University. Ideal for longer stays. | Victoria University, Kelburn Tunnel, Wellington Cable Car, Space Place, Botanical Gardens |
| Karori | A residential suburb known for its green parks and family-friendly atmosphere, offering a local experience away from the tourist crowds. | Karori Wildlife Sanctuary, Zealandia, Karori Park, Local cafes, Great hiking trails |
| Island Bay | A picturesque coastal suburb perfect for those seeking a tranquil getaway, famous for its beach and vibrant marine life. | Island Bay Beach, The Retreat at Miramar, Marine Education Centre, Scenic coastal walks, Local seafood restaurants |
Understanding Airbnb License Requirements & STR Laws in Wellington (2025)
While Wellington, England, United Kingdom currently shows low STR regulations, specific Airbnb license requirements might still exist or change. Always verify the latest short term rental regulations and Airbnb license requirements directly with local government authorities for Wellington to ensure full compliance before hosting.
(Source: AirROI data, 2025, finding no licensed listings among those analyzed)
Top Performing Airbnb Properties in Wellington (2025)
Benchmark your potential! Explore examples of top-performing Airbnb properties in Wellingtonbased on Trailing Twelve Month (TTM) revenue. Analyze their characteristics, revenue, occupancy rate, and ADR to understand what drives success in this market.
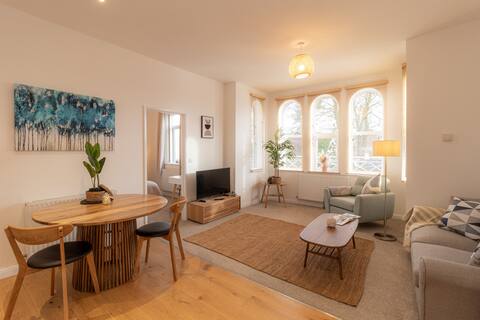
Atcham - Luxury Two Bedroom Two Bathroom Apartment
Entire Place • 2 bedrooms
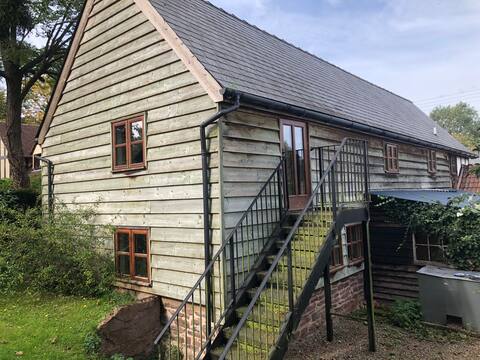
Historic Herefordshire barn
Entire Place • 2 bedrooms
Lilleshall - Beautiful Serviced Apartment
Entire Place • 1 bedroom

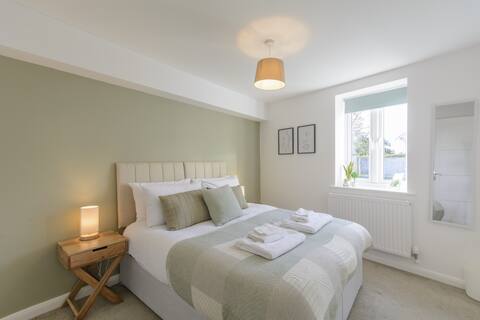
Airy, Serene Coach House in Wellington
Entire Place • 3 bedrooms

LOVELY 4 BED COTTAGE SLEEPS 7
Entire Place • 4 bedrooms

Rose Cottage - charming self contained cottage
Entire Place • 1 bedroom
Note: Performance varies based on location, size, amenities, seasonality, and management quality. Data reflects the past 12 months.
Top Performing Airbnb Hosts in Wellington (2025)
Learn from the best! This table showcases top-performing Airbnb hosts in Wellington based on the number of properties managed and estimated total revenue over the past year. Analyze their scale and performance metrics.
| Host Name | Properties | Grossing Revenue | Stay Reviews | Avg Rating |
|---|---|---|---|---|
| Daniel | 7 | $186,516 | 230 | 4.89/5.0 |
| Dave | 5 | $56,358 | 180 | 4.48/5.0 |
| Frances Anne | 2 | $48,594 | 28 | 4.25/5.0 |
| Andrea | 2 | $45,878 | 295 | 4.93/5.0 |
| Tracy | 2 | $41,731 | 227 | 4.97/5.0 |
| James | 3 | $39,295 | 175 | 4.52/5.0 |
| Vicky | 1 | $35,606 | 24 | 4.92/5.0 |
| Sally | 2 | $31,823 | 305 | 4.77/5.0 |
| Geoffrey | 1 | $31,097 | 62 | 4.89/5.0 |
| Janine | 1 | $19,911 | 24 | 4.92/5.0 |
Analyzing the strategies of top hosts, such as their property selection, pricing, and guest communication, can offer valuable lessons for optimizing your own Airbnb operations in Wellington.
Dive Deeper: Advanced Wellington STR Market Data (2025)
Ready to unlock more insights? AirROI provides access to advanced metrics and comprehensive Airbnb data for Wellington. Explore detailed analytics beyond this report to refine your investment strategy, optimize pricing, and maximize your vacation rental profits.
Explore Advanced MetricsWellington Short-Term Rental Market Composition (2025): Property & Room Types
Room Type Distribution
Property Type Distribution
Market Composition Insights for Wellington
- The Wellington Airbnb market composition is heavily skewed towards Entire Home/Apt listings, which make up 76.6% of the 47 active rentals. This indicates strong guest preference for privacy and space.
- Looking at the property type distribution in Wellington, House properties are the most common (51.1%), reflecting the local real estate landscape.
- Houses represent a significant 51.1% portion, catering likely to families or larger groups.
- The presence of 8.5% Hotel/Boutique listings indicates integration with traditional hospitality.
- Smaller segments like unique stays (combined 4.3%) offer potential for unique stay experiences.
Wellington Airbnb Room Capacity Analysis (2025): Bedroom Distribution
Distribution of Listings by Number of Bedrooms
Room Capacity Insights for Wellington
- The dominant room capacity in Wellington is 1 bedroom listings, making up 48.9% of the market. This suggests a strong demand for properties suitable for couples or solo travelers.
- Together, 1 bedroom and 2 bedrooms properties represent 68.0% of the active Airbnb listings in Wellington, indicating a high concentration in these sizes.
Wellington Vacation Rental Guest Capacity Trends (2025)
Distribution of Listings by Guest Capacity
Guest Capacity Insights for Wellington
- The most common guest capacity trend in Wellington vacation rentals is listings accommodating 2 guests (36.2%). This suggests the primary traveler segment is likely couples or solo travelers.
- Properties designed for 2 guests and 4 guests dominate the Wellington STR market, accounting for 53.2% of listings.
- 17.1% of properties accommodate 6+ guests, serving the market segment for larger families or group travel in Wellington.
- On average, properties in Wellington are equipped to host 3.0 guests.
Wellington Airbnb Booking Patterns (2025): Available vs. Booked Days
Available Days Distribution
Booked Days Distribution
Booking Pattern Insights for Wellington
- The most common availability pattern in Wellington falls within the 181-270 days range, representing 44.7% of listings. This suggests many properties have significant open periods on their calendars.
- Approximately 78.7% of listings show high availability (181+ days open annually), indicating potential for increased bookings or specific owner usage patterns.
- For booked days, the 91-180 days range is most frequent in Wellington (44.7%), reflecting common guest stay durations or potential owner blocking patterns.
- A notable 21.2% of properties secure long booking periods (181+ days booked per year), highlighting successful long-term rental strategies or significant owner usage.
Wellington Airbnb Minimum Stay Requirements Analysis
Distribution of Listings by Minimum Night Requirement
1 Night
18 listings
40.9% of total
2 Nights
16 listings
36.4% of total
3 Nights
2 listings
4.5% of total
7-29 Nights
1 listings
2.3% of total
30+ Nights
7 listings
15.9% of total
Key Insights
- The most prevalent minimum stay requirement in Wellington is 1 Night, adopted by 40.9% of listings. This highlights the market's preference for shorter, flexible bookings.
- A strong majority (77.3%) of the Wellington Airbnb data shows acceptance of very short stays (1-2 nights), indicating a dynamic, high-turnover market.
- A significant segment (15.9%) caters to monthly stays (30+ nights) in Wellington, pointing to opportunities in the extended-stay market.
Recommendations
- Align with the market by considering a 1 Night minimum stay, as 40.9% of Wellington hosts use this setting.
- Explore offering discounts for stays of 30+ nights to attract the 15.9% of the market seeking extended stays.
- Adjust minimum nights based on seasonality – potentially shorter during low season and longer during peak demand periods in Wellington.
Wellington Airbnb Cancellation Policy Trends Analysis (2025)
Non-refundable
4 listings
10% of total
Refundable
3 listings
7.5% of total
Super Strict 60 Days
1 listings
2.5% of total
Flexible
15 listings
37.5% of total
Moderate
11 listings
27.5% of total
Firm
3 listings
7.5% of total
Strict
3 listings
7.5% of total
Cancellation Policy Insights for Wellington
- The prevailing Airbnb cancellation policy trend in Wellington is Flexible, used by 37.5% of listings.
- There's a relatively balanced mix between guest-friendly (65.0%) and stricter (15.0%) policies, offering choices for different guest needs.
- Strict cancellation policies are quite rare (7.5%), potentially making listings with this policy less competitive unless justified by high demand or property type.
Recommendations for Hosts
- Consider adopting a Flexible policy to align with the 37.5% market standard in Wellington.
- Using a Strict policy might deter some guests, as only 7.5% of listings use it. Evaluate if potential revenue protection outweighs possible lower booking rates.
- Regularly review your cancellation policy against competitors and market demand shifts in Wellington.
Wellington STR Booking Lead Time Analysis (2025)
Average Booking Lead Time by Month
Booking Lead Time Insights for Wellington
- The overall average booking lead time for vacation rentals in Wellington is 46 days.
- Guests book furthest in advance for stays during June (average 77 days), likely coinciding with peak travel demand or local events.
- The shortest booking windows occur for stays in February (average 24 days), indicating more last-minute travel plans during this time.
- Seasonally, Summer (69 days avg.) sees the longest lead times, while Winter (27 days avg.) has the shortest, reflecting typical travel planning cycles.
Recommendations for Hosts
- Use the overall average lead time (46 days) as a baseline for your pricing and availability strategy in Wellington.
- For June stays, consider implementing length-of-stay discounts or slightly higher rates for bookings made less than 77 days out to capitalize on advance planning.
- Target marketing efforts for the Summer season well in advance (at least 69 days) to capture early planners.
- Monitor your own booking lead times against these Wellington averages to identify opportunities for dynamic pricing adjustments.
Popular & Essential Airbnb Amenities in Wellington (2025)
Amenity Prevalence
Amenity Insights for Wellington
- Essential amenities in Wellington that guests expect include: Smoke alarm, TV, Wifi. Lacking these (any) could significantly impact bookings.
- Popular amenities like Heating, Hangers, Kitchen are common but not universal. Offering these can provide a competitive edge.
Recommendations for Hosts
- Ensure your listing includes all essential amenities for Wellington: Smoke alarm, TV, Wifi.
- Prioritize adding missing essentials: Smoke alarm, TV, Wifi.
- Consider adding popular differentiators like Heating or Hangers to increase appeal.
- Highlight unique or less common amenities you offer (e.g., hot tub, dedicated workspace, EV charger) in your listing description and photos.
- Regularly check competitor amenities in Wellington to stay competitive.
Wellington Airbnb Guest Demographics & Profile Analysis (2025)
Guest Profile Summary for Wellington
- The typical guest profile for Airbnb in Wellington consists of primarily domestic travelers (92%), often arriving from nearby England, typically belonging to the Post-2000s (Gen Z/Alpha) group (50%), primarily speaking English or French.
- Domestic travelers account for 91.9% of guests.
- Key international markets include United Kingdom (91.9%) and United States (1.7%).
- Top languages spoken are English (71.2%) followed by French (7.9%).
- A significant demographic segment is the Post-2000s (Gen Z/Alpha) group, representing 50% of guests.
Recommendations for Hosts
- Target domestic marketing efforts towards travelers from England and London.
- Tailor amenities and listing descriptions to appeal to the dominant Post-2000s (Gen Z/Alpha) demographic (e.g., highlight fast WiFi, smart home features, local guides).
- Highlight unique local experiences or amenities relevant to the primary guest profile.
- Consider seasonal promotions aligned with peak travel times for key origin markets.
Nearby Short-Term Rental Market Comparison
How does the Wellington Airbnb market stack up against its neighbors? Compare key performance metrics like average monthly revenue, ADR, and occupancy rates in surrounding areas to understand the broader regional STR landscape.
| Market | Active Properties | Monthly Revenue | Daily Rate | Avg. Occupancy |
|---|---|---|---|---|
| Englishcombe | 13 | $8,558 | $573.69 | 49% |
| Chew Magna | 14 | $6,649 | $399.59 | 46% |
| Lambourn | 11 | $6,081 | $669.47 | 28% |
| Long Sutton | 17 | $5,726 | $383.88 | 46% |
| Stoke St. Michael | 10 | $5,277 | $424.04 | 42% |
| Winsham | 10 | $5,154 | $484.22 | 52% |
| Oldland Common | 13 | $5,093 | $355.47 | 43% |
| Crai | 20 | $4,799 | $371.85 | 46% |
| Dinton | 11 | $4,637 | $242.16 | 58% |
| Limpley Stoke | 10 | $4,598 | $523.47 | 52% |