Warwick Airbnb Market Analysis 2025: Short Term Rental Data & Vacation Rental Statistics in England, United Kingdom
Is Airbnb profitable in Warwick in 2025? Explore comprehensive Airbnb analytics for Warwick, England, United Kingdom to uncover income potential. This 2025 STR market report for Warwick, based on AirROI data from April 2024 to March 2025, reveals key trends in the market of 383 active listings.
Whether you're considering an Airbnb investment in Warwick, optimizing your existing vacation rental, or exploring rental arbitrage opportunities, understanding the Warwick Airbnb data is crucial. Leveraging the low regulation environment is key to maximizing your short term rental income potential. Let's dive into the specifics.
Key Warwick Airbnb Performance Metrics Overview
Monthly Airbnb Revenue Variations & Income Potential in Warwick (2025)
Understanding the monthly revenue variations for Airbnb listings in Warwick is key to maximizing your short term rental income potential. Seasonality significantly impacts earnings. Our analysis, based on data from the past 12 months, shows that the peak revenue month for STRs in Warwick is typically June, while March often presents the lowest earnings, highlighting opportunities for strategic pricing adjustments during shoulder and low seasons. Explore the typical Airbnb income in Warwick across different performance tiers:
- Best-in-class properties (Top 10%) achieve $5,385+ monthly, often utilizing dynamic pricing and superior guest experiences.
- Strong performing properties (Top 25%) earn $3,580 or more, indicating effective management and desirable locations/amenities.
- Typical properties (Median) generate around $1,911 per month, representing the average market performance.
- Entry-level properties (Bottom 25%) see earnings around $877, often with potential for optimization.
Average Monthly Airbnb Earnings Trend in Warwick
Warwick Airbnb Occupancy Rate Trends (2025)
Maximize your bookings by understanding the Warwick STR occupancy trends. Seasonal demand shifts significantly influence how often properties are booked. Typically, Julysees the highest demand (peak season occupancy), while March experiences the lowest (low season). Effective strategies, like adjusting minimum stays or offering promotions, can boost occupancy during slower periods. Here's how different property tiers perform in Warwick:
- Best-in-class properties (Top 10%) achieve 83%+ occupancy, indicating high desirability and potentially optimized availability.
- Strong performing properties (Top 25%) maintain 68% or higher occupancy, suggesting good market fit and guest satisfaction.
- Typical properties (Median) have an occupancy rate around 46%.
- Entry-level properties (Bottom 25%) average 23% occupancy, potentially facing higher vacancy.
Average Monthly Occupancy Rate Trend in Warwick
Average Daily Rate (ADR) Airbnb Trends in Warwick (2025)
Effective short term rental pricing strategy in Warwick involves understanding monthly ADR fluctuations. The Average Daily Rate (ADR) for Airbnb in Warwick typically peaks in December and dips lowest during April. Leveraging Airbnb dynamic pricing tools or strategies based on this seasonality can significantly boost revenue. Here's a look at the typical nightly rates achieved:
- Best-in-class properties (Top 10%) command rates of $278+ per night, often due to premium features or locations.
- Strong performing properties (Top 25%) achieve nightly rates of $192 or more.
- Typical properties (Median) charge around $128 per night.
- Entry-level properties (Bottom 25%) earn around $85 per night.
Average Daily Rate (ADR) Trend by Month in Warwick
Get Live Warwick Market Intelligence 👇

Explore Real-time Analytics
Airbnb Seasonality Analysis & Trends in Warwick (2025)
Peak Season (June, May, April)
- Revenue averages $3,088 per month
- Occupancy rates average 46.2%
- Daily rates average $154
Shoulder Season
- Revenue averages $2,644 per month
- Occupancy maintains around 49.8%
- Daily rates hold near $171
Low Season (January, February, March)
- Revenue drops to average $1,973 per month
- Occupancy decreases to average 39.6%
- Daily rates adjust to average $187
Seasonality Insights for Warwick
- The Airbnb seasonality in Warwick shows moderate seasonality with distinct peak and low periods. While the sections above show seasonal averages, it's also insightful to look at the extremes:
- During the high season, the absolute peak month showcases Warwick's highest earning potential, with monthly revenues capable of climbing to $3,154, occupancy reaching a high of 55.7%, and ADRs peaking at $198.
- Conversely, the slowest single month of the year, typically falling within the low season, marks the market's lowest point. In this month, revenue might dip to $1,863, occupancy could drop to 37.3%, and ADRs may adjust down to $152.
- Understanding both the seasonal averages and these monthly peaks and troughs in revenue, occupancy, and ADR is crucial for maximizing your Airbnb profit potential in Warwick.
Seasonal Strategies for Maximizing Profit
- Peak Season: Maximize revenue through premium pricing and potentially longer minimum stays. Ensure high availability.
- Low Season: Offer competitive pricing, special promotions (e.g., extended stay discounts), and flexible cancellation policies. Target off-season travelers like remote workers or budget-conscious guests.
- Shoulder Seasons: Implement dynamic pricing that balances peak and low rates. Target weekend travelers or specific events. Offer slightly more flexible terms than peak season.
- Regularly analyze your own performance against these Warwick seasonality benchmarks and adjust your pricing and availability strategy accordingly.
Best Areas for Airbnb Investment in Warwick (2025)
Exploring the top neighborhoods for short-term rentals in Warwick? This section highlights key areas, outlining why they are attractive for hosts and guests, along with notable local attractions. Consider these locations based on your target guest profile and investment strategy.
| Neighborhood / Area | Why Host Here? (Target Guests & Appeal) | Key Attractions & Landmarks |
|---|---|---|
| Warwick Town Centre | The historic heart of Warwick, featuring beautiful architecture, shops, and a vibrant local culture. This area attracts visitors interested in history and local attractions, making it ideal for Airbnb hosting. | Warwick Castle, St. Mary's Church, Market Place, Warwick Museum and Art Gallery, Lord Leycester Hospital |
| Old Town | Known for its charming streets and historical significance, Old Town offers a vibrant atmosphere and easy access to attractions, making it a prime area for tourists seeking a local experience. | The Old Court House, Lord Leycester Hospital, Warwick's medieval street architecture |
| Kenilworth | Located just a short distance away, Kenilworth is famous for its castle ruins and scenic parks. It's perfect for families and history enthusiasts looking for a quiet retreat with nearby attractions. | Kenilworth Castle, Abbey Fields, St Nicholas Church |
| Saltisford | A quaint area situated near the Grand Union Canal, offering a peaceful setting with access to walks and local shops. It attracts those looking for a serene stay while still being close to the town center. | Grand Union Canal, Historic Saltisford Canalside, Local pubs and restaurants |
| Warwick Racecourse | A popular destination for horse racing enthusiasts, especially during race days. This area can attract a specific demographic looking for lively entertainment during the racing season. | Warwick Racecourse, Local betting shops, Nearby pubs and restaurants |
| Packington | A picturesque village close to Warwick, known for its beautiful countryside and walking trails, appealing to nature lovers and those looking for a rural retreat. | Packington Park, Walking trails, Local countryside |
| Clifford Chambers | A quaint village with a historic charm, ideal for people looking for a peaceful rural stay while being just a short drive from Warwick's attractions. | St. Mary’s Church, Village greenery and parks |
| Warwick University area | This area is popular with students and academics, making it a great option for short stays and hosting academic visitors. Close to university facilities and local amenities. | Warwick University, Students' Union, Local cafes and shops |
Understanding Airbnb License Requirements & STR Laws in Warwick (2025)
While Warwick, England, United Kingdom currently shows low STR regulations, specific Airbnb license requirements might still exist or change. Always verify the latest short term rental regulations and Airbnb license requirements directly with local government authorities for Warwick to ensure full compliance before hosting.
(Source: AirROI data, 2025, finding no licensed listings among those analyzed)
Top Performing Airbnb Properties in Warwick (2025)
Benchmark your potential! Explore examples of top-performing Airbnb properties in Warwickbased on Trailing Twelve Month (TTM) revenue. Analyze their characteristics, revenue, occupancy rate, and ADR to understand what drives success in this market.
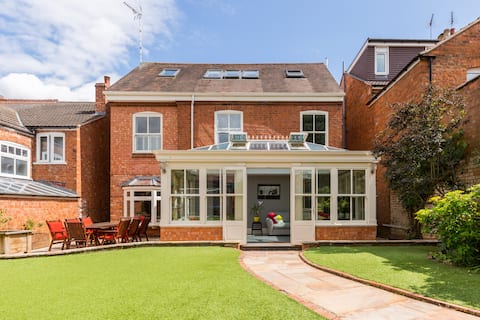
Spacious 4Bed Home in Kenilworth with Parking
Entire Place • 5 bedrooms

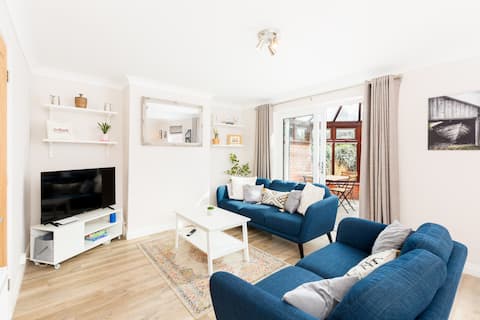
Brilliantly Modern & Spacious 4 Bed Family Home
Entire Place • 4 bedrooms
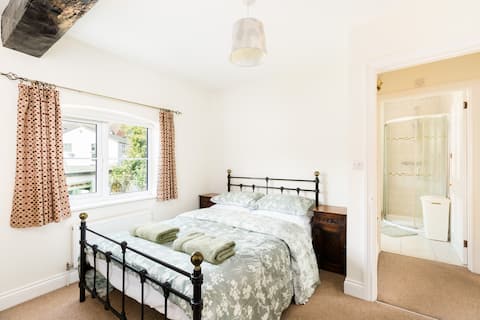
Cosy 2 Bed, Central Warwick & Parking
Entire Place • 2 bedrooms
5 Bedroom House in Center of Royal Leamington Spa
Entire Place • 5 bedrooms
Spacious & Comfortable 3Bed, Leamington Spa
Entire Place • 3 bedrooms
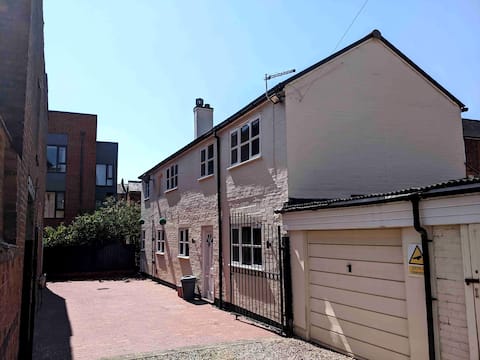
Self-Contained 2 Bed with Parking, Leamington Spa
Entire Place • 2 bedrooms
Note: Performance varies based on location, size, amenities, seasonality, and management quality. Data reflects the past 12 months.
Top Performing Airbnb Hosts in Warwick (2025)
Learn from the best! This table showcases top-performing Airbnb hosts in Warwick based on the number of properties managed and estimated total revenue over the past year. Analyze their scale and performance metrics.
| Host Name | Properties | Grossing Revenue | Stay Reviews | Avg Rating |
|---|---|---|---|---|
| Kirstin | 4 | $249,946 | 407 | 4.85/5.0 |
| Simranjit | 6 | $203,170 | 147 | 4.57/5.0 |
| Jemma | 6 | $197,996 | 79 | 4.01/5.0 |
| Hutch Lifestyle | 5 | $182,811 | 174 | 4.75/5.0 |
| Jodie | 8 | $171,915 | 203 | 4.45/5.0 |
| Ranbir-Pass The Keys | 2 | $160,977 | 53 | 4.83/5.0 |
| Cottages | 4 | $158,475 | 82 | 3.58/5.0 |
| Phil-Pass The Keys | 1 | $155,559 | 60 | 4.75/5.0 |
| Samantha | 2 | $142,546 | 207 | 4.99/5.0 |
| Marvel Apartments | 6 | $125,906 | 311 | 4.57/5.0 |
Analyzing the strategies of top hosts, such as their property selection, pricing, and guest communication, can offer valuable lessons for optimizing your own Airbnb operations in Warwick.
Dive Deeper: Advanced Warwick STR Market Data (2025)
Ready to unlock more insights? AirROI provides access to advanced metrics and comprehensive Airbnb data for Warwick. Explore detailed analytics beyond this report to refine your investment strategy, optimize pricing, and maximize your vacation rental profits.
Explore Advanced MetricsWarwick Short-Term Rental Market Composition (2025): Property & Room Types
Room Type Distribution
Property Type Distribution
Market Composition Insights for Warwick
- The Warwick Airbnb market composition is heavily skewed towards Entire Home/Apt listings, which make up 76.5% of the 383 active rentals. This indicates strong guest preference for privacy and space.
- Looking at the property type distribution in Warwick, House properties are the most common (45.2%), reflecting the local real estate landscape.
- Houses represent a significant 45.2% portion, catering likely to families or larger groups.
- The presence of 6% Hotel/Boutique listings indicates integration with traditional hospitality.
- Smaller segments like outdoor/unique, others, unique stays (combined 8.7%) offer potential for unique stay experiences.
Warwick Airbnb Room Capacity Analysis (2025): Bedroom Distribution
Distribution of Listings by Number of Bedrooms
Room Capacity Insights for Warwick
- The dominant room capacity in Warwick is 1 bedroom listings, making up 37.9% of the market. This suggests a strong demand for properties suitable for couples or solo travelers.
- Together, 1 bedroom and 2 bedrooms properties represent 68.2% of the active Airbnb listings in Warwick, indicating a high concentration in these sizes.
Warwick Vacation Rental Guest Capacity Trends (2025)
Distribution of Listings by Guest Capacity
Guest Capacity Insights for Warwick
- The most common guest capacity trend in Warwick vacation rentals is listings accommodating 2 guests (25.6%). This suggests the primary traveler segment is likely couples or solo travelers.
- Properties designed for 2 guests and 4 guests dominate the Warwick STR market, accounting for 50.7% of listings.
- 16.4% of properties accommodate 6+ guests, serving the market segment for larger families or group travel in Warwick.
- On average, properties in Warwick are equipped to host 3.2 guests.
Warwick Airbnb Booking Patterns (2025): Available vs. Booked Days
Available Days Distribution
Booked Days Distribution
Booking Pattern Insights for Warwick
- The most common availability pattern in Warwick falls within the 271-366 days range, representing 37.1% of listings. This suggests many properties have significant open periods on their calendars.
- Approximately 63.5% of listings show high availability (181+ days open annually), indicating potential for increased bookings or specific owner usage patterns.
- For booked days, the 181-270 days range is most frequent in Warwick (30.3%), reflecting common guest stay durations or potential owner blocking patterns.
- A notable 37.6% of properties secure long booking periods (181+ days booked per year), highlighting successful long-term rental strategies or significant owner usage.
Warwick Airbnb Minimum Stay Requirements Analysis
Distribution of Listings by Minimum Night Requirement
1 Night
122 listings
35.9% of total
2 Nights
112 listings
32.9% of total
3 Nights
32 listings
9.4% of total
4-6 Nights
21 listings
6.2% of total
7-29 Nights
14 listings
4.1% of total
30+ Nights
39 listings
11.5% of total
Key Insights
- The most prevalent minimum stay requirement in Warwick is 1 Night, adopted by 35.9% of listings. This highlights the market's preference for shorter, flexible bookings.
- A strong majority (68.8%) of the Warwick Airbnb data shows acceptance of very short stays (1-2 nights), indicating a dynamic, high-turnover market.
- A significant segment (11.5%) caters to monthly stays (30+ nights) in Warwick, pointing to opportunities in the extended-stay market.
Recommendations
- Align with the market by considering a 1 Night minimum stay, as 35.9% of Warwick hosts use this setting.
- Explore offering discounts for stays of 30+ nights to attract the 11.5% of the market seeking extended stays.
- Adjust minimum nights based on seasonality – potentially shorter during low season and longer during peak demand periods in Warwick.
Warwick Airbnb Cancellation Policy Trends Analysis (2025)
Refundable
4 listings
1.2% of total
Super Strict 60 Days
3 listings
0.9% of total
Non-refundable
1 listings
0.3% of total
Super Strict 30 Days
2 listings
0.6% of total
Flexible
100 listings
30% of total
Moderate
93 listings
27.9% of total
Firm
57 listings
17.1% of total
Strict
73 listings
21.9% of total
Cancellation Policy Insights for Warwick
- The prevailing Airbnb cancellation policy trend in Warwick is Flexible, used by 30% of listings.
- There's a relatively balanced mix between guest-friendly (57.9%) and stricter (39.0%) policies, offering choices for different guest needs.
Recommendations for Hosts
- Consider adopting a Flexible policy to align with the 30% market standard in Warwick.
- Regularly review your cancellation policy against competitors and market demand shifts in Warwick.
Warwick STR Booking Lead Time Analysis (2025)
Average Booking Lead Time by Month
Booking Lead Time Insights for Warwick
- The overall average booking lead time for vacation rentals in Warwick is 45 days.
- Guests book furthest in advance for stays during June (average 68 days), likely coinciding with peak travel demand or local events.
- The shortest booking windows occur for stays in February (average 38 days), indicating more last-minute travel plans during this time.
- Seasonally, Summer (62 days avg.) sees the longest lead times, while Winter (42 days avg.) has the shortest, reflecting typical travel planning cycles.
Recommendations for Hosts
- Use the overall average lead time (45 days) as a baseline for your pricing and availability strategy in Warwick.
- For June stays, consider implementing length-of-stay discounts or slightly higher rates for bookings made less than 68 days out to capitalize on advance planning.
- Target marketing efforts for the Summer season well in advance (at least 62 days) to capture early planners.
- Monitor your own booking lead times against these Warwick averages to identify opportunities for dynamic pricing adjustments.
Popular & Essential Airbnb Amenities in Warwick (2025)
Amenity Prevalence
Amenity Insights for Warwick
- Essential amenities in Warwick that guests expect include: Wifi, Smoke alarm. Lacking these (any) could significantly impact bookings.
- Popular amenities like Heating, Hot water, TV are common but not universal. Offering these can provide a competitive edge.
Recommendations for Hosts
- Ensure your listing includes all essential amenities for Warwick: Wifi, Smoke alarm.
- Prioritize adding missing essentials: Wifi, Smoke alarm.
- Consider adding popular differentiators like Heating or Hot water to increase appeal.
- Highlight unique or less common amenities you offer (e.g., hot tub, dedicated workspace, EV charger) in your listing description and photos.
- Regularly check competitor amenities in Warwick to stay competitive.
Warwick Airbnb Guest Demographics & Profile Analysis (2025)
Guest Profile Summary for Warwick
- The typical guest profile for Airbnb in Warwick consists of primarily domestic travelers (84%), often arriving from nearby England, typically belonging to the Post-2000s (Gen Z/Alpha) group (50%), primarily speaking English or French.
- Domestic travelers account for 84.3% of guests.
- Key international markets include United Kingdom (84.3%) and United States (3.7%).
- Top languages spoken are English (66.1%) followed by French (8.6%).
- A significant demographic segment is the Post-2000s (Gen Z/Alpha) group, representing 50% of guests.
Recommendations for Hosts
- Target domestic marketing efforts towards travelers from England and London.
- Tailor amenities and listing descriptions to appeal to the dominant Post-2000s (Gen Z/Alpha) demographic (e.g., highlight fast WiFi, smart home features, local guides).
- Highlight unique local experiences or amenities relevant to the primary guest profile.
- Consider seasonal promotions aligned with peak travel times for key origin markets.
Nearby Short-Term Rental Market Comparison
How does the Warwick Airbnb market stack up against its neighbors? Compare key performance metrics like average monthly revenue, ADR, and occupancy rates in surrounding areas to understand the broader regional STR landscape.
| Market | Active Properties | Monthly Revenue | Daily Rate | Avg. Occupancy |
|---|---|---|---|---|
| Englishcombe | 13 | $8,558 | $573.69 | 49% |
| Dorney | 12 | $8,335 | $622.48 | 45% |
| Chew Magna | 14 | $6,649 | $399.59 | 46% |
| Lambourn | 11 | $6,081 | $669.47 | 28% |
| City of Westminster | 1,327 | $6,043 | $486.66 | 52% |
| Long Sutton | 17 | $5,726 | $383.88 | 46% |
| Stoke St. Michael | 10 | $5,277 | $424.04 | 42% |
| Oldland Common | 13 | $5,093 | $355.47 | 43% |
| Wraysbury | 14 | $4,719 | $396.18 | 46% |
| Stamford Bridge | 11 | $4,669 | $410.14 | 38% |