Tywardreath Airbnb Market Analysis 2025: Short Term Rental Data & Vacation Rental Statistics in England, United Kingdom
Is Airbnb profitable in Tywardreath in 2025? Explore comprehensive Airbnb analytics for Tywardreath, England, United Kingdom to uncover income potential. This 2025 STR market report for Tywardreath, based on AirROI data from April 2024 to March 2025, reveals key trends in the niche market of 23 active listings.
Whether you're considering an Airbnb investment in Tywardreath, optimizing your existing vacation rental, or exploring rental arbitrage opportunities, understanding the Tywardreath Airbnb data is crucial. Leveraging the low regulation environment is key to maximizing your short term rental income potential. Let's dive into the specifics.
Key Tywardreath Airbnb Performance Metrics Overview
Monthly Airbnb Revenue Variations & Income Potential in Tywardreath (2025)
Understanding the monthly revenue variations for Airbnb listings in Tywardreath is key to maximizing your short term rental income potential. Seasonality significantly impacts earnings. Our analysis, based on data from the past 12 months, shows that the peak revenue month for STRs in Tywardreath is typically August, while November often presents the lowest earnings, highlighting opportunities for strategic pricing adjustments during shoulder and low seasons. Explore the typical Airbnb income in Tywardreath across different performance tiers:
- Best-in-class properties (Top 10%) achieve $4,792+ monthly, often utilizing dynamic pricing and superior guest experiences.
- Strong performing properties (Top 25%) earn $3,066 or more, indicating effective management and desirable locations/amenities.
- Typical properties (Median) generate around $1,725 per month, representing the average market performance.
- Entry-level properties (Bottom 25%) see earnings around $842, often with potential for optimization.
Average Monthly Airbnb Earnings Trend in Tywardreath
Tywardreath Airbnb Occupancy Rate Trends (2025)
Maximize your bookings by understanding the Tywardreath STR occupancy trends. Seasonal demand shifts significantly influence how often properties are booked. Typically, Augustsees the highest demand (peak season occupancy), while January experiences the lowest (low season). Effective strategies, like adjusting minimum stays or offering promotions, can boost occupancy during slower periods. Here's how different property tiers perform in Tywardreath:
- Best-in-class properties (Top 10%) achieve 74%+ occupancy, indicating high desirability and potentially optimized availability.
- Strong performing properties (Top 25%) maintain 57% or higher occupancy, suggesting good market fit and guest satisfaction.
- Typical properties (Median) have an occupancy rate around 39%.
- Entry-level properties (Bottom 25%) average 18% occupancy, potentially facing higher vacancy.
Average Monthly Occupancy Rate Trend in Tywardreath
Average Daily Rate (ADR) Airbnb Trends in Tywardreath (2025)
Effective short term rental pricing strategy in Tywardreath involves understanding monthly ADR fluctuations. The Average Daily Rate (ADR) for Airbnb in Tywardreath typically peaks in August and dips lowest during March. Leveraging Airbnb dynamic pricing tools or strategies based on this seasonality can significantly boost revenue. Here's a look at the typical nightly rates achieved:
- Best-in-class properties (Top 10%) command rates of $386+ per night, often due to premium features or locations.
- Strong performing properties (Top 25%) achieve nightly rates of $193 or more.
- Typical properties (Median) charge around $141 per night.
- Entry-level properties (Bottom 25%) earn around $91 per night.
Average Daily Rate (ADR) Trend by Month in Tywardreath
Get Live Tywardreath Market Intelligence 👇

Explore Real-time Analytics
Airbnb Seasonality Analysis & Trends in Tywardreath (2025)
Peak Season (August, July, June)
- Revenue averages $3,594 per month
- Occupancy rates average 54.2%
- Daily rates average $216
Shoulder Season
- Revenue averages $2,172 per month
- Occupancy maintains around 38.3%
- Daily rates hold near $186
Low Season (January, October, November)
- Revenue drops to average $1,336 per month
- Occupancy decreases to average 26.7%
- Daily rates adjust to average $183
Seasonality Insights for Tywardreath
- The Airbnb seasonality in Tywardreath shows highly seasonal trends requiring careful strategy. While the sections above show seasonal averages, it's also insightful to look at the extremes:
- During the high season, the absolute peak month showcases Tywardreath's highest earning potential, with monthly revenues capable of climbing to $4,020, occupancy reaching a high of 64.5%, and ADRs peaking at $221.
- Conversely, the slowest single month of the year, typically falling within the low season, marks the market's lowest point. In this month, revenue might dip to $1,207, occupancy could drop to 25.1%, and ADRs may adjust down to $159.
- Understanding both the seasonal averages and these monthly peaks and troughs in revenue, occupancy, and ADR is crucial for maximizing your Airbnb profit potential in Tywardreath.
Seasonal Strategies for Maximizing Profit
- Peak Season: Maximize revenue through premium pricing and potentially longer minimum stays. Ensure high availability.
- Low Season: Offer competitive pricing, special promotions (e.g., extended stay discounts), and flexible cancellation policies. Target off-season travelers like remote workers or budget-conscious guests.
- Shoulder Seasons: Implement dynamic pricing that balances peak and low rates. Target weekend travelers or specific events. Offer slightly more flexible terms than peak season.
- Regularly analyze your own performance against these Tywardreath seasonality benchmarks and adjust your pricing and availability strategy accordingly.
Best Areas for Airbnb Investment in Tywardreath (2025)
Exploring the top neighborhoods for short-term rentals in Tywardreath? This section highlights key areas, outlining why they are attractive for hosts and guests, along with notable local attractions. Consider these locations based on your target guest profile and investment strategy.
| Neighborhood / Area | Why Host Here? (Target Guests & Appeal) | Key Attractions & Landmarks |
|---|---|---|
| Tywardreath Beach | Family-friendly beach location offering sandy shores and great views of the coastline. Attractive to vacationers seeking relaxation and seaside activities. | Tywardreath Beach, Coast Path, Nearby St. Austell Bay, Par Sands, Gribbin Head |
| Par Village | Charming village with beautiful rural scenery and a close-knit community feel. Ideal for guests looking for a quiet retreat near the coast. | The Eden Project, Par Beach, Local pubs and eateries, Historic churches, Nature trails |
| The Eden Project | One of the UK's most popular tourist attractions, known for its biomes and stunning gardens. Draws eco-tourists and families year-round. | The Biomes, Outdoor Gardens, Rainforest and Mediterranean Zones, Educational programs, Art installations |
| Charlestown | Heritage port famous for its historic ships and picturesque scenery. A great draw for visitors interested in history and maritime culture. | Charlestown Harbour, Tall Ships, Shipwreck and Heritage Centre, Local cafes and shops, Coastal walks |
| St. Austell | Nearby town offering a mix of urban amenities and easy access to natural attractions. Convenient for tourists exploring the wider area. | St. Austell Brewery, Porthpean Beach, Lost Gardens of Heligan, Shopping centers, Restaurants |
| Fowey | Picturesque town known for its stunning views and artistic community. A favorite for those seeking scenic beauty and local culture. | Fowey Harbour, Fowey estuary, Shopping in Fore Street, Local art galleries, Fowey River |
| Golant | Quaint village on the banks of the river Fowey, perfect for guests who enjoy tranquility and picturesque walks. | River walks, Boating activities, Local pub experience, Nearby countryside, Scenic views |
| Looe | Popular coastal town known for its beach and fisherman's charm, making it a favorite choice for beach-goers and families. | Looe Beach, Fishing trips, Local seafood restaurants, Historic Lifeboat Station, East Looe's shops |
Understanding Airbnb License Requirements & STR Laws in Tywardreath (2025)
While Tywardreath, England, United Kingdom currently shows low STR regulations, specific Airbnb license requirements might still exist or change. Always verify the latest short term rental regulations and Airbnb license requirements directly with local government authorities for Tywardreath to ensure full compliance before hosting.
(Source: AirROI data, 2025, finding no licensed listings among those analyzed)
Top Performing Airbnb Properties in Tywardreath (2025)
Benchmark your potential! Explore examples of top-performing Airbnb properties in Tywardreathbased on Trailing Twelve Month (TTM) revenue. Analyze their characteristics, revenue, occupancy rate, and ADR to understand what drives success in this market.

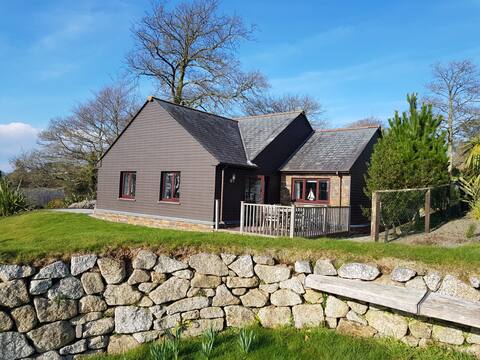
Cornish farmhouse ideal for large family groups!
Entire Place • 6 bedrooms

Homely Cottage & Garden nr Fowey, Private Parking
Entire Place • 3 bedrooms

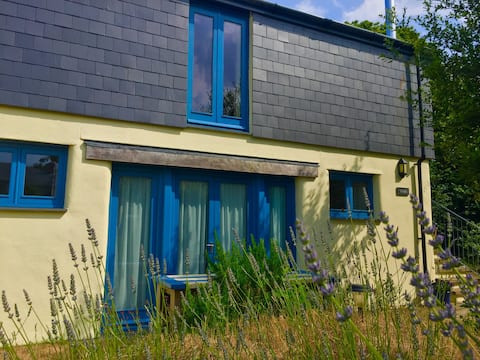
Primrose Spacious Eco Barn near Beaches & Fowey
Entire Place • 3 bedrooms

Walk to beach, nr Eden & Fowey, village location
Entire Place • 2 bedrooms
Spacious two- bedroom lodge near Fowey
Entire Place • 2 bedrooms
Violet Eco Barn Conversion Sea Views near Beaches
Entire Place • 2 bedrooms
Note: Performance varies based on location, size, amenities, seasonality, and management quality. Data reflects the past 12 months.
Top Performing Airbnb Hosts in Tywardreath (2025)
Learn from the best! This table showcases top-performing Airbnb hosts in Tywardreath based on the number of properties managed and estimated total revenue over the past year. Analyze their scale and performance metrics.
| Host Name | Properties | Grossing Revenue | Stay Reviews | Avg Rating |
|---|---|---|---|---|
| Susan | 2 | $97,674 | 34 | 4.91/5.0 |
| Jim | 2 | $64,945 | 11 | 5.00/5.0 |
| William | 1 | $46,205 | 60 | 4.62/5.0 |
| Cathy | 1 | $35,662 | 91 | 4.93/5.0 |
| Michael | 1 | $34,091 | 15 | 5.00/5.0 |
| Carolyn And Ray | 1 | $28,805 | 54 | 4.96/5.0 |
| Kelly | 1 | $25,694 | 13 | 5.00/5.0 |
| Anna | 1 | $24,911 | 93 | 4.80/5.0 |
| Deborah | 1 | $24,538 | 19 | 4.89/5.0 |
| Peter | 1 | $21,305 | 10 | 4.90/5.0 |
Analyzing the strategies of top hosts, such as their property selection, pricing, and guest communication, can offer valuable lessons for optimizing your own Airbnb operations in Tywardreath.
Dive Deeper: Advanced Tywardreath STR Market Data (2025)
Ready to unlock more insights? AirROI provides access to advanced metrics and comprehensive Airbnb data for Tywardreath. Explore detailed analytics beyond this report to refine your investment strategy, optimize pricing, and maximize your vacation rental profits.
Explore Advanced MetricsTywardreath Short-Term Rental Market Composition (2025): Property & Room Types
Room Type Distribution
Property Type Distribution
Market Composition Insights for Tywardreath
- The Tywardreath Airbnb market composition is heavily skewed towards Entire Home/Apt listings, which make up 100% of the 23 active rentals. This indicates strong guest preference for privacy and space.
- Looking at the property type distribution in Tywardreath, House properties are the most common (56.5%), reflecting the local real estate landscape.
- Houses represent a significant 56.5% portion, catering likely to families or larger groups.
- The presence of 8.7% Hotel/Boutique listings indicates integration with traditional hospitality.
- Smaller segments like apartment/condo (combined 4.3%) offer potential for unique stay experiences.
Tywardreath Airbnb Room Capacity Analysis (2025): Bedroom Distribution
Distribution of Listings by Number of Bedrooms
Room Capacity Insights for Tywardreath
- The dominant room capacity in Tywardreath is 2 bedrooms listings, making up 39.1% of the market. This suggests a strong demand for properties suitable for couples or solo travelers.
- Together, 2 bedrooms and 3 bedrooms properties represent 65.2% of the active Airbnb listings in Tywardreath, indicating a high concentration in these sizes.
- A significant 30.4% of listings offer 3+ bedrooms, catering to larger groups and families seeking more space in Tywardreath.
Tywardreath Vacation Rental Guest Capacity Trends (2025)
Distribution of Listings by Guest Capacity
Guest Capacity Insights for Tywardreath
- The most common guest capacity trend in Tywardreath vacation rentals is listings accommodating 4 guests (34.8%). This suggests the primary traveler segment is likely small families or groups.
- Properties designed for 4 guests and 6 guests dominate the Tywardreath STR market, accounting for 60.9% of listings.
- 34.8% of properties accommodate 6+ guests, serving the market segment for larger families or group travel in Tywardreath.
- On average, properties in Tywardreath are equipped to host 4.8 guests.
Tywardreath Airbnb Booking Patterns (2025): Available vs. Booked Days
Available Days Distribution
Booked Days Distribution
Booking Pattern Insights for Tywardreath
- The most common availability pattern in Tywardreath falls within the 181-270 days range, representing 65.2% of listings. This suggests many properties have significant open periods on their calendars.
- Approximately 91.3% of listings show high availability (181+ days open annually), indicating potential for increased bookings or specific owner usage patterns.
- For booked days, the 91-180 days range is most frequent in Tywardreath (60.9%), reflecting common guest stay durations or potential owner blocking patterns.
- A notable 13.0% of properties secure long booking periods (181+ days booked per year), highlighting successful long-term rental strategies or significant owner usage.
Tywardreath Airbnb Minimum Stay Requirements Analysis
Distribution of Listings by Minimum Night Requirement
1 Night
3 listings
13.6% of total
2 Nights
6 listings
27.3% of total
3 Nights
6 listings
27.3% of total
4-6 Nights
3 listings
13.6% of total
7-29 Nights
2 listings
9.1% of total
30+ Nights
2 listings
9.1% of total
Key Insights
- The most prevalent minimum stay requirement in Tywardreath is 2 Nights, adopted by 27.3% of listings. This highlights the market's preference for shorter, flexible bookings.
Recommendations
- Align with the market by considering a 2 Nights minimum stay, as 27.3% of Tywardreath hosts use this setting.
- If feasible, allowing 1-night stays, especially midweek or during low season, could capture last-minute bookings, as only 13.6% currently do.
- Explore offering discounts for stays of 30+ nights to attract the 9.1% of the market seeking extended stays.
- Adjust minimum nights based on seasonality – potentially shorter during low season and longer during peak demand periods in Tywardreath.
Tywardreath Airbnb Cancellation Policy Trends Analysis (2025)
Flexible
4 listings
19% of total
Moderate
4 listings
19% of total
Firm
7 listings
33.3% of total
Strict
6 listings
28.6% of total
Cancellation Policy Insights for Tywardreath
- The prevailing Airbnb cancellation policy trend in Tywardreath is Firm, used by 33.3% of listings.
- A majority (61.9%) of hosts in Tywardreath utilize Firm or Strict policies, indicating a market where hosts prioritize booking security.
Recommendations for Hosts
- Consider adopting a Firm policy to align with the 33.3% market standard in Tywardreath.
- Regularly review your cancellation policy against competitors and market demand shifts in Tywardreath.
Tywardreath STR Booking Lead Time Analysis (2025)
Average Booking Lead Time by Month
Booking Lead Time Insights for Tywardreath
- The overall average booking lead time for vacation rentals in Tywardreath is 63 days.
- Guests book furthest in advance for stays during July (average 135 days), likely coinciding with peak travel demand or local events.
- The shortest booking windows occur for stays in March (average 44 days), indicating more last-minute travel plans during this time.
- Seasonally, Summer (110 days avg.) sees the longest lead times, while Winter (61 days avg.) has the shortest, reflecting typical travel planning cycles.
Recommendations for Hosts
- Use the overall average lead time (63 days) as a baseline for your pricing and availability strategy in Tywardreath.
- For July stays, consider implementing length-of-stay discounts or slightly higher rates for bookings made less than 135 days out to capitalize on advance planning.
- Target marketing efforts for the Summer season well in advance (at least 110 days) to capture early planners.
- Monitor your own booking lead times against these Tywardreath averages to identify opportunities for dynamic pricing adjustments.
Popular & Essential Airbnb Amenities in Tywardreath (2025)
Amenity Prevalence
Amenity Insights for Tywardreath
- Essential amenities in Tywardreath that guests expect include: Wifi, Smoke alarm, Kitchen. Lacking these (any) could significantly impact bookings.
- Popular amenities like Heating, Hot water, Carbon monoxide alarm are common but not universal. Offering these can provide a competitive edge.
Recommendations for Hosts
- Ensure your listing includes all essential amenities for Tywardreath: Wifi, Smoke alarm, Kitchen.
- Prioritize adding missing essentials: Wifi, Smoke alarm, Kitchen.
- Consider adding popular differentiators like Heating or Hot water to increase appeal.
- Highlight unique or less common amenities you offer (e.g., hot tub, dedicated workspace, EV charger) in your listing description and photos.
- Regularly check competitor amenities in Tywardreath to stay competitive.
Tywardreath Airbnb Guest Demographics & Profile Analysis (2025)
Guest Profile Summary for Tywardreath
- The typical guest profile for Airbnb in Tywardreath consists of primarily domestic travelers (86%), often arriving from nearby England, typically belonging to the Post-2000s (Gen Z/Alpha) group (50%), primarily speaking English or Spanish.
- Domestic travelers account for 86.4% of guests.
- Key international markets include United Kingdom (86.4%) and United States (3%).
- Top languages spoken are English (68.4%) followed by Spanish (10.5%).
- A significant demographic segment is the Post-2000s (Gen Z/Alpha) group, representing 50% of guests.
Recommendations for Hosts
- Target domestic marketing efforts towards travelers from England and London.
- Tailor amenities and listing descriptions to appeal to the dominant Post-2000s (Gen Z/Alpha) demographic (e.g., highlight fast WiFi, smart home features, local guides).
- Highlight unique local experiences or amenities relevant to the primary guest profile.
- Consider seasonal promotions aligned with peak travel times for key origin markets.
Nearby Short-Term Rental Market Comparison
How does the Tywardreath Airbnb market stack up against its neighbors? Compare key performance metrics like average monthly revenue, ADR, and occupancy rates in surrounding areas to understand the broader regional STR landscape.
| Market | Active Properties | Monthly Revenue | Daily Rate | Avg. Occupancy |
|---|---|---|---|---|
| Llanrhidian | 15 | $4,842 | $386.18 | 53% |
| Crai | 20 | $4,799 | $371.85 | 46% |
| Trenance | 19 | $4,795 | $428.63 | 43% |
| Angle | 13 | $4,602 | $384.81 | 42% |
| Ludchurch | 15 | $4,354 | $291.87 | 43% |
| Redberth | 29 | $4,103 | $223.37 | 59% |
| Higher Crackington | 17 | $3,731 | $340.74 | 37% |
| Milverton | 11 | $3,675 | $393.89 | 37% |
| Pennorth | 13 | $3,595 | $417.69 | 37% |
| Gilwern | 22 | $3,505 | $193.56 | 53% |