Trowbridge Airbnb Market Analysis 2025: Short Term Rental Data & Vacation Rental Statistics in England, United Kingdom
Is Airbnb profitable in Trowbridge in 2025? Explore comprehensive Airbnb analytics for Trowbridge, England, United Kingdom to uncover income potential. This 2025 STR market report for Trowbridge, based on AirROI data from April 2024 to March 2025, reveals key trends in the niche market of 22 active listings.
Whether you're considering an Airbnb investment in Trowbridge, optimizing your existing vacation rental, or exploring rental arbitrage opportunities, understanding the Trowbridge Airbnb data is crucial. Leveraging the low regulation environment is key to maximizing your short term rental income potential. Let's dive into the specifics.
Key Trowbridge Airbnb Performance Metrics Overview
Monthly Airbnb Revenue Variations & Income Potential in Trowbridge (2025)
Understanding the monthly revenue variations for Airbnb listings in Trowbridge is key to maximizing your short term rental income potential. Seasonality significantly impacts earnings. Our analysis, based on data from the past 12 months, shows that the peak revenue month for STRs in Trowbridge is typically June, while February often presents the lowest earnings, highlighting opportunities for strategic pricing adjustments during shoulder and low seasons. Explore the typical Airbnb income in Trowbridge across different performance tiers:
- Best-in-class properties (Top 10%) achieve $5,513+ monthly, often utilizing dynamic pricing and superior guest experiences.
- Strong performing properties (Top 25%) earn $2,884 or more, indicating effective management and desirable locations/amenities.
- Typical properties (Median) generate around $1,323 per month, representing the average market performance.
- Entry-level properties (Bottom 25%) see earnings around $699, often with potential for optimization.
Average Monthly Airbnb Earnings Trend in Trowbridge
Trowbridge Airbnb Occupancy Rate Trends (2025)
Maximize your bookings by understanding the Trowbridge STR occupancy trends. Seasonal demand shifts significantly influence how often properties are booked. Typically, Julysees the highest demand (peak season occupancy), while June experiences the lowest (low season). Effective strategies, like adjusting minimum stays or offering promotions, can boost occupancy during slower periods. Here's how different property tiers perform in Trowbridge:
- Best-in-class properties (Top 10%) achieve 77%+ occupancy, indicating high desirability and potentially optimized availability.
- Strong performing properties (Top 25%) maintain 62% or higher occupancy, suggesting good market fit and guest satisfaction.
- Typical properties (Median) have an occupancy rate around 34%.
- Entry-level properties (Bottom 25%) average 17% occupancy, potentially facing higher vacancy.
Average Monthly Occupancy Rate Trend in Trowbridge
Average Daily Rate (ADR) Airbnb Trends in Trowbridge (2025)
Effective short term rental pricing strategy in Trowbridge involves understanding monthly ADR fluctuations. The Average Daily Rate (ADR) for Airbnb in Trowbridge typically peaks in December and dips lowest during April. Leveraging Airbnb dynamic pricing tools or strategies based on this seasonality can significantly boost revenue. Here's a look at the typical nightly rates achieved:
- Best-in-class properties (Top 10%) command rates of $363+ per night, often due to premium features or locations.
- Strong performing properties (Top 25%) achieve nightly rates of $146 or more.
- Typical properties (Median) charge around $113 per night.
- Entry-level properties (Bottom 25%) earn around $71 per night.
Average Daily Rate (ADR) Trend by Month in Trowbridge
Get Live Trowbridge Market Intelligence 👇

Explore Real-time Analytics
Airbnb Seasonality Analysis & Trends in Trowbridge (2025)
Peak Season (June, May, April)
- Revenue averages $3,231 per month
- Occupancy rates average 35.8%
- Daily rates average $142
Shoulder Season
- Revenue averages $2,580 per month
- Occupancy maintains around 44.6%
- Daily rates hold near $160
Low Season (January, February, March)
- Revenue drops to average $1,775 per month
- Occupancy decreases to average 34.3%
- Daily rates adjust to average $177
Seasonality Insights for Trowbridge
- The Airbnb seasonality in Trowbridge shows highly seasonal trends requiring careful strategy. While the sections above show seasonal averages, it's also insightful to look at the extremes:
- During the high season, the absolute peak month showcases Trowbridge's highest earning potential, with monthly revenues capable of climbing to $3,518, occupancy reaching a high of 54.8%, and ADRs peaking at $193.
- Conversely, the slowest single month of the year, typically falling within the low season, marks the market's lowest point. In this month, revenue might dip to $1,696, occupancy could drop to 30.0%, and ADRs may adjust down to $140.
- Understanding both the seasonal averages and these monthly peaks and troughs in revenue, occupancy, and ADR is crucial for maximizing your Airbnb profit potential in Trowbridge.
Seasonal Strategies for Maximizing Profit
- Peak Season: Maximize revenue through premium pricing and potentially longer minimum stays. Ensure high availability.
- Low Season: Offer competitive pricing, special promotions (e.g., extended stay discounts), and flexible cancellation policies. Target off-season travelers like remote workers or budget-conscious guests.
- Shoulder Seasons: Implement dynamic pricing that balances peak and low rates. Target weekend travelers or specific events. Offer slightly more flexible terms than peak season.
- Regularly analyze your own performance against these Trowbridge seasonality benchmarks and adjust your pricing and availability strategy accordingly.
Best Areas for Airbnb Investment in Trowbridge (2025)
Exploring the top neighborhoods for short-term rentals in Trowbridge? This section highlights key areas, outlining why they are attractive for hosts and guests, along with notable local attractions. Consider these locations based on your target guest profile and investment strategy.
| Neighborhood / Area | Why Host Here? (Target Guests & Appeal) | Key Attractions & Landmarks |
|---|---|---|
| The Shires | A picturesque area known for its charming scenery and historic buildings, appealing to tourists looking for a tranquil countryside experience. | Trowbridge Museum and Art gallery, The County Court, St. James Church, The Shire Valley, Longmeadow Park |
| Trowbridge Town Centre | The vibrant heart of Trowbridge with shopping, dining, and entertainment options, perfect for visitors wanting to immerse themselves in local culture. | The Place Theatre, Trowbridge Park, Fabulous Vintage, St. Mary's Church, Shires Shopping Centre |
| Studley Green | A peaceful suburb with parks and green spaces, ideal for families and those seeking a quiet stay close to nature. | Studley Green Park, Trowbridge Sports Centre, Walking trails, Local shops |
| West Ashton | A neighboring village that offers a charming rural atmosphere and easy access to nearby attractions, ideal for learning about local life. | West Ashton Church, Village Pub, Countryside walks, Local farms |
| Hilperton | A scenic village with historical significance, perfect for those seeking a rural getaway not far from the town center. | Hilperton Marsh, Local nature reserves, Historic buildings, Community events |
| Melksham | Just a short distance from Trowbridge, Melksham has its own attractions and a community vibe, offering a great alternative stay. | The Melksham Assembly Hall, Local Parks, Restaurants, River Avon |
| Bythesea Road | Centrally located, offering convenient access to major transport links and local amenities, suitable for business travelers and tourists. | Local cafes, Shops, Trowbridge Railway Station, Nearby public transport |
| Trowbridge Marina | A lovely spot by the water, perfect for leisure travelers looking for an outdoor experience and a residential feel. | The Marina's walking path, Fishing opportunities, Nearby cafes, Scenic views |
Understanding Airbnb License Requirements & STR Laws in Trowbridge (2025)
While Trowbridge, England, United Kingdom currently shows low STR regulations, specific Airbnb license requirements might still exist or change. Always verify the latest short term rental regulations and Airbnb license requirements directly with local government authorities for Trowbridge to ensure full compliance before hosting.
(Source: AirROI data, 2025, finding no licensed listings among those analyzed)
Top Performing Airbnb Properties in Trowbridge (2025)
Benchmark your potential! Explore examples of top-performing Airbnb properties in Trowbridgebased on Trailing Twelve Month (TTM) revenue. Analyze their characteristics, revenue, occupancy rate, and ADR to understand what drives success in this market.

Perfect Hen & Girls Weekend Big Cottage near Bath
Entire Place • 5 bedrooms

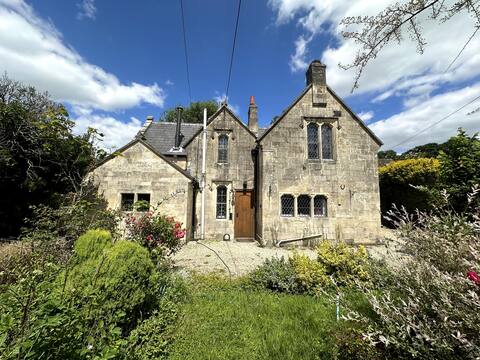
Historic Charm: *Perfect For Group Getaways*
Entire Place • 5 bedrooms
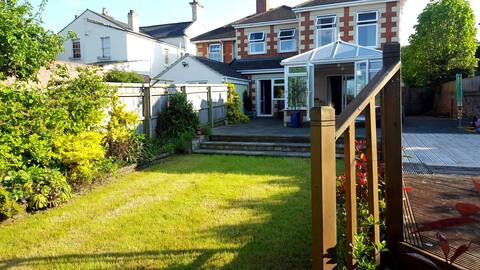
Beautiful, comfortable period home, large garden
Entire Place • 5 bedrooms

4 bed loft apartment near Longleat
Entire Place • 4 bedrooms
Trowbridge Lodge
Entire Place • 4 bedrooms

Luxury self-contained cabin with hot tub near Bath
Entire Place • 1 bedroom
Note: Performance varies based on location, size, amenities, seasonality, and management quality. Data reflects the past 12 months.
Top Performing Airbnb Hosts in Trowbridge (2025)
Learn from the best! This table showcases top-performing Airbnb hosts in Trowbridge based on the number of properties managed and estimated total revenue over the past year. Analyze their scale and performance metrics.
| Host Name | Properties | Grossing Revenue | Stay Reviews | Avg Rating |
|---|---|---|---|---|
| Rach | 1 | $167,210 | 220 | 4.96/5.0 |
| Tina | 3 | $126,833 | 44 | 4.97/5.0 |
| Umesh & Nessa | 1 | $61,193 | 272 | 4.75/5.0 |
| Julie | 1 | $41,719 | 36 | 4.42/5.0 |
| Aditi | 1 | $38,980 | 53 | 4.70/5.0 |
| Val | 1 | $37,321 | 134 | 4.99/5.0 |
| Toby | 1 | $30,754 | 499 | 4.91/5.0 |
| M | 1 | $22,920 | 23 | 4.91/5.0 |
| Robert | 3 | $22,179 | 15 | 4.22/5.0 |
| Sean | 1 | $18,003 | 20 | 4.85/5.0 |
Analyzing the strategies of top hosts, such as their property selection, pricing, and guest communication, can offer valuable lessons for optimizing your own Airbnb operations in Trowbridge.
Dive Deeper: Advanced Trowbridge STR Market Data (2025)
Ready to unlock more insights? AirROI provides access to advanced metrics and comprehensive Airbnb data for Trowbridge. Explore detailed analytics beyond this report to refine your investment strategy, optimize pricing, and maximize your vacation rental profits.
Explore Advanced MetricsTrowbridge Short-Term Rental Market Composition (2025): Property & Room Types
Room Type Distribution
Property Type Distribution
Market Composition Insights for Trowbridge
- The Trowbridge Airbnb market composition is heavily skewed towards Entire Home/Apt listings, which make up 68.2% of the 22 active rentals. This indicates strong guest preference for privacy and space.
- However, a notable 31.8% share for Private Rooms suggests opportunities for budget-conscious travelers or hosts renting out spare rooms.
- Looking at the property type distribution in Trowbridge, House properties are the most common (54.5%), reflecting the local real estate landscape.
- Houses represent a significant 54.5% portion, catering likely to families or larger groups.
- The presence of 13.6% Hotel/Boutique listings indicates integration with traditional hospitality.
- Smaller segments like outdoor/unique, unique stays, others (combined 13.5%) offer potential for unique stay experiences.
Trowbridge Airbnb Room Capacity Analysis (2025): Bedroom Distribution
Distribution of Listings by Number of Bedrooms
Room Capacity Insights for Trowbridge
- The dominant room capacity in Trowbridge is 1 bedroom listings, making up 45.5% of the market. This suggests a strong demand for properties suitable for couples or solo travelers.
- Together, 1 bedroom and 5+ bedrooms properties represent 59.1% of the active Airbnb listings in Trowbridge, indicating a high concentration in these sizes.
- A significant 22.7% of listings offer 3+ bedrooms, catering to larger groups and families seeking more space in Trowbridge.
Trowbridge Vacation Rental Guest Capacity Trends (2025)
Distribution of Listings by Guest Capacity
Guest Capacity Insights for Trowbridge
- The most common guest capacity trend in Trowbridge vacation rentals is listings accommodating 2 guests (40.9%). This suggests the primary traveler segment is likely couples or solo travelers.
- Properties designed for 2 guests and 8+ guests dominate the Trowbridge STR market, accounting for 63.6% of listings.
- A significant 45.4% of listings cater specifically to 1-2 guests, highlighting strong demand from couples and solo travelers in Trowbridge.
- 22.7% of properties accommodate 6+ guests, serving the market segment for larger families or group travel in Trowbridge.
- On average, properties in Trowbridge are equipped to host 3.0 guests.
Trowbridge Airbnb Booking Patterns (2025): Available vs. Booked Days
Available Days Distribution
Booked Days Distribution
Booking Pattern Insights for Trowbridge
- The most common availability pattern in Trowbridge falls within the 181-270 days range, representing 31.8% of listings. This suggests many properties have significant open periods on their calendars.
- Approximately 63.6% of listings show high availability (181+ days open annually), indicating potential for increased bookings or specific owner usage patterns.
- For booked days, the 91-180 days range is most frequent in Trowbridge (31.8%), reflecting common guest stay durations or potential owner blocking patterns.
- A notable 36.3% of properties secure long booking periods (181+ days booked per year), highlighting successful long-term rental strategies or significant owner usage.
Trowbridge Airbnb Minimum Stay Requirements Analysis
Distribution of Listings by Minimum Night Requirement
1 Night
8 listings
38.1% of total
2 Nights
9 listings
42.9% of total
3 Nights
1 listings
4.8% of total
7-29 Nights
1 listings
4.8% of total
30+ Nights
2 listings
9.5% of total
Key Insights
- The most prevalent minimum stay requirement in Trowbridge is 2 Nights, adopted by 42.9% of listings. This highlights the market's preference for shorter, flexible bookings.
- A strong majority (81.0%) of the Trowbridge Airbnb data shows acceptance of very short stays (1-2 nights), indicating a dynamic, high-turnover market.
Recommendations
- Align with the market by considering a 2 Nights minimum stay, as 42.9% of Trowbridge hosts use this setting.
- Explore offering discounts for stays of 30+ nights to attract the 9.5% of the market seeking extended stays.
- Adjust minimum nights based on seasonality – potentially shorter during low season and longer during peak demand periods in Trowbridge.
Trowbridge Airbnb Cancellation Policy Trends Analysis (2025)
Flexible
6 listings
30% of total
Moderate
9 listings
45% of total
Firm
4 listings
20% of total
Strict
1 listings
5% of total
Cancellation Policy Insights for Trowbridge
- The prevailing Airbnb cancellation policy trend in Trowbridge is Moderate, used by 45% of listings.
- The market strongly favors guest-friendly terms, with 75.0% of listings offering Flexible or Moderate policies. This suggests guests in Trowbridge may expect booking flexibility.
- Strict cancellation policies are quite rare (5%), potentially making listings with this policy less competitive unless justified by high demand or property type.
Recommendations for Hosts
- Consider adopting a Moderate policy to align with the 45% market standard in Trowbridge.
- Using a Strict policy might deter some guests, as only 5% of listings use it. Evaluate if potential revenue protection outweighs possible lower booking rates.
- Regularly review your cancellation policy against competitors and market demand shifts in Trowbridge.
Trowbridge STR Booking Lead Time Analysis (2025)
Average Booking Lead Time by Month
Booking Lead Time Insights for Trowbridge
- The overall average booking lead time for vacation rentals in Trowbridge is 39 days.
- Guests book furthest in advance for stays during July (average 87 days), likely coinciding with peak travel demand or local events.
- The shortest booking windows occur for stays in November (average 29 days), indicating more last-minute travel plans during this time.
- Seasonally, Spring (66 days avg.) sees the longest lead times, while Fall (42 days avg.) has the shortest, reflecting typical travel planning cycles.
Recommendations for Hosts
- Use the overall average lead time (39 days) as a baseline for your pricing and availability strategy in Trowbridge.
- For July stays, consider implementing length-of-stay discounts or slightly higher rates for bookings made less than 87 days out to capitalize on advance planning.
- Target marketing efforts for the Spring season well in advance (at least 66 days) to capture early planners.
- Monitor your own booking lead times against these Trowbridge averages to identify opportunities for dynamic pricing adjustments.
Popular & Essential Airbnb Amenities in Trowbridge (2025)
Amenity Prevalence
Amenity Insights for Trowbridge
- Essential amenities in Trowbridge that guests expect include: Wifi. Lacking these (this) could significantly impact bookings.
- Popular amenities like TV, Heating, Smoke alarm are common but not universal. Offering these can provide a competitive edge.
Recommendations for Hosts
- Ensure your listing includes all essential amenities for Trowbridge: Wifi.
- Consider adding popular differentiators like TV or Heating to increase appeal.
- Highlight unique or less common amenities you offer (e.g., hot tub, dedicated workspace, EV charger) in your listing description and photos.
- Regularly check competitor amenities in Trowbridge to stay competitive.
Trowbridge Airbnb Guest Demographics & Profile Analysis (2025)
Guest Profile Summary for Trowbridge
- The typical guest profile for Airbnb in Trowbridge consists of primarily domestic travelers (84%), often arriving from nearby England, typically belonging to the Post-2000s (Gen Z/Alpha) group (50%), primarily speaking English or Spanish.
- Domestic travelers account for 83.7% of guests.
- Key international markets include United Kingdom (83.7%) and United States (3.8%).
- Top languages spoken are English (70.2%) followed by Spanish (6.3%).
- A significant demographic segment is the Post-2000s (Gen Z/Alpha) group, representing 50% of guests.
Recommendations for Hosts
- Target domestic marketing efforts towards travelers from England and London.
- Tailor amenities and listing descriptions to appeal to the dominant Post-2000s (Gen Z/Alpha) demographic (e.g., highlight fast WiFi, smart home features, local guides).
- Highlight unique local experiences or amenities relevant to the primary guest profile.
- Consider seasonal promotions aligned with peak travel times for key origin markets.
Nearby Short-Term Rental Market Comparison
How does the Trowbridge Airbnb market stack up against its neighbors? Compare key performance metrics like average monthly revenue, ADR, and occupancy rates in surrounding areas to understand the broader regional STR landscape.
| Market | Active Properties | Monthly Revenue | Daily Rate | Avg. Occupancy |
|---|---|---|---|---|
| Englishcombe | 13 | $8,558 | $573.69 | 49% |
| Chew Magna | 14 | $6,649 | $399.59 | 46% |
| Lambourn | 11 | $6,081 | $669.47 | 28% |
| Long Sutton | 17 | $5,726 | $383.88 | 46% |
| Stoke St. Michael | 10 | $5,277 | $424.04 | 42% |
| Winsham | 10 | $5,154 | $484.22 | 52% |
| Oldland Common | 13 | $5,093 | $355.47 | 43% |
| Crai | 20 | $4,799 | $371.85 | 46% |
| Dinton | 11 | $4,637 | $242.16 | 58% |
| Limpley Stoke | 10 | $4,598 | $523.47 | 52% |