Trevivian Airbnb Market Analysis 2025: Short Term Rental Data & Vacation Rental Statistics in England, United Kingdom
Is Airbnb profitable in Trevivian in 2025? Explore comprehensive Airbnb analytics for Trevivian, England, United Kingdom to uncover income potential. This 2025 STR market report for Trevivian, based on AirROI data from April 2024 to March 2025, reveals key trends in the niche market of 46 active listings.
Whether you're considering an Airbnb investment in Trevivian, optimizing your existing vacation rental, or exploring rental arbitrage opportunities, understanding the Trevivian Airbnb data is crucial. Leveraging the low regulation environment is key to maximizing your short term rental income potential. Let's dive into the specifics.
Key Trevivian Airbnb Performance Metrics Overview
Monthly Airbnb Revenue Variations & Income Potential in Trevivian (2025)
Understanding the monthly revenue variations for Airbnb listings in Trevivian is key to maximizing your short term rental income potential. Seasonality significantly impacts earnings. Our analysis, based on data from the past 12 months, shows that the peak revenue month for STRs in Trevivian is typically April, while January often presents the lowest earnings, highlighting opportunities for strategic pricing adjustments during shoulder and low seasons. Explore the typical Airbnb income in Trevivian across different performance tiers:
- Best-in-class properties (Top 10%) achieve $6,073+ monthly, often utilizing dynamic pricing and superior guest experiences.
- Strong performing properties (Top 25%) earn $4,773 or more, indicating effective management and desirable locations/amenities.
- Typical properties (Median) generate around $2,974 per month, representing the average market performance.
- Entry-level properties (Bottom 25%) see earnings around $1,511, often with potential for optimization.
Average Monthly Airbnb Earnings Trend in Trevivian
Trevivian Airbnb Occupancy Rate Trends (2025)
Maximize your bookings by understanding the Trevivian STR occupancy trends. Seasonal demand shifts significantly influence how often properties are booked. Typically, Augustsees the highest demand (peak season occupancy), while January experiences the lowest (low season). Effective strategies, like adjusting minimum stays or offering promotions, can boost occupancy during slower periods. Here's how different property tiers perform in Trevivian:
- Best-in-class properties (Top 10%) achieve 71%+ occupancy, indicating high desirability and potentially optimized availability.
- Strong performing properties (Top 25%) maintain 53% or higher occupancy, suggesting good market fit and guest satisfaction.
- Typical properties (Median) have an occupancy rate around 37%.
- Entry-level properties (Bottom 25%) average 18% occupancy, potentially facing higher vacancy.
Average Monthly Occupancy Rate Trend in Trevivian
Average Daily Rate (ADR) Airbnb Trends in Trevivian (2025)
Effective short term rental pricing strategy in Trevivian involves understanding monthly ADR fluctuations. The Average Daily Rate (ADR) for Airbnb in Trevivian typically peaks in August and dips lowest during March. Leveraging Airbnb dynamic pricing tools or strategies based on this seasonality can significantly boost revenue. Here's a look at the typical nightly rates achieved:
- Best-in-class properties (Top 10%) command rates of $425+ per night, often due to premium features or locations.
- Strong performing properties (Top 25%) achieve nightly rates of $330 or more.
- Typical properties (Median) charge around $261 per night.
- Entry-level properties (Bottom 25%) earn around $196 per night.
Average Daily Rate (ADR) Trend by Month in Trevivian
Get Live Trevivian Market Intelligence 👇

Explore Real-time Analytics
Airbnb Seasonality Analysis & Trends in Trevivian (2025)
Peak Season (April, August, June)
- Revenue averages $5,056 per month
- Occupancy rates average 56.0%
- Daily rates average $295
Shoulder Season
- Revenue averages $3,078 per month
- Occupancy maintains around 35.6%
- Daily rates hold near $278
Low Season (January, February, November)
- Revenue drops to average $2,100 per month
- Occupancy decreases to average 26.8%
- Daily rates adjust to average $257
Seasonality Insights for Trevivian
- The Airbnb seasonality in Trevivian shows highly seasonal trends requiring careful strategy. While the sections above show seasonal averages, it's also insightful to look at the extremes:
- During the high season, the absolute peak month showcases Trevivian's highest earning potential, with monthly revenues capable of climbing to $5,529, occupancy reaching a high of 62.5%, and ADRs peaking at $297.
- Conversely, the slowest single month of the year, typically falling within the low season, marks the market's lowest point. In this month, revenue might dip to $1,947, occupancy could drop to 24.9%, and ADRs may adjust down to $243.
- Understanding both the seasonal averages and these monthly peaks and troughs in revenue, occupancy, and ADR is crucial for maximizing your Airbnb profit potential in Trevivian.
Seasonal Strategies for Maximizing Profit
- Peak Season: Maximize revenue through premium pricing and potentially longer minimum stays. Ensure high availability.
- Low Season: Offer competitive pricing, special promotions (e.g., extended stay discounts), and flexible cancellation policies. Target off-season travelers like remote workers or budget-conscious guests.
- Shoulder Seasons: Implement dynamic pricing that balances peak and low rates. Target weekend travelers or specific events. Offer slightly more flexible terms than peak season.
- Regularly analyze your own performance against these Trevivian seasonality benchmarks and adjust your pricing and availability strategy accordingly.
Best Areas for Airbnb Investment in Trevivian (2025)
Exploring the top neighborhoods for short-term rentals in Trevivian? This section highlights key areas, outlining why they are attractive for hosts and guests, along with notable local attractions. Consider these locations based on your target guest profile and investment strategy.
| Neighborhood / Area | Why Host Here? (Target Guests & Appeal) | Key Attractions & Landmarks |
|---|---|---|
| Bristol | A vibrant city known for its rich maritime history, cultural scene, and youthful energy. It's popular among both tourists and business visitors, making it a lucrative location for Airbnb hosting. | Bristol Zoo Gardens, SS Great Britain, Clifton Suspension Bridge, St Nicholas Market, Bristol Harbourside |
| Cornwall | Famous for its stunning coastlines, scenic beaches, and charming villages. A favorite holiday destination in the UK, ideal for nature lovers and families. | Fistral Beach, St Ives, The Eden Project, Tintagel Castle, Padstow |
| London | The capital city offers an abundance of attractions, cultural experiences, and diverse neighborhoods. Always in high demand for short-term rentals. | The British Museum, Tower of London, Buckingham Palace, Covent Garden, The Shard |
| Brighton | A seaside resort known for its lively atmosphere, iconic pier, and cultural events. Attracts visitors year-round for its nightlife and events. | Brighton Pier, Royal Pavilion, The Lanes, Brighton Beach, British Airways i360 |
| Bath | Known for its Roman-built baths and Georgian architecture, Bath is a UNESCO World Heritage site with a steady influx of tourists. | The Roman Baths, Bath Abbey, Pulteney Bridge, Thermae Bath Spa, Fashion Museum |
| Liverpool | Famous for its music scene, maritime history, and cultural heritage. A vibrant city that holds major events and attracts large crowds. | The Beatles Story, Royal Albert Dock, Anfield Stadium, Tate Liverpool, Liverpool Cathedral |
| Manchester | A major urban center with a rich industrial heritage and a thriving cultural scene, drawing sports fans, business travelers, and tourists alike. | Old Trafford, The Lowry, Manchester Art Gallery, Etihad Stadium, Northern Quarter |
| Edinburgh | Scotland's capital is renowned for its historic and cultural attractions, including its annual festivals, making it a prime location for Airbnbs throughout the year. | Edinburgh Castle, Holyrood Palace, Arthur's Seat, The Royal Mile, Edinburgh Festival |
Understanding Airbnb License Requirements & STR Laws in Trevivian (2025)
While Trevivian, England, United Kingdom currently shows low STR regulations, specific Airbnb license requirements might still exist or change. Always verify the latest short term rental regulations and Airbnb license requirements directly with local government authorities for Trevivian to ensure full compliance before hosting.
(Source: AirROI data, 2025, finding no licensed listings among those analyzed)
Top Performing Airbnb Properties in Trevivian (2025)
Benchmark your potential! Explore examples of top-performing Airbnb properties in Trevivianbased on Trailing Twelve Month (TTM) revenue. Analyze their characteristics, revenue, occupancy rate, and ADR to understand what drives success in this market.
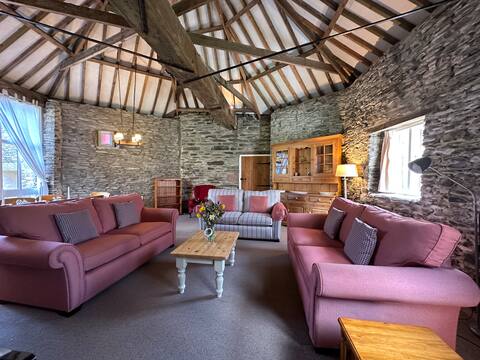
Farm Stay In Cornwall ‘Roundhouse’
Entire Place • 4 bedrooms

chy an Dour
Entire Place • 3 bedrooms

Ta Mill House by Interhome
Entire Place • 4 bedrooms

Beautifully crafted barn conversion
Entire Place • 2 bedrooms
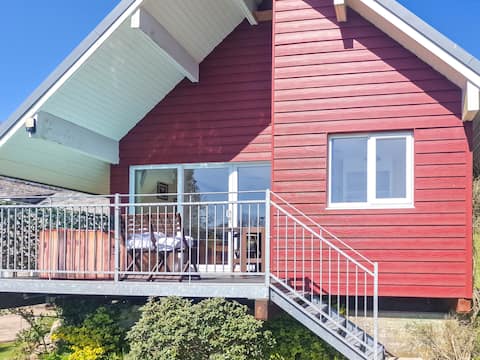
Ta Mill Meadowview Chalet 1 near Tintagel
Entire Place • N/A

Woolgarden: characterful, romantic and cosy
Entire Place • 1 bedroom
Note: Performance varies based on location, size, amenities, seasonality, and management quality. Data reflects the past 12 months.
Top Performing Airbnb Hosts in Trevivian (2025)
Learn from the best! This table showcases top-performing Airbnb hosts in Trevivian based on the number of properties managed and estimated total revenue over the past year. Analyze their scale and performance metrics.
| Host Name | Properties | Grossing Revenue | Stay Reviews | Avg Rating |
|---|---|---|---|---|
| Host #209472363 | 15 | $355,729 | 0 | 0.00/5.0 |
| Kamila | 15 | $313,169 | 87 | 3.90/5.0 |
| Emma | 2 | $85,373 | 16 | 5.00/5.0 |
| Sarah | 2 | $80,856 | 312 | 4.96/5.0 |
| Cottages | 3 | $71,526 | 5 | 1.60/5.0 |
| Mike | 2 | $44,963 | 517 | 4.85/5.0 |
| Guy | 1 | $26,890 | 56 | 4.82/5.0 |
| David | 1 | $25,588 | 6 | 5.00/5.0 |
| Emma | 1 | $16,849 | 100 | 4.77/5.0 |
| Host #397659887 | 1 | $15,644 | 0 | 0.00/5.0 |
Analyzing the strategies of top hosts, such as their property selection, pricing, and guest communication, can offer valuable lessons for optimizing your own Airbnb operations in Trevivian.
Dive Deeper: Advanced Trevivian STR Market Data (2025)
Ready to unlock more insights? AirROI provides access to advanced metrics and comprehensive Airbnb data for Trevivian. Explore detailed analytics beyond this report to refine your investment strategy, optimize pricing, and maximize your vacation rental profits.
Explore Advanced MetricsTrevivian Short-Term Rental Market Composition (2025): Property & Room Types
Room Type Distribution
Property Type Distribution
Market Composition Insights for Trevivian
- The Trevivian Airbnb market composition is heavily skewed towards Entire Home/Apt listings, which make up 97.8% of the 46 active rentals. This indicates strong guest preference for privacy and space.
- Looking at the property type distribution in Trevivian, House properties are the most common (82.6%), reflecting the local real estate landscape.
- Houses represent a significant 82.6% portion, catering likely to families or larger groups.
- Smaller segments like apartment/condo, hotel/boutique, others, unique stays (combined 10.9%) offer potential for unique stay experiences.
Trevivian Airbnb Room Capacity Analysis (2025): Bedroom Distribution
Distribution of Listings by Number of Bedrooms
Room Capacity Insights for Trevivian
- The dominant room capacity in Trevivian is 2 bedrooms listings, making up 45.7% of the market. This suggests a strong demand for properties suitable for couples or solo travelers.
- Together, 2 bedrooms and 1 bedroom properties represent 71.8% of the active Airbnb listings in Trevivian, indicating a high concentration in these sizes.
- A significant 23.9% of listings offer 3+ bedrooms, catering to larger groups and families seeking more space in Trevivian.
Trevivian Vacation Rental Guest Capacity Trends (2025)
Distribution of Listings by Guest Capacity
Guest Capacity Insights for Trevivian
- The most common guest capacity trend in Trevivian vacation rentals is listings accommodating 4 guests (45.7%). This suggests the primary traveler segment is likely small families or groups.
- Properties designed for 4 guests and 2 guests dominate the Trevivian STR market, accounting for 65.3% of listings.
- 23.9% of properties accommodate 6+ guests, serving the market segment for larger families or group travel in Trevivian.
- On average, properties in Trevivian are equipped to host 4.3 guests.
Trevivian Airbnb Booking Patterns (2025): Available vs. Booked Days
Available Days Distribution
Booked Days Distribution
Booking Pattern Insights for Trevivian
- The most common availability pattern in Trevivian falls within the 271-366 days range, representing 69.6% of listings. This suggests many properties have significant open periods on their calendars.
- Approximately 91.3% of listings show high availability (181+ days open annually), indicating potential for increased bookings or specific owner usage patterns.
- For booked days, the 31-90 days range is most frequent in Trevivian (58.7%), reflecting common guest stay durations or potential owner blocking patterns.
- A notable 8.7% of properties secure long booking periods (181+ days booked per year), highlighting successful long-term rental strategies or significant owner usage.
Trevivian Airbnb Minimum Stay Requirements Analysis
Distribution of Listings by Minimum Night Requirement
1 Night
4 listings
8.7% of total
2 Nights
18 listings
39.1% of total
3 Nights
9 listings
19.6% of total
4-6 Nights
2 listings
4.3% of total
7-29 Nights
1 listings
2.2% of total
30+ Nights
12 listings
26.1% of total
Key Insights
- The most prevalent minimum stay requirement in Trevivian is 2 Nights, adopted by 39.1% of listings. This highlights the market's preference for shorter, flexible bookings.
- A significant segment (26.1%) caters to monthly stays (30+ nights) in Trevivian, pointing to opportunities in the extended-stay market.
Recommendations
- Align with the market by considering a 2 Nights minimum stay, as 39.1% of Trevivian hosts use this setting.
- If feasible, allowing 1-night stays, especially midweek or during low season, could capture last-minute bookings, as only 8.7% currently do.
- A 2-night minimum appears standard (39.1%). Consider this for weekends or peak periods.
- Explore offering discounts for stays of 30+ nights to attract the 26.1% of the market seeking extended stays.
- Adjust minimum nights based on seasonality – potentially shorter during low season and longer during peak demand periods in Trevivian.
Trevivian Airbnb Cancellation Policy Trends Analysis (2025)
Super Strict 60 Days
1 listings
4.2% of total
Moderate
4 listings
16.7% of total
Firm
16 listings
66.7% of total
Strict
3 listings
12.5% of total
Cancellation Policy Insights for Trevivian
- The prevailing Airbnb cancellation policy trend in Trevivian is Firm, used by 66.7% of listings.
- A majority (79.2%) of hosts in Trevivian utilize Firm or Strict policies, indicating a market where hosts prioritize booking security.
Recommendations for Hosts
- Consider adopting a Firm policy to align with the 66.7% market standard in Trevivian.
- Using a Strict policy might deter some guests, as only 12.5% of listings use it. Evaluate if potential revenue protection outweighs possible lower booking rates.
- Regularly review your cancellation policy against competitors and market demand shifts in Trevivian.
Trevivian STR Booking Lead Time Analysis (2025)
Average Booking Lead Time by Month
Booking Lead Time Insights for Trevivian
- The overall average booking lead time for vacation rentals in Trevivian is 34 days.
- Guests book furthest in advance for stays during June (average 161 days), likely coinciding with peak travel demand or local events.
- The shortest booking windows occur for stays in November (average 23 days), indicating more last-minute travel plans during this time.
- Seasonally, Summer (118 days avg.) sees the longest lead times, while Fall (31 days avg.) has the shortest, reflecting typical travel planning cycles.
Recommendations for Hosts
- Use the overall average lead time (34 days) as a baseline for your pricing and availability strategy in Trevivian.
- For June stays, consider implementing length-of-stay discounts or slightly higher rates for bookings made less than 161 days out to capitalize on advance planning.
- Target marketing efforts for the Summer season well in advance (at least 118 days) to capture early planners.
- Monitor your own booking lead times against these Trevivian averages to identify opportunities for dynamic pricing adjustments.
Popular & Essential Airbnb Amenities in Trevivian (2025)
Amenity Prevalence
Amenity Insights for Trevivian
- Essential amenities in Trevivian that guests expect include: TV, Heating, Hangers, Free parking on premises, Smoke alarm, Wifi, Kitchen, Cooking basics. Lacking these (any) could significantly impact bookings.
- Popular amenities like Carbon monoxide alarm, Dishes and silverware are common but not universal. Offering these can provide a competitive edge.
Recommendations for Hosts
- Ensure your listing includes all essential amenities for Trevivian: TV, Heating, Hangers, Free parking on premises, Smoke alarm, Wifi, Kitchen, Cooking basics.
- Prioritize adding missing essentials: Kitchen, Cooking basics.
- Consider adding popular differentiators like Carbon monoxide alarm or Dishes and silverware to increase appeal.
- Highlight unique or less common amenities you offer (e.g., hot tub, dedicated workspace, EV charger) in your listing description and photos.
- Regularly check competitor amenities in Trevivian to stay competitive.
Trevivian Airbnb Guest Demographics & Profile Analysis (2025)
Guest Profile Summary for Trevivian
- The typical guest profile for Airbnb in Trevivian consists of primarily domestic travelers (87%), often arriving from nearby England, typically belonging to the Post-2000s (Gen Z/Alpha) group (50%), primarily speaking English or French.
- Domestic travelers account for 87.2% of guests.
- Key international markets include United Kingdom (87.2%) and Germany (4%).
- Top languages spoken are English (69.9%) followed by French (8.2%).
- A significant demographic segment is the Post-2000s (Gen Z/Alpha) group, representing 50% of guests.
Recommendations for Hosts
- Target domestic marketing efforts towards travelers from England and London.
- Tailor amenities and listing descriptions to appeal to the dominant Post-2000s (Gen Z/Alpha) demographic (e.g., highlight fast WiFi, smart home features, local guides).
- Highlight unique local experiences or amenities relevant to the primary guest profile.
- Consider seasonal promotions aligned with peak travel times for key origin markets.
Nearby Short-Term Rental Market Comparison
How does the Trevivian Airbnb market stack up against its neighbors? Compare key performance metrics like average monthly revenue, ADR, and occupancy rates in surrounding areas to understand the broader regional STR landscape.
| Market | Active Properties | Monthly Revenue | Daily Rate | Avg. Occupancy |
|---|---|---|---|---|
| Llanrhidian | 15 | $4,842 | $386.18 | 53% |
| Crai | 20 | $4,799 | $371.85 | 46% |
| Trenance | 19 | $4,795 | $428.63 | 43% |
| Angle | 13 | $4,602 | $384.81 | 42% |
| Ludchurch | 15 | $4,354 | $291.87 | 43% |
| Redberth | 29 | $4,103 | $223.37 | 59% |
| Higher Crackington | 17 | $3,731 | $340.74 | 37% |
| Milverton | 11 | $3,675 | $393.89 | 37% |
| Pennorth | 13 | $3,595 | $417.69 | 37% |
| Gilwern | 22 | $3,505 | $193.56 | 53% |