Telford Airbnb Market Analysis 2025: Short Term Rental Data & Vacation Rental Statistics in England, United Kingdom
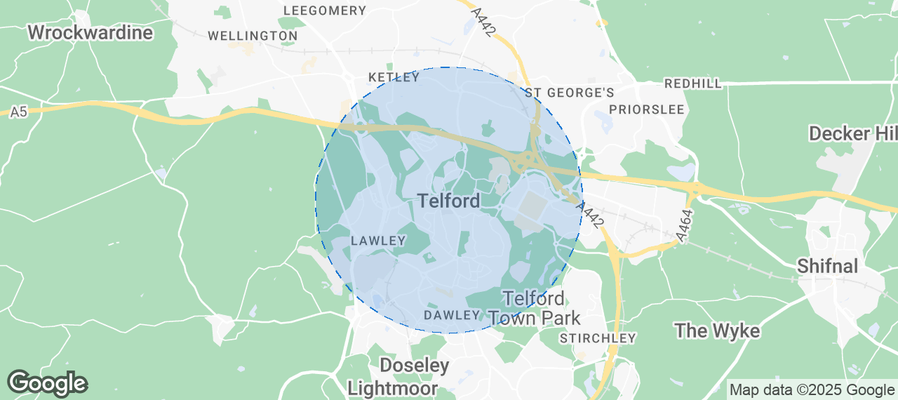
Is Airbnb profitable in Telford in 2025? Explore comprehensive Airbnb analytics for Telford, England, United Kingdom to uncover income potential. This 2025 STR market report for Telford, based on AirROI data from April 2024 to March 2025, reveals key trends in the niche market of 27 active listings.
Whether you're considering an Airbnb investment in Telford, optimizing your existing vacation rental, or exploring rental arbitrage opportunities, understanding the Telford Airbnb data is crucial. Leveraging the low regulation environment is key to maximizing your short term rental income potential. Let's dive into the specifics.
Key Telford Airbnb Performance Metrics Overview
Monthly Airbnb Revenue Variations & Income Potential in Telford (2025)
Understanding the monthly revenue variations for Airbnb listings in Telford is key to maximizing your short term rental income potential. Seasonality significantly impacts earnings. Our analysis, based on data from the past 12 months, shows that the peak revenue month for STRs in Telford is typically December, while March often presents the lowest earnings, highlighting opportunities for strategic pricing adjustments during shoulder and low seasons. Explore the typical Airbnb income in Telford across different performance tiers:
- Best-in-class properties (Top 10%) achieve $5,809+ monthly, often utilizing dynamic pricing and superior guest experiences.
- Strong performing properties (Top 25%) earn $2,388 or more, indicating effective management and desirable locations/amenities.
- Typical properties (Median) generate around $1,236 per month, representing the average market performance.
- Entry-level properties (Bottom 25%) see earnings around $556, often with potential for optimization.
Average Monthly Airbnb Earnings Trend in Telford
Telford Airbnb Occupancy Rate Trends (2025)
Maximize your bookings by understanding the Telford STR occupancy trends. Seasonal demand shifts significantly influence how often properties are booked. Typically, Julysees the highest demand (peak season occupancy), while March experiences the lowest (low season). Effective strategies, like adjusting minimum stays or offering promotions, can boost occupancy during slower periods. Here's how different property tiers perform in Telford:
- Best-in-class properties (Top 10%) achieve 72%+ occupancy, indicating high desirability and potentially optimized availability.
- Strong performing properties (Top 25%) maintain 57% or higher occupancy, suggesting good market fit and guest satisfaction.
- Typical properties (Median) have an occupancy rate around 33%.
- Entry-level properties (Bottom 25%) average 17% occupancy, potentially facing higher vacancy.
Average Monthly Occupancy Rate Trend in Telford
Average Daily Rate (ADR) Airbnb Trends in Telford (2025)
Effective short term rental pricing strategy in Telford involves understanding monthly ADR fluctuations. The Average Daily Rate (ADR) for Airbnb in Telford typically peaks in December and dips lowest during September. Leveraging Airbnb dynamic pricing tools or strategies based on this seasonality can significantly boost revenue. Here's a look at the typical nightly rates achieved:
- Best-in-class properties (Top 10%) command rates of $237+ per night, often due to premium features or locations.
- Strong performing properties (Top 25%) achieve nightly rates of $161 or more.
- Typical properties (Median) charge around $118 per night.
- Entry-level properties (Bottom 25%) earn around $52 per night.
Average Daily Rate (ADR) Trend by Month in Telford
Get Live Telford Market Intelligence 👇
Explore Real-time Analytics
Airbnb Seasonality Analysis & Trends in Telford (2025)
Peak Season (December, July, November)
- Revenue averages $2,978 per month
- Occupancy rates average 45.4%
- Daily rates average $150
Shoulder Season
- Revenue averages $2,297 per month
- Occupancy maintains around 39.4%
- Daily rates hold near $138
Low Season (January, March, June)
- Revenue drops to average $1,749 per month
- Occupancy decreases to average 29.4%
- Daily rates adjust to average $153
Seasonality Insights for Telford
- The Airbnb seasonality in Telford shows highly seasonal trends requiring careful strategy. While the sections above show seasonal averages, it's also insightful to look at the extremes:
- During the high season, the absolute peak month showcases Telford's highest earning potential, with monthly revenues capable of climbing to $3,416, occupancy reaching a high of 53.0%, and ADRs peaking at $172.
- Conversely, the slowest single month of the year, typically falling within the low season, marks the market's lowest point. In this month, revenue might dip to $1,396, occupancy could drop to 25.0%, and ADRs may adjust down to $132.
- Understanding both the seasonal averages and these monthly peaks and troughs in revenue, occupancy, and ADR is crucial for maximizing your Airbnb profit potential in Telford.
Seasonal Strategies for Maximizing Profit
- Peak Season: Maximize revenue through premium pricing and potentially longer minimum stays. Ensure high availability.
- Low Season: Offer competitive pricing, special promotions (e.g., extended stay discounts), and flexible cancellation policies. Target off-season travelers like remote workers or budget-conscious guests.
- Shoulder Seasons: Implement dynamic pricing that balances peak and low rates. Target weekend travelers or specific events. Offer slightly more flexible terms than peak season.
- Regularly analyze your own performance against these Telford seasonality benchmarks and adjust your pricing and availability strategy accordingly.
Best Areas for Airbnb Investment in Telford (2025)
Exploring the top neighborhoods for short-term rentals in Telford? This section highlights key areas, outlining why they are attractive for hosts and guests, along with notable local attractions. Consider these locations based on your target guest profile and investment strategy.
| Neighborhood / Area | Why Host Here? (Target Guests & Appeal) | Key Attractions & Landmarks |
|---|---|---|
| Telford Town Centre | The heart of Telford with shops, restaurants, and entertainment options. A central hub for visitors looking for convenience and access to local amenities. | Telford Shopping Centre, Southwater, The International Centre, Telford Ice Rink, Wonderland Telford |
| Ironbridge | A UNESCO World Heritage site known for its historical significance and stunning scenery. Ideal for guests interested in history and nature, with picturesque landscapes. | Iron Bridge, Coalbrookdale Museum of Iron, The Tar Tunnel, Blists Hill Victorian Town, Benthall Hall |
| Wellington | A charming market town with a rich history and a variety of local shops and eateries. Attracts visitors looking for a quaint English town experience. | Wellington Market, The Wrekin, Wellington Park, Ironmaster's Arms, The Old Grammar School |
| Madeley | A quiet village with beautiful parks and local history. Great for guests who prefer a more peaceful setting while still being close to Telford attractions. | Madeley Court, The Festival Drayton Centre, The Old Barn, Merrington Hall |
| Shifnal | A picturesque town with a blend of history and hospitality, popular with those seeking a peaceful retreat and proximity to attractions like the RAF Museum. | RAF Museum Cosford, Shifnal Golf Club, The Black Horse Inn, St. Andrews Church, Shifnal Town Centre |
| Stafford Park | An industrial area with growing business amenities and hotels. A good location for business travelers or those attending conferences. | Silkin Way, Telford Business Park, The Engine Shop |
| Telford New Town | A newer development area with modern housing and amenities. Attractive to families and visitors looking for contemporary living spaces. | New Town Park, Hawthorn Park, Local Shopping Centres |
| The Wrekin | A large hill offering stunning views and walking paths, perfect for nature lovers and outdoor enthusiasts looking for a break from city life. | The Wrekin Hill, Ercall Wood, Wrekin Forest |
Understanding Airbnb License Requirements & STR Laws in Telford (2025)
While Telford, England, United Kingdom currently shows low STR regulations, specific Airbnb license requirements might still exist or change. Always verify the latest short term rental regulations and Airbnb license requirements directly with local government authorities for Telford to ensure full compliance before hosting.
(Source: AirROI data, 2025, finding no licensed listings among those analyzed)
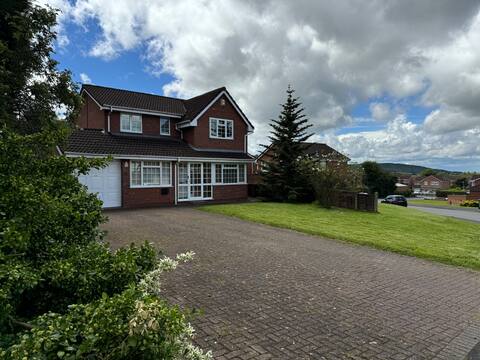
Top Performing Airbnb Properties in Telford (2025)
Benchmark your potential! Explore examples of top-performing Airbnb properties in Telfordbased on Trailing Twelve Month (TTM) revenue. Analyze their characteristics, revenue, occupancy rate, and ADR to understand what drives success in this market.

Ketley Vallens - An Especially Beautiful Home
Entire Place • 5 bedrooms
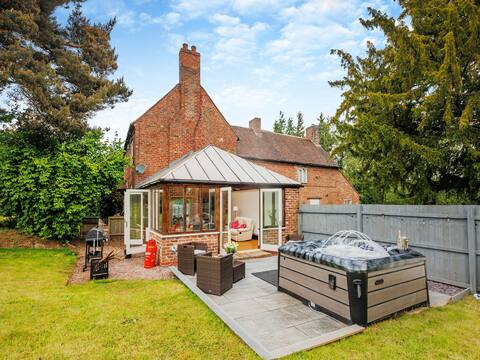
Blythbury Farmhouse
Entire Place • 3 bedrooms

Spacious White House with parking, garden, Wi-Fi
Entire Place • 3 bedrooms
The Rock - Telford Town Centre - 4 Double Beds
Entire Place • 4 bedrooms

Family-Friendly Home w/ Exceptional Host!
Entire Place • 3 bedrooms

A Compact & Quiet 4 Person Home Central to Telford
Entire Place • 2 bedrooms
Note: Performance varies based on location, size, amenities, seasonality, and management quality. Data reflects the past 12 months.
Top Performing Airbnb Hosts in Telford (2025)
Learn from the best! This table showcases top-performing Airbnb hosts in Telford based on the number of properties managed and estimated total revenue over the past year. Analyze their scale and performance metrics.
| Host Name | Properties | Grossing Revenue | Stay Reviews | Avg Rating |
|---|---|---|---|---|
| Daniel | 1 | $138,636 | 65 | 4.98/5.0 |
| Cottages | 1 | $77,344 | 6 | 3.83/5.0 |
| Pradip | 1 | $51,264 | 23 | 4.78/5.0 |
| City Nine | 5 | $50,429 | 79 | 4.75/5.0 |
| Kiran | 1 | $40,230 | 37 | 4.95/5.0 |
| Bal | 1 | $35,512 | 32 | 5.00/5.0 |
| Sarah | 2 | $24,404 | 15 | 2.50/5.0 |
| Amanda | 1 | $22,793 | 72 | 4.97/5.0 |
| Vincent | 1 | $19,988 | 16 | 4.94/5.0 |
| Vicki | 1 | $16,740 | 78 | 4.99/5.0 |
Analyzing the strategies of top hosts, such as their property selection, pricing, and guest communication, can offer valuable lessons for optimizing your own Airbnb operations in Telford.
Dive Deeper: Advanced Telford STR Market Data (2025)
Ready to unlock more insights? AirROI provides access to advanced metrics and comprehensive Airbnb data for Telford. Explore detailed analytics beyond this report to refine your investment strategy, optimize pricing, and maximize your vacation rental profits.
Explore Advanced MetricsTelford Short-Term Rental Market Composition (2025): Property & Room Types
Room Type Distribution
Property Type Distribution
Market Composition Insights for Telford
- The Telford Airbnb market composition is heavily skewed towards Entire Home/Apt listings, which make up 66.7% of the 27 active rentals. This indicates strong guest preference for privacy and space.
- However, a notable 33.3% share for Private Rooms suggests opportunities for budget-conscious travelers or hosts renting out spare rooms.
- Looking at the property type distribution in Telford, House properties are the most common (59.3%), reflecting the local real estate landscape.
- Houses represent a significant 59.3% portion, catering likely to families or larger groups.
- The presence of 11.1% Hotel/Boutique listings indicates integration with traditional hospitality.
Telford Airbnb Room Capacity Analysis (2025): Bedroom Distribution
Distribution of Listings by Number of Bedrooms
Room Capacity Insights for Telford
- The dominant room capacity in Telford is 1 bedroom listings, making up 37% of the market. This suggests a strong demand for properties suitable for couples or solo travelers.
- Together, 1 bedroom and 2 bedrooms properties represent 59.2% of the active Airbnb listings in Telford, indicating a high concentration in these sizes.
- A significant 25.9% of listings offer 3+ bedrooms, catering to larger groups and families seeking more space in Telford.
Telford Vacation Rental Guest Capacity Trends (2025)
Distribution of Listings by Guest Capacity
Guest Capacity Insights for Telford
- The most common guest capacity trend in Telford vacation rentals is listings accommodating 4 guests (29.6%). This suggests the primary traveler segment is likely small families or groups.
- Properties designed for 4 guests and 6 guests dominate the Telford STR market, accounting for 55.5% of listings.
- 29.6% of properties accommodate 6+ guests, serving the market segment for larger families or group travel in Telford.
- On average, properties in Telford are equipped to host 3.6 guests.
Telford Airbnb Booking Patterns (2025): Available vs. Booked Days
Available Days Distribution
Booked Days Distribution
Booking Pattern Insights for Telford
- The most common availability pattern in Telford falls within the 271-366 days range, representing 51.9% of listings. This suggests many properties have significant open periods on their calendars.
- Approximately 77.8% of listings show high availability (181+ days open annually), indicating potential for increased bookings or specific owner usage patterns.
- For booked days, the 31-90 days range is most frequent in Telford (25.9%), reflecting common guest stay durations or potential owner blocking patterns.
- A notable 22.2% of properties secure long booking periods (181+ days booked per year), highlighting successful long-term rental strategies or significant owner usage.
Telford Airbnb Minimum Stay Requirements Analysis
Distribution of Listings by Minimum Night Requirement
1 Night
7 listings
33.3% of total
2 Nights
7 listings
33.3% of total
3 Nights
2 listings
9.5% of total
4-6 Nights
1 listings
4.8% of total
30+ Nights
4 listings
19% of total
Key Insights
- The most prevalent minimum stay requirement in Telford is 1 Night, adopted by 33.3% of listings. This highlights the market's preference for shorter, flexible bookings.
- A strong majority (66.6%) of the Telford Airbnb data shows acceptance of very short stays (1-2 nights), indicating a dynamic, high-turnover market.
- A significant segment (19%) caters to monthly stays (30+ nights) in Telford, pointing to opportunities in the extended-stay market.
Recommendations
- Align with the market by considering a 1 Night minimum stay, as 33.3% of Telford hosts use this setting.
- Explore offering discounts for stays of 30+ nights to attract the 19% of the market seeking extended stays.
- Adjust minimum nights based on seasonality – potentially shorter during low season and longer during peak demand periods in Telford.
Telford Airbnb Cancellation Policy Trends Analysis (2025)
Refundable
1 listings
4.3% of total
Super Strict 60 Days
1 listings
4.3% of total
Flexible
7 listings
30.4% of total
Moderate
10 listings
43.5% of total
Firm
1 listings
4.3% of total
Strict
3 listings
13% of total
Cancellation Policy Insights for Telford
- The prevailing Airbnb cancellation policy trend in Telford is Moderate, used by 43.5% of listings.
- The market strongly favors guest-friendly terms, with 73.9% of listings offering Flexible or Moderate policies. This suggests guests in Telford may expect booking flexibility.
Recommendations for Hosts
- Consider adopting a Moderate policy to align with the 43.5% market standard in Telford.
- Using a Strict policy might deter some guests, as only 13% of listings use it. Evaluate if potential revenue protection outweighs possible lower booking rates.
- Regularly review your cancellation policy against competitors and market demand shifts in Telford.
Telford STR Booking Lead Time Analysis (2025)
Average Booking Lead Time by Month
Booking Lead Time Insights for Telford
- The overall average booking lead time for vacation rentals in Telford is 43 days.
- Guests book furthest in advance for stays during May (average 98 days), likely coinciding with peak travel demand or local events.
- The shortest booking windows occur for stays in January (average 20 days), indicating more last-minute travel plans during this time.
- Seasonally, Summer (61 days avg.) sees the longest lead times, while Winter (21 days avg.) has the shortest, reflecting typical travel planning cycles.
Recommendations for Hosts
- Use the overall average lead time (43 days) as a baseline for your pricing and availability strategy in Telford.
- For May stays, consider implementing length-of-stay discounts or slightly higher rates for bookings made less than 98 days out to capitalize on advance planning.
- Target marketing efforts for the Summer season well in advance (at least 61 days) to capture early planners.
- Monitor your own booking lead times against these Telford averages to identify opportunities for dynamic pricing adjustments.
Popular & Essential Airbnb Amenities in Telford (2025)
Amenity Prevalence
Amenity Insights for Telford
- Essential amenities in Telford that guests expect include: Wifi, Smoke alarm, Heating, Hot water, Kitchen. Lacking these (any) could significantly impact bookings.
- Popular amenities like Essentials, Refrigerator, Dishes and silverware are common but not universal. Offering these can provide a competitive edge.
Recommendations for Hosts
- Ensure your listing includes all essential amenities for Telford: Wifi, Smoke alarm, Heating, Hot water, Kitchen.
- Prioritize adding missing essentials: Hot water, Kitchen.
- Consider adding popular differentiators like Essentials or Refrigerator to increase appeal.
- Highlight unique or less common amenities you offer (e.g., hot tub, dedicated workspace, EV charger) in your listing description and photos.
- Regularly check competitor amenities in Telford to stay competitive.
Telford Airbnb Guest Demographics & Profile Analysis (2025)
Guest Profile Summary for Telford
- The typical guest profile for Airbnb in Telford consists of primarily domestic travelers (87%), often arriving from nearby England, typically belonging to the Post-2000s (Gen Z/Alpha) group (50%), primarily speaking English or French.
- Domestic travelers account for 86.8% of guests.
- Key international markets include United Kingdom (86.8%) and United States (3.6%).
- Top languages spoken are English (69%) followed by French (7.1%).
- A significant demographic segment is the Post-2000s (Gen Z/Alpha) group, representing 50% of guests.
Recommendations for Hosts
- Target domestic marketing efforts towards travelers from England and Doncaster.
- Tailor amenities and listing descriptions to appeal to the dominant Post-2000s (Gen Z/Alpha) demographic (e.g., highlight fast WiFi, smart home features, local guides).
- Highlight unique local experiences or amenities relevant to the primary guest profile.
- Consider seasonal promotions aligned with peak travel times for key origin markets.
Nearby Short-Term Rental Market Comparison
How does the Telford Airbnb market stack up against its neighbors? Compare key performance metrics like average monthly revenue, ADR, and occupancy rates in surrounding areas to understand the broader regional STR landscape.
| Market | Active Properties | Monthly Revenue | Daily Rate | Avg. Occupancy |
|---|---|---|---|---|
| Englishcombe | 13 | $8,558 | $573.69 | 49% |
| Chew Magna | 14 | $6,649 | $399.59 | 46% |
| Lambourn | 11 | $6,081 | $669.47 | 28% |
| Long Sutton | 17 | $5,726 | $383.88 | 46% |
| Stoke St. Michael | 10 | $5,277 | $424.04 | 42% |
| Oldland Common | 13 | $5,093 | $355.47 | 43% |
| Crai | 20 | $4,799 | $371.85 | 46% |
| Dinton | 11 | $4,637 | $242.16 | 58% |
| Limpley Stoke | 10 | $4,598 | $523.47 | 52% |
| Flore | 10 | $4,534 | $347.03 | 40% |