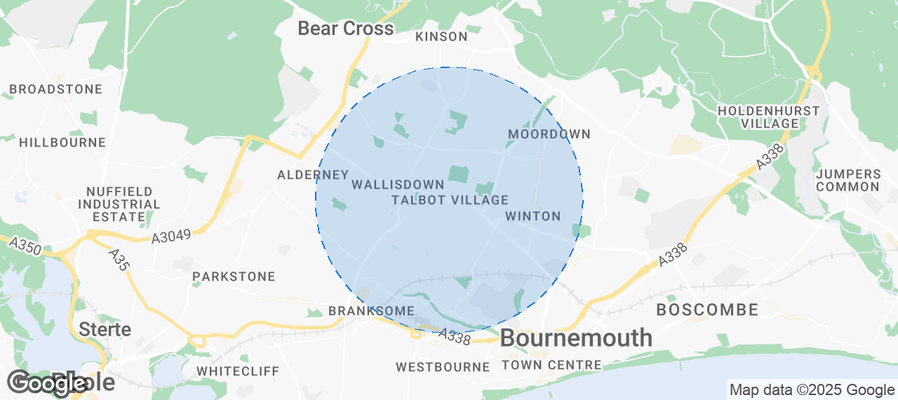
Talbot Village Airbnb Market Analysis 2025: Short Term Rental Data & Vacation Rental Statistics in England, United Kingdom
Is Airbnb profitable in Talbot Village in 2025? Explore comprehensive Airbnb analytics for Talbot Village, England, United Kingdom to uncover income potential. This 2025 STR market report for Talbot Village, based on AirROI data from April 2024 to March 2025, reveals key trends in the niche market of 41 active listings.
Whether you're considering an Airbnb investment in Talbot Village, optimizing your existing vacation rental, or exploring rental arbitrage opportunities, understanding the Talbot Village Airbnb data is crucial. Leveraging the low regulation environment is key to maximizing your short term rental income potential. Let's dive into the specifics.
Key Talbot Village Airbnb Performance Metrics Overview
Monthly Airbnb Revenue Variations & Income Potential in Talbot Village (2025)
Understanding the monthly revenue variations for Airbnb listings in Talbot Village is key to maximizing your short term rental income potential. Seasonality significantly impacts earnings. Our analysis, based on data from the past 12 months, shows that the peak revenue month for STRs in Talbot Village is typically August, while March often presents the lowest earnings, highlighting opportunities for strategic pricing adjustments during shoulder and low seasons. Explore the typical Airbnb income in Talbot Village across different performance tiers:
- Best-in-class properties (Top 10%) achieve $6,981+ monthly, often utilizing dynamic pricing and superior guest experiences.
- Strong performing properties (Top 25%) earn $2,724 or more, indicating effective management and desirable locations/amenities.
- Typical properties (Median) generate around $1,433 per month, representing the average market performance.
- Entry-level properties (Bottom 25%) see earnings around $712, often with potential for optimization.
Average Monthly Airbnb Earnings Trend in Talbot Village
Talbot Village Airbnb Occupancy Rate Trends (2025)
Maximize your bookings by understanding the Talbot Village STR occupancy trends. Seasonal demand shifts significantly influence how often properties are booked. Typically, Septembersees the highest demand (peak season occupancy), while March experiences the lowest (low season). Effective strategies, like adjusting minimum stays or offering promotions, can boost occupancy during slower periods. Here's how different property tiers perform in Talbot Village:
- Best-in-class properties (Top 10%) achieve 80%+ occupancy, indicating high desirability and potentially optimized availability.
- Strong performing properties (Top 25%) maintain 63% or higher occupancy, suggesting good market fit and guest satisfaction.
- Typical properties (Median) have an occupancy rate around 42%.
- Entry-level properties (Bottom 25%) average 22% occupancy, potentially facing higher vacancy.
Average Monthly Occupancy Rate Trend in Talbot Village
Average Daily Rate (ADR) Airbnb Trends in Talbot Village (2025)
Effective short term rental pricing strategy in Talbot Village involves understanding monthly ADR fluctuations. The Average Daily Rate (ADR) for Airbnb in Talbot Village typically peaks in August and dips lowest during February. Leveraging Airbnb dynamic pricing tools or strategies based on this seasonality can significantly boost revenue. Here's a look at the typical nightly rates achieved:
- Best-in-class properties (Top 10%) command rates of $371+ per night, often due to premium features or locations.
- Strong performing properties (Top 25%) achieve nightly rates of $196 or more.
- Typical properties (Median) charge around $105 per night.
- Entry-level properties (Bottom 25%) earn around $68 per night.
Average Daily Rate (ADR) Trend by Month in Talbot Village
Get Live Talbot Village Market Intelligence 👇
Explore Real-time Analytics
Airbnb Seasonality Analysis & Trends in Talbot Village (2025)
Peak Season (August, July, June)
- Revenue averages $3,630 per month
- Occupancy rates average 53.2%
- Daily rates average $187
Shoulder Season
- Revenue averages $2,774 per month
- Occupancy maintains around 46.0%
- Daily rates hold near $169
Low Season (January, February, March)
- Revenue drops to average $1,704 per month
- Occupancy decreases to average 32.4%
- Daily rates adjust to average $139
Seasonality Insights for Talbot Village
- The Airbnb seasonality in Talbot Village shows highly seasonal trends requiring careful strategy. While the sections above show seasonal averages, it's also insightful to look at the extremes:
- During the high season, the absolute peak month showcases Talbot Village's highest earning potential, with monthly revenues capable of climbing to $3,767, occupancy reaching a high of 59.8%, and ADRs peaking at $191.
- Conversely, the slowest single month of the year, typically falling within the low season, marks the market's lowest point. In this month, revenue might dip to $1,629, occupancy could drop to 29.2%, and ADRs may adjust down to $136.
- Understanding both the seasonal averages and these monthly peaks and troughs in revenue, occupancy, and ADR is crucial for maximizing your Airbnb profit potential in Talbot Village.
Seasonal Strategies for Maximizing Profit
- Peak Season: Maximize revenue through premium pricing and potentially longer minimum stays. Ensure high availability.
- Low Season: Offer competitive pricing, special promotions (e.g., extended stay discounts), and flexible cancellation policies. Target off-season travelers like remote workers or budget-conscious guests.
- Shoulder Seasons: Implement dynamic pricing that balances peak and low rates. Target weekend travelers or specific events. Offer slightly more flexible terms than peak season.
- Regularly analyze your own performance against these Talbot Village seasonality benchmarks and adjust your pricing and availability strategy accordingly.
Best Areas for Airbnb Investment in Talbot Village (2025)
Exploring the top neighborhoods for short-term rentals in Talbot Village? This section highlights key areas, outlining why they are attractive for hosts and guests, along with notable local attractions. Consider these locations based on your target guest profile and investment strategy.
| Neighborhood / Area | Why Host Here? (Target Guests & Appeal) | Key Attractions & Landmarks |
|---|---|---|
| Dorset Heritage Coast | A stunning stretch of natural beauty, perfect for outdoor activities and attracting tourists looking for scenic views and hiking opportunities. | Durdle Door, Lulworth Cove, Corfe Castle, Swanage Beach, The South West Coast Path, Purbeck Hills |
| Weymouth | A traditional seaside resort known for its beautiful beach and vibrant harbor. Ideal for families and tourists seeking a fun beach getaway. | Weymouth Beach, Nothe Fort, Weymouth Harbour, Sea Life Adventure Park, Sandworld Sculpture Park, Chesil Beach |
| Sherborne | A charming historic town with beautiful architecture and rich history. Appeals to visitors interested in culture, history, and quaint local shops. | Sherborne Abbey, Sherborne Castle, The White Horse, Sherborne Old Castle, Local art galleries, Historical walking tours |
| Lulworth | Famous for its unique geological formations and close proximity to the Jurassic Coast, an UNESCO World Heritage Site. Great for nature lovers and geology enthusiasts. | Lulworth Castle, Lulworth Cove, Durdle Door, The Jurassic Coast, Walking trails, Wildlife watching |
| Blandford Forum | A beautiful market town with Georgian architecture and a lively market scene. Attracts visitors interested in shopping and local history. | The Blandford Forum Market, St. Peter and St. Paul Church, The Blandford Fashion Museum, River Stour, Local parks, Historical tours |
| Shaftesbury | A picturesque town known for its steep, cobbled streets and charming cottages, famous for its dramatic views of the Blackmore Vale. | Gold Hill, Shaftesbury Abbey, St. Peter's Church, The Shaftesbury Arts Centre, Local artisan shops, Food and craft festivals |
| Poole | A bustling seaside town with a large natural harbor, popular for its beaches and water sports. Ideal for families and adventure seekers. | Poole Harbour, Sandbanks Beach, Brownsea Island, Poole Park, Water sports activities, Shopping and dining |
| Corfe Castle | Home to the iconic ruins of Corfe Castle, this village attracts history enthusiasts and offers stunning views over the Purbeck Hills. | Corfe Castle, The Purbeck Railway, Local history museum, Walking trails, Countryside pubs, Village shops |
Understanding Airbnb License Requirements & STR Laws in Talbot Village (2025)
While Talbot Village, England, United Kingdom currently shows low STR regulations, specific Airbnb license requirements might still exist or change. Always verify the latest short term rental regulations and Airbnb license requirements directly with local government authorities for Talbot Village to ensure full compliance before hosting.
(Source: AirROI data, 2025, finding no licensed listings among those analyzed)
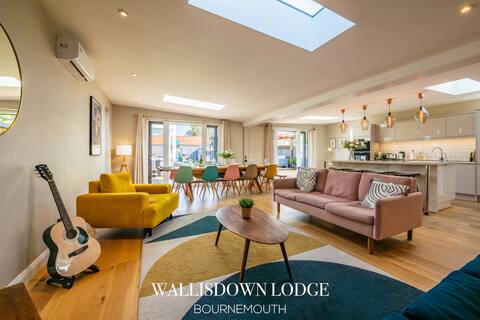
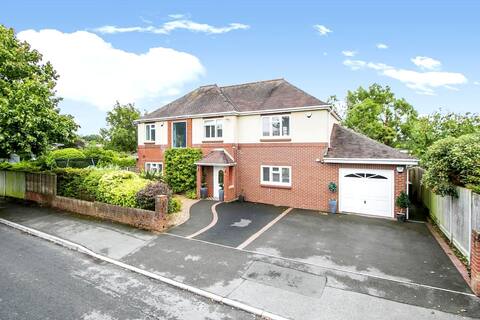
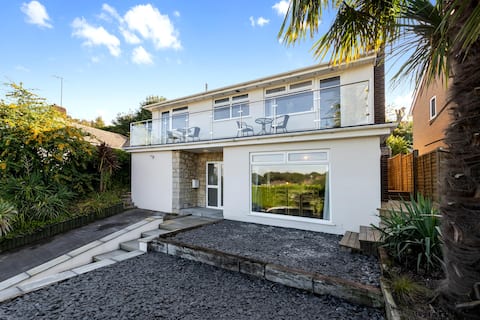
Top Performing Airbnb Properties in Talbot Village (2025)
Benchmark your potential! Explore examples of top-performing Airbnb properties in Talbot Villagebased on Trailing Twelve Month (TTM) revenue. Analyze their characteristics, revenue, occupancy rate, and ADR to understand what drives success in this market.
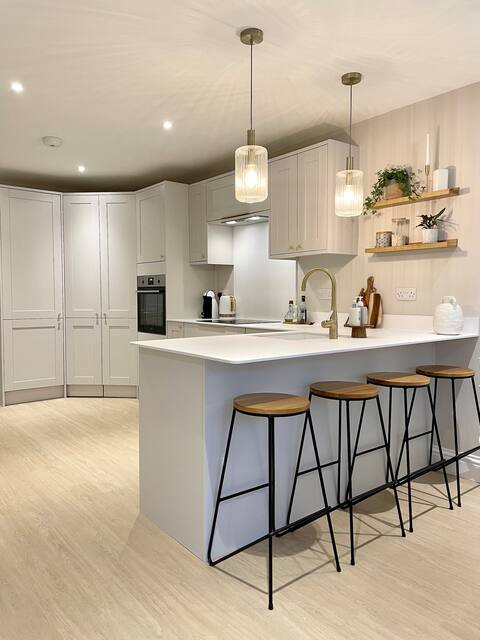
Hot tub, games room & cinema in Bournemouth
Entire Place • 7 bedrooms
modern 5 bedroom house with woodburner
Entire Place • 5 bedrooms
5 Bedroom Detached Beach House Poole Bournemouth
Entire Place • 5 bedrooms
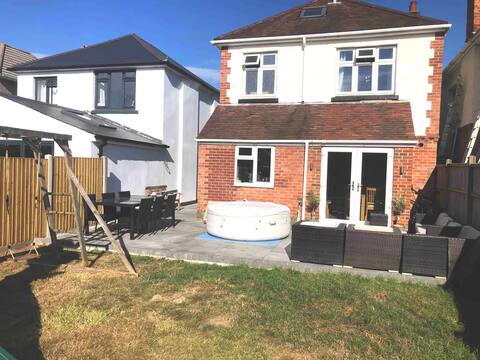
Modern, central bungalow with Large Garden
Entire Place • 3 bedrooms
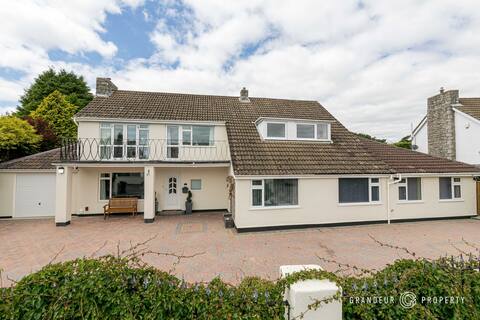
Talbot House by Grandeur Property
Entire Place • 5 bedrooms
Family Home Nr beach and town centre
Entire Place • 4 bedrooms
Note: Performance varies based on location, size, amenities, seasonality, and management quality. Data reflects the past 12 months.
Top Performing Airbnb Hosts in Talbot Village (2025)
Learn from the best! This table showcases top-performing Airbnb hosts in Talbot Village based on the number of properties managed and estimated total revenue over the past year. Analyze their scale and performance metrics.
| Host Name | Properties | Grossing Revenue | Stay Reviews | Avg Rating |
|---|---|---|---|---|
| Catherine | 1 | $234,338 | 140 | 4.96/5.0 |
| Adam | 1 | $100,121 | 15 | 4.60/5.0 |
| Craig | 1 | $81,179 | 46 | 4.83/5.0 |
| Lydia | 1 | $80,056 | 137 | 4.92/5.0 |
| Grandeur Property | 1 | $70,522 | 42 | 4.55/5.0 |
| David | 1 | $48,905 | 39 | 4.67/5.0 |
| Matthew | 2 | $44,207 | 63 | 4.79/5.0 |
| Angela | 1 | $30,683 | 31 | 4.87/5.0 |
| Paul And Caroline | 1 | $24,891 | 98 | 4.99/5.0 |
| Rachael | 1 | $23,024 | 229 | 4.81/5.0 |
Analyzing the strategies of top hosts, such as their property selection, pricing, and guest communication, can offer valuable lessons for optimizing your own Airbnb operations in Talbot Village.
Dive Deeper: Advanced Talbot Village STR Market Data (2025)
Ready to unlock more insights? AirROI provides access to advanced metrics and comprehensive Airbnb data for Talbot Village. Explore detailed analytics beyond this report to refine your investment strategy, optimize pricing, and maximize your vacation rental profits.
Explore Advanced MetricsTalbot Village Short-Term Rental Market Composition (2025): Property & Room Types
Room Type Distribution
Property Type Distribution
Market Composition Insights for Talbot Village
- The Talbot Village Airbnb market composition is heavily skewed towards Entire Home/Apt listings, which make up 63.4% of the 41 active rentals. This indicates strong guest preference for privacy and space.
- However, a notable 36.6% share for Private Rooms suggests opportunities for budget-conscious travelers or hosts renting out spare rooms.
- Looking at the property type distribution in Talbot Village, House properties are the most common (51.2%), reflecting the local real estate landscape.
- Houses represent a significant 51.2% portion, catering likely to families or larger groups.
- The presence of 12.2% Hotel/Boutique listings indicates integration with traditional hospitality.
- Smaller segments like outdoor/unique, unique stays, others (combined 7.2%) offer potential for unique stay experiences.
Talbot Village Airbnb Room Capacity Analysis (2025): Bedroom Distribution
Distribution of Listings by Number of Bedrooms
Room Capacity Insights for Talbot Village
- The dominant room capacity in Talbot Village is 1 bedroom listings, making up 31.7% of the market. This suggests a strong demand for properties suitable for couples or solo travelers.
- Together, 1 bedroom and 2 bedrooms properties represent 43.9% of the active Airbnb listings in Talbot Village, indicating a high concentration in these sizes.
- A significant 26.9% of listings offer 3+ bedrooms, catering to larger groups and families seeking more space in Talbot Village.
Talbot Village Vacation Rental Guest Capacity Trends (2025)
Distribution of Listings by Guest Capacity
Guest Capacity Insights for Talbot Village
- The most common guest capacity trend in Talbot Village vacation rentals is listings accommodating 2 guests (26.8%). This suggests the primary traveler segment is likely couples or solo travelers.
- Properties designed for 2 guests and 4 guests dominate the Talbot Village STR market, accounting for 43.9% of listings.
- 21.9% of properties accommodate 6+ guests, serving the market segment for larger families or group travel in Talbot Village.
- On average, properties in Talbot Village are equipped to host 3.0 guests.
Talbot Village Airbnb Booking Patterns (2025): Available vs. Booked Days
Available Days Distribution
Booked Days Distribution
Booking Pattern Insights for Talbot Village
- The most common availability pattern in Talbot Village falls within the 181-270 days range, representing 39% of listings. This suggests many properties have significant open periods on their calendars.
- Approximately 70.7% of listings show high availability (181+ days open annually), indicating potential for increased bookings or specific owner usage patterns.
- For booked days, the 91-180 days range is most frequent in Talbot Village (39%), reflecting common guest stay durations or potential owner blocking patterns.
- A notable 29.3% of properties secure long booking periods (181+ days booked per year), highlighting successful long-term rental strategies or significant owner usage.
Talbot Village Airbnb Minimum Stay Requirements Analysis
Distribution of Listings by Minimum Night Requirement
1 Night
14 listings
35.9% of total
2 Nights
13 listings
33.3% of total
3 Nights
4 listings
10.3% of total
4-6 Nights
2 listings
5.1% of total
7-29 Nights
1 listings
2.6% of total
30+ Nights
5 listings
12.8% of total
Key Insights
- The most prevalent minimum stay requirement in Talbot Village is 1 Night, adopted by 35.9% of listings. This highlights the market's preference for shorter, flexible bookings.
- A strong majority (69.2%) of the Talbot Village Airbnb data shows acceptance of very short stays (1-2 nights), indicating a dynamic, high-turnover market.
- A significant segment (12.8%) caters to monthly stays (30+ nights) in Talbot Village, pointing to opportunities in the extended-stay market.
Recommendations
- Align with the market by considering a 1 Night minimum stay, as 35.9% of Talbot Village hosts use this setting.
- Explore offering discounts for stays of 30+ nights to attract the 12.8% of the market seeking extended stays.
- Adjust minimum nights based on seasonality – potentially shorter during low season and longer during peak demand periods in Talbot Village.
Talbot Village Airbnb Cancellation Policy Trends Analysis (2025)
Flexible
7 listings
20% of total
Moderate
9 listings
25.7% of total
Firm
6 listings
17.1% of total
Strict
13 listings
37.1% of total
Cancellation Policy Insights for Talbot Village
- The prevailing Airbnb cancellation policy trend in Talbot Village is Strict, used by 37.1% of listings.
- A majority (54.2%) of hosts in Talbot Village utilize Firm or Strict policies, indicating a market where hosts prioritize booking security.
Recommendations for Hosts
- Consider adopting a Strict policy to align with the 37.1% market standard in Talbot Village.
- With 37.1% using Strict terms, this is a viable option in Talbot Village, particularly for high-value properties or during peak demand periods.
- Regularly review your cancellation policy against competitors and market demand shifts in Talbot Village.
Talbot Village STR Booking Lead Time Analysis (2025)
Average Booking Lead Time by Month
Booking Lead Time Insights for Talbot Village
- The overall average booking lead time for vacation rentals in Talbot Village is 50 days.
- Guests book furthest in advance for stays during June (average 65 days), likely coinciding with peak travel demand or local events.
- The shortest booking windows occur for stays in February (average 36 days), indicating more last-minute travel plans during this time.
- Seasonally, Summer (60 days avg.) sees the longest lead times, while Winter (48 days avg.) has the shortest, reflecting typical travel planning cycles.
Recommendations for Hosts
- Use the overall average lead time (50 days) as a baseline for your pricing and availability strategy in Talbot Village.
- For June stays, consider implementing length-of-stay discounts or slightly higher rates for bookings made less than 65 days out to capitalize on advance planning.
- Target marketing efforts for the Summer season well in advance (at least 60 days) to capture early planners.
- Monitor your own booking lead times against these Talbot Village averages to identify opportunities for dynamic pricing adjustments.
Popular & Essential Airbnb Amenities in Talbot Village (2025)
Amenity Prevalence
Amenity Insights for Talbot Village
- Essential amenities in Talbot Village that guests expect include: Wifi, Smoke alarm. Lacking these (any) could significantly impact bookings.
- Popular amenities like Heating, TV, Hot water are common but not universal. Offering these can provide a competitive edge.
Recommendations for Hosts
- Ensure your listing includes all essential amenities for Talbot Village: Wifi, Smoke alarm.
- Prioritize adding missing essentials: Smoke alarm.
- Consider adding popular differentiators like Heating or TV to increase appeal.
- Highlight unique or less common amenities you offer (e.g., hot tub, dedicated workspace, EV charger) in your listing description and photos.
- Regularly check competitor amenities in Talbot Village to stay competitive.
Talbot Village Airbnb Guest Demographics & Profile Analysis (2025)
Guest Profile Summary for Talbot Village
- The typical guest profile for Airbnb in Talbot Village consists of primarily domestic travelers (88%), often arriving from nearby England, typically belonging to the Post-2000s (Gen Z/Alpha) group (50%), primarily speaking English or Spanish.
- Domestic travelers account for 88.2% of guests.
- Key international markets include United Kingdom (88.2%) and United States (2.5%).
- Top languages spoken are English (68.5%) followed by Spanish (5.9%).
- A significant demographic segment is the Post-2000s (Gen Z/Alpha) group, representing 50% of guests.
Recommendations for Hosts
- Target domestic marketing efforts towards travelers from England and London.
- Tailor amenities and listing descriptions to appeal to the dominant Post-2000s (Gen Z/Alpha) demographic (e.g., highlight fast WiFi, smart home features, local guides).
- Highlight unique local experiences or amenities relevant to the primary guest profile.
- Consider seasonal promotions aligned with peak travel times for key origin markets.
Nearby Short-Term Rental Market Comparison
How does the Talbot Village Airbnb market stack up against its neighbors? Compare key performance metrics like average monthly revenue, ADR, and occupancy rates in surrounding areas to understand the broader regional STR landscape.
| Market | Active Properties | Monthly Revenue | Daily Rate | Avg. Occupancy |
|---|---|---|---|---|
| Englishcombe | 13 | $8,558 | $573.69 | 49% |
| Dorney | 12 | $8,335 | $622.48 | 45% |
| Chew Magna | 14 | $6,649 | $399.59 | 46% |
| Lambourn | 11 | $6,081 | $669.47 | 28% |
| City of Westminster | 1,327 | $6,043 | $486.66 | 52% |
| Long Sutton | 17 | $5,726 | $383.88 | 46% |
| Stoke St. Michael | 10 | $5,277 | $424.04 | 42% |
| Winsham | 10 | $5,154 | $484.22 | 52% |
| Oldland Common | 13 | $5,093 | $355.47 | 43% |
| Wraysbury | 14 | $4,719 | $396.18 | 46% |