St Leonards Airbnb Market Analysis 2025: Short Term Rental Data & Vacation Rental Statistics in England, United Kingdom
Is Airbnb profitable in St Leonards in 2025? Explore comprehensive Airbnb analytics for St Leonards, England, United Kingdom to uncover income potential. This 2025 STR market report for St Leonards, based on AirROI data from April 2024 to March 2025, reveals key trends in the niche market of 17 active listings.
Whether you're considering an Airbnb investment in St Leonards, optimizing your existing vacation rental, or exploring rental arbitrage opportunities, understanding the St Leonards Airbnb data is crucial. Leveraging the low regulation environment is key to maximizing your short term rental income potential. Let's dive into the specifics.
Key St Leonards Airbnb Performance Metrics Overview
Monthly Airbnb Revenue Variations & Income Potential in St Leonards (2025)
Understanding the monthly revenue variations for Airbnb listings in St Leonards is key to maximizing your short term rental income potential. Seasonality significantly impacts earnings. Our analysis, based on data from the past 12 months, shows that the peak revenue month for STRs in St Leonards is typically August, while April often presents the lowest earnings, highlighting opportunities for strategic pricing adjustments during shoulder and low seasons. Explore the typical Airbnb income in St Leonards across different performance tiers:
- Best-in-class properties (Top 10%) achieve $5,337+ monthly, often utilizing dynamic pricing and superior guest experiences.
- Strong performing properties (Top 25%) earn $3,261 or more, indicating effective management and desirable locations/amenities.
- Typical properties (Median) generate around $2,180 per month, representing the average market performance.
- Entry-level properties (Bottom 25%) see earnings around $985, often with potential for optimization.
Average Monthly Airbnb Earnings Trend in St Leonards
St Leonards Airbnb Occupancy Rate Trends (2025)
Maximize your bookings by understanding the St Leonards STR occupancy trends. Seasonal demand shifts significantly influence how often properties are booked. Typically, Augustsees the highest demand (peak season occupancy), while April experiences the lowest (low season). Effective strategies, like adjusting minimum stays or offering promotions, can boost occupancy during slower periods. Here's how different property tiers perform in St Leonards:
- Best-in-class properties (Top 10%) achieve 76%+ occupancy, indicating high desirability and potentially optimized availability.
- Strong performing properties (Top 25%) maintain 56% or higher occupancy, suggesting good market fit and guest satisfaction.
- Typical properties (Median) have an occupancy rate around 31%.
- Entry-level properties (Bottom 25%) average 16% occupancy, potentially facing higher vacancy.
Average Monthly Occupancy Rate Trend in St Leonards
Average Daily Rate (ADR) Airbnb Trends in St Leonards (2025)
Effective short term rental pricing strategy in St Leonards involves understanding monthly ADR fluctuations. The Average Daily Rate (ADR) for Airbnb in St Leonards typically peaks in August and dips lowest during February. Leveraging Airbnb dynamic pricing tools or strategies based on this seasonality can significantly boost revenue. Here's a look at the typical nightly rates achieved:
- Best-in-class properties (Top 10%) command rates of $493+ per night, often due to premium features or locations.
- Strong performing properties (Top 25%) achieve nightly rates of $253 or more.
- Typical properties (Median) charge around $148 per night.
- Entry-level properties (Bottom 25%) earn around $113 per night.
Average Daily Rate (ADR) Trend by Month in St Leonards
Get Live St Leonards Market Intelligence 👇

Explore Real-time Analytics
Airbnb Seasonality Analysis & Trends in St Leonards (2025)
Peak Season (August, May, June)
- Revenue averages $3,589 per month
- Occupancy rates average 46.3%
- Daily rates average $251
Shoulder Season
- Revenue averages $2,688 per month
- Occupancy maintains around 40.9%
- Daily rates hold near $219
Low Season (February, March, April)
- Revenue drops to average $1,632 per month
- Occupancy decreases to average 28.3%
- Daily rates adjust to average $198
Seasonality Insights for St Leonards
- The Airbnb seasonality in St Leonards shows highly seasonal trends requiring careful strategy. While the sections above show seasonal averages, it's also insightful to look at the extremes:
- During the high season, the absolute peak month showcases St Leonards's highest earning potential, with monthly revenues capable of climbing to $3,706, occupancy reaching a high of 52.6%, and ADRs peaking at $262.
- Conversely, the slowest single month of the year, typically falling within the low season, marks the market's lowest point. In this month, revenue might dip to $1,374, occupancy could drop to 28.2%, and ADRs may adjust down to $177.
- Understanding both the seasonal averages and these monthly peaks and troughs in revenue, occupancy, and ADR is crucial for maximizing your Airbnb profit potential in St Leonards.
Seasonal Strategies for Maximizing Profit
- Peak Season: Maximize revenue through premium pricing and potentially longer minimum stays. Ensure high availability.
- Low Season: Offer competitive pricing, special promotions (e.g., extended stay discounts), and flexible cancellation policies. Target off-season travelers like remote workers or budget-conscious guests.
- Shoulder Seasons: Implement dynamic pricing that balances peak and low rates. Target weekend travelers or specific events. Offer slightly more flexible terms than peak season.
- Regularly analyze your own performance against these St Leonards seasonality benchmarks and adjust your pricing and availability strategy accordingly.
Best Areas for Airbnb Investment in St Leonards (2025)
Exploring the top neighborhoods for short-term rentals in St Leonards? This section highlights key areas, outlining why they are attractive for hosts and guests, along with notable local attractions. Consider these locations based on your target guest profile and investment strategy.
| Neighborhood / Area | Why Host Here? (Target Guests & Appeal) | Key Attractions & Landmarks |
|---|---|---|
| St Leonards seafront | A beautiful coastal area with beach access, perfect for guests seeking a relaxing seaside experience. It's a popular location for tourists and families looking for a vacation by the sea. | Hastings Pier, St Leonards Gardens, Easts Beach, De La Warr Pavilion, St Leonards On Sea Beach |
| West St Leonards | This area is known for its peaceful residential atmosphere and proximity to local amenities. It appeals to visitors looking for a quieter stay while still being close to the action. | Kennedy Gardens, Bexhill-on-Sea, Harbour Arm, Bexhill Museum, Local eateries and cafes |
| Central St Leonards | The heart of St Leonards, featuring a mix of vintage shops, cafes, and pubs. Ideal for those wanting to experience local culture and daily life. | Norman Road arts and antiques area, The Pavilion, Café culture, Local events and markets, Community art projects |
| St Leonards shopping district | A hub for shoppers and tourists alike, with various local shops, boutiques, and restaurants. Attracts visitors looking for shopping experiences. | Local boutiques, Coffee shops, Farmers' market, Unique gift shops, St Leonards Shopping Centre |
| Hastings Old Town | Just a short distance from St Leonards, this historic area offers a glimpse into local history with charming streets, historic buildings, and a vibrant atmosphere. | Hastings Castle, Fisherman's Museum, Old Town shops, St. Clements Caves, Hastings History House |
| Hastings Pier | An iconic attraction for both locals and visitors, the pier is a social hotspot with stunning views and entertainment options, making it ideal for Airbnb hosting. | Amusement arcade, Restaurants and cafés, Events and festivals, Stunning views of the coastline, Sunset watching |
| The Priory Meadow Shopping Centre | A modern shopping complex with a mix of retailers, dining options, and entertainment, drawing in visitors looking for a complete shopping experience. | Shopping outlets, Cinema, Restaurants, Café culture, Seasonal events |
| Bexhill-on-Sea | Close proximity to St Leonards with its own beach and parks, Bexhill offers a tranquil alternative for guests looking to explore the wider area. | Bexhill Beach, De La Warr Pavilion, Egerton Park, Bexhill's Art Deco architecture, Local dining experiences |
Understanding Airbnb License Requirements & STR Laws in St Leonards (2025)
While St Leonards, England, United Kingdom currently shows low STR regulations, specific Airbnb license requirements might still exist or change. Always verify the latest short term rental regulations and Airbnb license requirements directly with local government authorities for St Leonards to ensure full compliance before hosting.
(Source: AirROI data, 2025, finding no licensed listings among those analyzed)
Top Performing Airbnb Properties in St Leonards (2025)
Benchmark your potential! Explore examples of top-performing Airbnb properties in St Leonardsbased on Trailing Twelve Month (TTM) revenue. Analyze their characteristics, revenue, occupancy rate, and ADR to understand what drives success in this market.
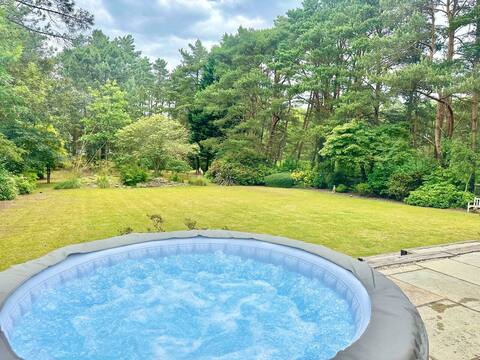
Hot Tub Hideaway: Forest & Coast (10 Guests)
Entire Place • 5 bedrooms
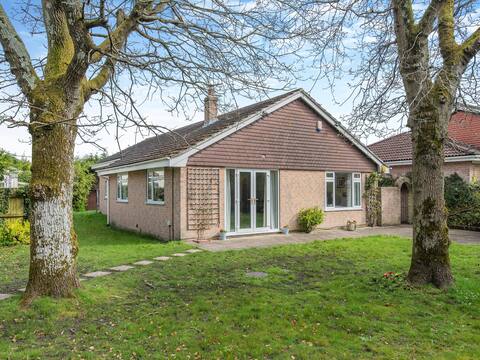
Little Hill Farm Villa
Entire Place • 4 bedrooms
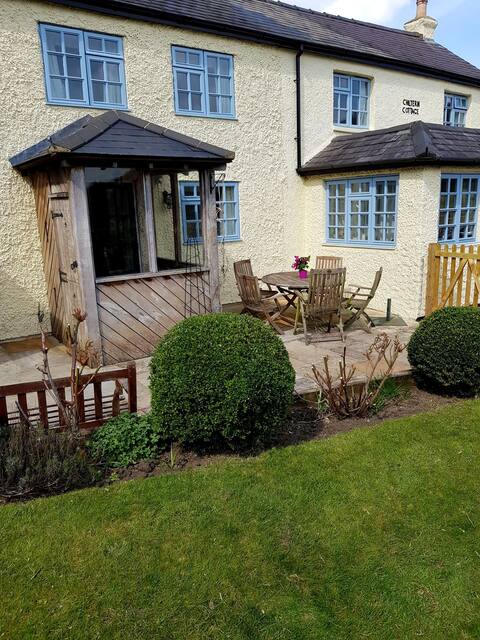
Idyllic annex on top of the chiltern hills
Entire Place • 2 bedrooms
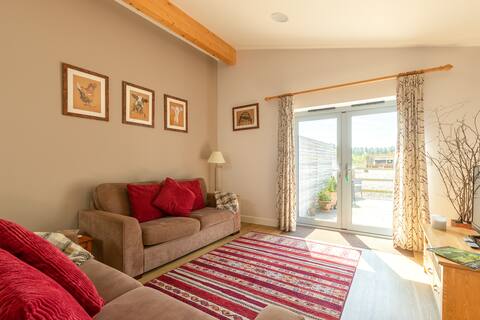
Sid’s Place
Entire Place • 1 bedroom
Modern & Spacious Villa with Garden in New Forest
Entire Place • 4 bedrooms
A charming cottage set in a rural location
Entire Place • 1 bedroom
Note: Performance varies based on location, size, amenities, seasonality, and management quality. Data reflects the past 12 months.
Top Performing Airbnb Hosts in St Leonards (2025)
Learn from the best! This table showcases top-performing Airbnb hosts in St Leonards based on the number of properties managed and estimated total revenue over the past year. Analyze their scale and performance metrics.
| Host Name | Properties | Grossing Revenue | Stay Reviews | Avg Rating |
|---|---|---|---|---|
| Gill | 1 | $104,495 | 18 | 4.89/5.0 |
| James | 5 | $101,055 | 315 | 4.80/5.0 |
| Cottages | 2 | $57,228 | 37 | 2.50/5.0 |
| Gail | 1 | $35,292 | 115 | 4.85/5.0 |
| Sharon | 1 | $34,032 | 102 | 4.99/5.0 |
| Martin | 1 | $29,480 | 3 | 5.00/5.0 |
| Paul | 1 | $25,163 | 33 | 4.88/5.0 |
| Grandeur Property | 1 | $17,456 | 8 | 4.75/5.0 |
| Alison | 1 | $10,312 | 202 | 4.93/5.0 |
| Matt | 1 | $2,807 | 19 | 4.89/5.0 |
Analyzing the strategies of top hosts, such as their property selection, pricing, and guest communication, can offer valuable lessons for optimizing your own Airbnb operations in St Leonards.
Dive Deeper: Advanced St Leonards STR Market Data (2025)
Ready to unlock more insights? AirROI provides access to advanced metrics and comprehensive Airbnb data for St Leonards. Explore detailed analytics beyond this report to refine your investment strategy, optimize pricing, and maximize your vacation rental profits.
Explore Advanced MetricsSt Leonards Short-Term Rental Market Composition (2025): Property & Room Types
Room Type Distribution
Property Type Distribution
Market Composition Insights for St Leonards
- The St Leonards Airbnb market composition is heavily skewed towards Entire Home/Apt listings, which make up 94.1% of the 17 active rentals. This indicates strong guest preference for privacy and space.
- Looking at the property type distribution in St Leonards, House properties are the most common (64.7%), reflecting the local real estate landscape.
- Houses represent a significant 64.7% portion, catering likely to families or larger groups.
St Leonards Airbnb Room Capacity Analysis (2025): Bedroom Distribution
Distribution of Listings by Number of Bedrooms
Room Capacity Insights for St Leonards
- The dominant room capacity in St Leonards is 1 bedroom listings, making up 47.1% of the market. This suggests a strong demand for properties suitable for couples or solo travelers.
- Together, 1 bedroom and 2 bedrooms properties represent 76.5% of the active Airbnb listings in St Leonards, indicating a high concentration in these sizes.
St Leonards Vacation Rental Guest Capacity Trends (2025)
Distribution of Listings by Guest Capacity
Guest Capacity Insights for St Leonards
- The most common guest capacity trend in St Leonards vacation rentals is listings accommodating 3 guests (29.4%). This suggests the primary traveler segment is likely small families or groups.
- Properties designed for 3 guests and 2 guests dominate the St Leonards STR market, accounting for 47.0% of listings.
- 17.6% of properties accommodate 6+ guests, serving the market segment for larger families or group travel in St Leonards.
- On average, properties in St Leonards are equipped to host 3.9 guests.
St Leonards Airbnb Booking Patterns (2025): Available vs. Booked Days
Available Days Distribution
Booked Days Distribution
Booking Pattern Insights for St Leonards
- The most common availability pattern in St Leonards falls within the 271-366 days range, representing 41.2% of listings. This suggests many properties have significant open periods on their calendars.
- Approximately 82.4% of listings show high availability (181+ days open annually), indicating potential for increased bookings or specific owner usage patterns.
- For booked days, the 91-180 days range is most frequent in St Leonards (41.2%), reflecting common guest stay durations or potential owner blocking patterns.
- A notable 17.7% of properties secure long booking periods (181+ days booked per year), highlighting successful long-term rental strategies or significant owner usage.
St Leonards Airbnb Minimum Stay Requirements Analysis
Distribution of Listings by Minimum Night Requirement
1 Night
4 listings
23.5% of total
2 Nights
4 listings
23.5% of total
3 Nights
7 listings
41.2% of total
7-29 Nights
1 listings
5.9% of total
30+ Nights
1 listings
5.9% of total
Key Insights
- The most prevalent minimum stay requirement in St Leonards is 3 Nights, adopted by 41.2% of listings. This highlights the market's preference for longer commitments.
Recommendations
- Align with the market by considering a 3 Nights minimum stay, as 41.2% of St Leonards hosts use this setting.
- If feasible, allowing 1-night stays, especially midweek or during low season, could capture last-minute bookings, as only 23.5% currently do.
- Explore offering discounts for stays of 30+ nights to attract the 5.9% of the market seeking extended stays.
- Adjust minimum nights based on seasonality – potentially shorter during low season and longer during peak demand periods in St Leonards.
St Leonards Airbnb Cancellation Policy Trends Analysis (2025)
Super Strict 30 Days
5 listings
33.3% of total
Super Strict 60 Days
1 listings
6.7% of total
Flexible
4 listings
26.7% of total
Moderate
4 listings
26.7% of total
Strict
1 listings
6.7% of total
Cancellation Policy Insights for St Leonards
- The prevailing Airbnb cancellation policy trend in St Leonards is Super Strict 30 Days, used by 33.3% of listings.
- There's a relatively balanced mix between guest-friendly (53.4%) and stricter (6.7%) policies, offering choices for different guest needs.
- Strict cancellation policies are quite rare (6.7%), potentially making listings with this policy less competitive unless justified by high demand or property type.
Recommendations for Hosts
- Consider adopting a Super Strict 30 Days policy to align with the 33.3% market standard in St Leonards.
- Using a Strict policy might deter some guests, as only 6.7% of listings use it. Evaluate if potential revenue protection outweighs possible lower booking rates.
- Regularly review your cancellation policy against competitors and market demand shifts in St Leonards.
St Leonards STR Booking Lead Time Analysis (2025)
Average Booking Lead Time by Month
Booking Lead Time Insights for St Leonards
- The overall average booking lead time for vacation rentals in St Leonards is 29 days.
- Guests book furthest in advance for stays during October (average 80 days), likely coinciding with peak travel demand or local events.
- The shortest booking windows occur for stays in January (average 26 days), indicating more last-minute travel plans during this time.
- Seasonally, Summer (70 days avg.) sees the longest lead times, while Winter (37 days avg.) has the shortest, reflecting typical travel planning cycles.
Recommendations for Hosts
- Use the overall average lead time (29 days) as a baseline for your pricing and availability strategy in St Leonards.
- For October stays, consider implementing length-of-stay discounts or slightly higher rates for bookings made less than 80 days out to capitalize on advance planning.
- Target marketing efforts for the Summer season well in advance (at least 70 days) to capture early planners.
- Monitor your own booking lead times against these St Leonards averages to identify opportunities for dynamic pricing adjustments.
Popular & Essential Airbnb Amenities in St Leonards (2025)
Amenity Prevalence
Amenity Insights for St Leonards
- Essential amenities in St Leonards that guests expect include: Heating, TV, Wifi, Smoke alarm. Lacking these (any) could significantly impact bookings.
- Popular amenities like Free parking on premises, Bed linens, Hot water are common but not universal. Offering these can provide a competitive edge.
Recommendations for Hosts
- Ensure your listing includes all essential amenities for St Leonards: Heating, TV, Wifi, Smoke alarm.
- Consider adding popular differentiators like Free parking on premises or Bed linens to increase appeal.
- Highlight unique or less common amenities you offer (e.g., hot tub, dedicated workspace, EV charger) in your listing description and photos.
- Regularly check competitor amenities in St Leonards to stay competitive.
St Leonards Airbnb Guest Demographics & Profile Analysis (2025)
Guest Profile Summary for St Leonards
- The typical guest profile for Airbnb in St Leonards consists of primarily domestic travelers (91%), often arriving from nearby England, typically belonging to the Post-2000s (Gen Z/Alpha) group (50%), primarily speaking English or Spanish.
- Domestic travelers account for 90.6% of guests.
- Key international markets include United Kingdom (90.6%) and Ireland (2%).
- Top languages spoken are English (70.7%) followed by Spanish (6.7%).
- A significant demographic segment is the Post-2000s (Gen Z/Alpha) group, representing 50% of guests.
Recommendations for Hosts
- Target domestic marketing efforts towards travelers from England and London.
- Tailor amenities and listing descriptions to appeal to the dominant Post-2000s (Gen Z/Alpha) demographic (e.g., highlight fast WiFi, smart home features, local guides).
- Highlight unique local experiences or amenities relevant to the primary guest profile.
- Consider seasonal promotions aligned with peak travel times for key origin markets.
Nearby Short-Term Rental Market Comparison
How does the St Leonards Airbnb market stack up against its neighbors? Compare key performance metrics like average monthly revenue, ADR, and occupancy rates in surrounding areas to understand the broader regional STR landscape.
| Market | Active Properties | Monthly Revenue | Daily Rate | Avg. Occupancy |
|---|---|---|---|---|
| Englishcombe | 13 | $8,558 | $573.69 | 49% |
| Dorney | 12 | $8,335 | $622.48 | 45% |
| Chew Magna | 14 | $6,649 | $399.59 | 46% |
| Lambourn | 11 | $6,081 | $669.47 | 28% |
| City of Westminster | 1,327 | $6,043 | $486.66 | 52% |
| Long Sutton | 17 | $5,726 | $383.88 | 46% |
| Stoke St. Michael | 10 | $5,277 | $424.04 | 42% |
| Winsham | 10 | $5,154 | $484.22 | 52% |
| Oldland Common | 13 | $5,093 | $355.47 | 43% |
| Wraysbury | 14 | $4,719 | $396.18 | 46% |