Southburn Airbnb Market Analysis 2025: Short Term Rental Data & Vacation Rental Statistics in England, United Kingdom
Is Airbnb profitable in Southburn in 2025? Explore comprehensive Airbnb analytics for Southburn, England, United Kingdom to uncover income potential. This 2025 STR market report for Southburn, based on AirROI data from April 2024 to March 2025, reveals key trends in the niche market of 18 active listings.
Whether you're considering an Airbnb investment in Southburn, optimizing your existing vacation rental, or exploring rental arbitrage opportunities, understanding the Southburn Airbnb data is crucial. Leveraging the low regulation environment is key to maximizing your short term rental income potential. Let's dive into the specifics.
Key Southburn Airbnb Performance Metrics Overview
Monthly Airbnb Revenue Variations & Income Potential in Southburn (2025)
Understanding the monthly revenue variations for Airbnb listings in Southburn is key to maximizing your short term rental income potential. Seasonality significantly impacts earnings. Our analysis, based on data from the past 12 months, shows that the peak revenue month for STRs in Southburn is typically February, while March often presents the lowest earnings, highlighting opportunities for strategic pricing adjustments during shoulder and low seasons. Explore the typical Airbnb income in Southburn across different performance tiers:
- Best-in-class properties (Top 10%) achieve $23,648+ monthly, often utilizing dynamic pricing and superior guest experiences.
- Strong performing properties (Top 25%) earn $5,523 or more, indicating effective management and desirable locations/amenities.
- Typical properties (Median) generate around $4,545 per month, representing the average market performance.
- Entry-level properties (Bottom 25%) see earnings around $3,453, often with potential for optimization.
Average Monthly Airbnb Earnings Trend in Southburn
Southburn Airbnb Occupancy Rate Trends (2025)
Maximize your bookings by understanding the Southburn STR occupancy trends. Seasonal demand shifts significantly influence how often properties are booked. Typically, Augustsees the highest demand (peak season occupancy), while March experiences the lowest (low season). Effective strategies, like adjusting minimum stays or offering promotions, can boost occupancy during slower periods. Here's how different property tiers perform in Southburn:
- Best-in-class properties (Top 10%) achieve 86%+ occupancy, indicating high desirability and potentially optimized availability.
- Strong performing properties (Top 25%) maintain 80% or higher occupancy, suggesting good market fit and guest satisfaction.
- Typical properties (Median) have an occupancy rate around 70%.
- Entry-level properties (Bottom 25%) average 53% occupancy, potentially facing higher vacancy.
Average Monthly Occupancy Rate Trend in Southburn
Average Daily Rate (ADR) Airbnb Trends in Southburn (2025)
Effective short term rental pricing strategy in Southburn involves understanding monthly ADR fluctuations. The Average Daily Rate (ADR) for Airbnb in Southburn typically peaks in November and dips lowest during September. Leveraging Airbnb dynamic pricing tools or strategies based on this seasonality can significantly boost revenue. Here's a look at the typical nightly rates achieved:
- Best-in-class properties (Top 10%) command rates of $254+ per night, often due to premium features or locations.
- Strong performing properties (Top 25%) achieve nightly rates of $218 or more.
- Typical properties (Median) charge around $134 per night.
- Entry-level properties (Bottom 25%) earn around $132 per night.
Average Daily Rate (ADR) Trend by Month in Southburn
Get Live Southburn Market Intelligence 👇

Explore Real-time Analytics
Airbnb Seasonality Analysis & Trends in Southburn (2025)
Peak Season (February, April, August)
- Revenue averages $8,476 per month
- Occupancy rates average 83.6%
- Daily rates average $222
Shoulder Season
- Revenue averages $7,451 per month
- Occupancy maintains around 67.5%
- Daily rates hold near $224
Low Season (January, March, July)
- Revenue drops to average $5,065 per month
- Occupancy decreases to average 51.9%
- Daily rates adjust to average $230
Seasonality Insights for Southburn
- The Airbnb seasonality in Southburn shows highly seasonal trends requiring careful strategy. While the sections above show seasonal averages, it's also insightful to look at the extremes:
- During the high season, the absolute peak month showcases Southburn's highest earning potential, with monthly revenues capable of climbing to $8,485, occupancy reaching a high of 91.2%, and ADRs peaking at $238.
- Conversely, the slowest single month of the year, typically falling within the low season, marks the market's lowest point. In this month, revenue might dip to $3,233, occupancy could drop to 46.6%, and ADRs may adjust down to $213.
- Understanding both the seasonal averages and these monthly peaks and troughs in revenue, occupancy, and ADR is crucial for maximizing your Airbnb profit potential in Southburn.
Seasonal Strategies for Maximizing Profit
- Peak Season: Maximize revenue through premium pricing and potentially longer minimum stays. Ensure high availability.
- Low Season: Offer competitive pricing, special promotions (e.g., extended stay discounts), and flexible cancellation policies. Target off-season travelers like remote workers or budget-conscious guests.
- Shoulder Seasons: Implement dynamic pricing that balances peak and low rates. Target weekend travelers or specific events. Offer slightly more flexible terms than peak season.
- Regularly analyze your own performance against these Southburn seasonality benchmarks and adjust your pricing and availability strategy accordingly.
Best Areas for Airbnb Investment in Southburn (2025)
Exploring the top neighborhoods for short-term rentals in Southburn? This section highlights key areas, outlining why they are attractive for hosts and guests, along with notable local attractions. Consider these locations based on your target guest profile and investment strategy.
| Neighborhood / Area | Why Host Here? (Target Guests & Appeal) | Key Attractions & Landmarks |
|---|---|---|
| Southburn Village | Charming rural village with picturesque English countryside and easy access to local amenities. Ideal for guests seeking a peaceful retreat in a quaint village atmosphere. | Local pubs, St. Mary's Church, Walking trails, Countryside views, Nearby farmland |
| Scarborough | Popular coastal town known for its beaches, historic castle, and vibrant tourist scene. A great location for attracting holidaymakers during the summer season. | Scarborough Beach, Scarborough Castle, Peasholm Park, South Bay, Sea Life Scarborough |
| Filey | Quaint seaside resort with a family-friendly vibe and beautiful sandy beaches. Ideal for families and travelers looking for a relaxing beach holiday. | Filey Beach, Filey Brigg, Glen Gardens, Briggs Gardens, Coble Landing |
| Whitby | Historic fishing town famous for its abbey and Dracula connections. Attracts visitors interested in history, culture, and stunning coastal views. | Whitby Abbey, Whitby Harbour, Captain Cook Museum, Whitby Beach, Pannett Park |
| York | Historic city with stunning architecture, rich history, and vibrant cultural scene. Ideal for city visitors looking to explore local heritage and attractions. | York Minster, The Shambles, National Railway Museum, York Castle Museum, Clifford's Tower |
| Bridlington | Coastal town with lovely beaches and a vibrant promenade. Popular for tourists looking for outdoor leisure activities and family holidays. | Bridlington Spa, Treasure Island Mini Golf, Bridlington Beach, The Bayle Museum, Bridlington Harbour |
| Malton | Market town known for its food scene and local produce. Attracts food enthusiasts and those wanting a taste of local Yorkshire delicacies. | Malton Food Market, Malton Museum, Riverview Walk, Local restaurants and cafes, Nearby vineyards |
| Driffield | Market town in the Yorkshire Wolds, known for its local markets and surrounding rural landscape. Ideal for guests seeking a rural experience and charm. | Driffield Navigation, Driffield Showground, Local shops and markets, Nearby parks, Countryside walks |
Understanding Airbnb License Requirements & STR Laws in Southburn (2025)
While Southburn, England, United Kingdom currently shows low STR regulations, specific Airbnb license requirements might still exist or change. Always verify the latest short term rental regulations and Airbnb license requirements directly with local government authorities for Southburn to ensure full compliance before hosting.
(Source: AirROI data, 2025, finding no licensed listings among those analyzed)
Top Performing Airbnb Properties in Southburn (2025)
Benchmark your potential! Explore examples of top-performing Airbnb properties in Southburnbased on Trailing Twelve Month (TTM) revenue. Analyze their characteristics, revenue, occupancy rate, and ADR to understand what drives success in this market.
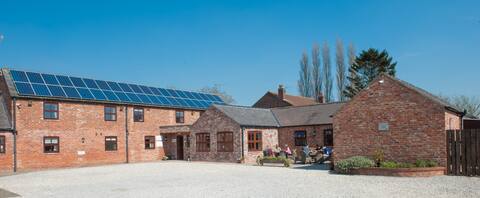
Wold Escapes Farmhouse
Entire Place • 9 bedrooms

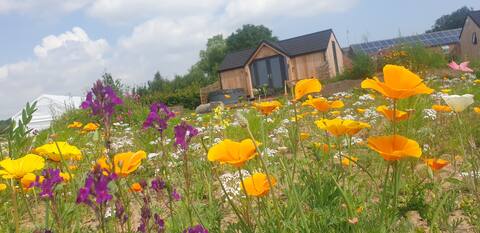
Jolly Cabin - Modern country retreat with hot tub
Entire Place • 1 bedroom
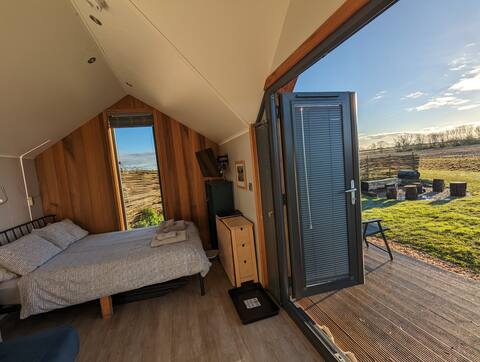
Goldie - Enjoy the sunset from your hot tub!
Entire Place • 1 bedroom
Crazy Mazy, Peace & Tranquillity in East Yorkshire
Entire Place • 1 bedroom
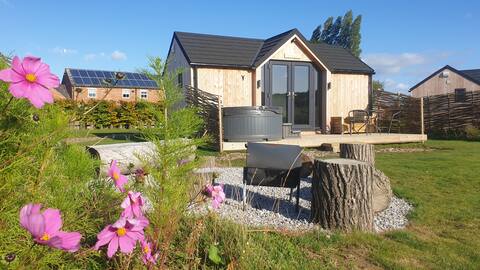
Zebedee - Stargaze from your hot tub!
Entire Place • 1 bedroom
Jiji - Watch the sunrise from your hot tub!
Entire Place • 1 bedroom
Note: Performance varies based on location, size, amenities, seasonality, and management quality. Data reflects the past 12 months.
Top Performing Airbnb Hosts in Southburn (2025)
Learn from the best! This table showcases top-performing Airbnb hosts in Southburn based on the number of properties managed and estimated total revenue over the past year. Analyze their scale and performance metrics.
| Host Name | Properties | Grossing Revenue | Stay Reviews | Avg Rating |
|---|---|---|---|---|
| Wold Escapes | 17 | $799,281 | 1432 | 2.31/5.0 |
| Andy | 1 | $29,481 | 123 | 4.98/5.0 |
Analyzing the strategies of top hosts, such as their property selection, pricing, and guest communication, can offer valuable lessons for optimizing your own Airbnb operations in Southburn.
Dive Deeper: Advanced Southburn STR Market Data (2025)
Ready to unlock more insights? AirROI provides access to advanced metrics and comprehensive Airbnb data for Southburn. Explore detailed analytics beyond this report to refine your investment strategy, optimize pricing, and maximize your vacation rental profits.
Explore Advanced MetricsSouthburn Short-Term Rental Market Composition (2025): Property & Room Types
Room Type Distribution
Property Type Distribution
Market Composition Insights for Southburn
- The Southburn Airbnb market composition is heavily skewed towards Entire Home/Apt listings, which make up 50% of the 18 active rentals. This indicates strong guest preference for privacy and space.
- However, a notable 50% share for Private Rooms suggests opportunities for budget-conscious travelers or hosts renting out spare rooms.
- Looking at the property type distribution in Southburn, Hotel/Boutique properties are the most common (50%), reflecting the local real estate landscape.
- Houses represent a significant 22.2% portion, catering likely to families or larger groups.
- The presence of 50% Hotel/Boutique listings indicates integration with traditional hospitality.
Southburn Airbnb Room Capacity Analysis (2025): Bedroom Distribution
Distribution of Listings by Number of Bedrooms
Room Capacity Insights for Southburn
- The dominant room capacity in Southburn is 1 bedroom listings, making up 88.9% of the market. This suggests a strong demand for properties suitable for couples or solo travelers.
- Together, 1 bedroom and 5+ bedrooms properties represent 94.5% of the active Airbnb listings in Southburn, indicating a high concentration in these sizes.
- With over half the market (88.9%) consisting of studios or 1-bedroom units, Southburn is particularly well-suited for individuals or couples.
- Listings with 3+ bedrooms (5.6%) represent a smaller niche, potentially indicating an underserved market for larger group accommodations in Southburn.
Southburn Vacation Rental Guest Capacity Trends (2025)
Distribution of Listings by Guest Capacity
Guest Capacity Insights for Southburn
- The most common guest capacity trend in Southburn vacation rentals is listings accommodating 2 guests (61.1%). This suggests the primary traveler segment is likely couples or solo travelers.
- Properties designed for 2 guests and 3 guests dominate the Southburn STR market, accounting for 88.9% of listings.
- A significant 61.1% of listings cater specifically to 1-2 guests, highlighting strong demand from couples and solo travelers in Southburn.
- On average, properties in Southburn are equipped to host 2.7 guests.
Southburn Airbnb Booking Patterns (2025): Available vs. Booked Days
Available Days Distribution
Booked Days Distribution
Booking Pattern Insights for Southburn
- The most common availability pattern in Southburn falls within the 271-366 days range, representing 50% of listings. This suggests many properties have significant open periods on their calendars.
- Approximately 50.0% of listings show high availability (181+ days open annually), indicating potential for increased bookings or specific owner usage patterns.
- For booked days, the 1-30 days range is most frequent in Southburn (50%), reflecting common guest stay durations or potential owner blocking patterns.
- A notable 50.0% of properties secure long booking periods (181+ days booked per year), highlighting successful long-term rental strategies or significant owner usage.
Southburn Airbnb Minimum Stay Requirements Analysis
Distribution of Listings by Minimum Night Requirement
1 Night
9 listings
50% of total
30+ Nights
9 listings
50% of total
Key Insights
- The most prevalent minimum stay requirement in Southburn is 1 Night, adopted by 50% of listings. This highlights the market's preference for shorter, flexible bookings.
- A significant segment (50%) caters to monthly stays (30+ nights) in Southburn, pointing to opportunities in the extended-stay market.
Recommendations
- Align with the market by considering a 1 Night minimum stay, as 50% of Southburn hosts use this setting.
- Explore offering discounts for stays of 30+ nights to attract the 50% of the market seeking extended stays.
- Adjust minimum nights based on seasonality – potentially shorter during low season and longer during peak demand periods in Southburn.
Southburn Airbnb Cancellation Policy Trends Analysis (2025)
Super Strict 30 Days
4 listings
44.4% of total
Flexible
3 listings
33.3% of total
Strict
2 listings
22.2% of total
Cancellation Policy Insights for Southburn
- The prevailing Airbnb cancellation policy trend in Southburn is Super Strict 30 Days, used by 44.4% of listings.
- There's a relatively balanced mix between guest-friendly (33.3%) and stricter (22.2%) policies, offering choices for different guest needs.
Recommendations for Hosts
- Consider adopting a Super Strict 30 Days policy to align with the 44.4% market standard in Southburn.
- Regularly review your cancellation policy against competitors and market demand shifts in Southburn.
Southburn STR Booking Lead Time Analysis (2025)
Average Booking Lead Time by Month
Booking Lead Time Insights for Southburn
- The overall average booking lead time for vacation rentals in Southburn is 79 days.
- Guests book furthest in advance for stays during March (average 84 days), likely coinciding with peak travel demand or local events.
- The shortest booking windows occur for stays in December (average 32 days), indicating more last-minute travel plans during this time.
- Seasonally, Spring (63 days avg.) sees the longest lead times, while Winter (36 days avg.) has the shortest, reflecting typical travel planning cycles.
Recommendations for Hosts
- Use the overall average lead time (79 days) as a baseline for your pricing and availability strategy in Southburn.
- Target marketing efforts for the Spring season well in advance (at least 63 days) to capture early planners.
- Monitor your own booking lead times against these Southburn averages to identify opportunities for dynamic pricing adjustments.
Popular & Essential Airbnb Amenities in Southburn (2025)
Amenity Prevalence
Amenity Insights for Southburn
- Essential amenities in Southburn that guests expect include: Wifi, Kitchen, TV, Fire extinguisher, Iron, Smoke alarm, Free parking on premises. Lacking these (any) could significantly impact bookings.
- Popular amenities like Outdoor dining area, Heating, Hair dryer are common but not universal. Offering these can provide a competitive edge.
Recommendations for Hosts
- Ensure your listing includes all essential amenities for Southburn: Wifi, Kitchen, TV, Fire extinguisher, Iron, Smoke alarm, Free parking on premises.
- Consider adding popular differentiators like Outdoor dining area or Heating to increase appeal.
- Highlight unique or less common amenities you offer (e.g., hot tub, dedicated workspace, EV charger) in your listing description and photos.
- Regularly check competitor amenities in Southburn to stay competitive.
Southburn Airbnb Guest Demographics & Profile Analysis (2025)
Guest Profile Summary for Southburn
- The typical guest profile for Airbnb in Southburn consists of primarily domestic travelers (99%), often arriving from nearby England, typically belonging to the Post-2000s (Gen Z/Alpha) group (50%), primarily speaking English or Spanish.
- Domestic travelers account for 99.2% of guests.
- Key international markets include United Kingdom (99.2%) and Saudi Arabia (0.4%).
- Top languages spoken are English (83.9%) followed by Spanish (3.2%).
- A significant demographic segment is the Post-2000s (Gen Z/Alpha) group, representing 50% of guests.
Recommendations for Hosts
- Target domestic marketing efforts towards travelers from England and Leeds.
- Tailor amenities and listing descriptions to appeal to the dominant Post-2000s (Gen Z/Alpha) demographic (e.g., highlight fast WiFi, smart home features, local guides).
- Highlight unique local experiences or amenities relevant to the primary guest profile.
- Consider seasonal promotions aligned with peak travel times for key origin markets.
Nearby Short-Term Rental Market Comparison
How does the Southburn Airbnb market stack up against its neighbors? Compare key performance metrics like average monthly revenue, ADR, and occupancy rates in surrounding areas to understand the broader regional STR landscape.
| Market | Active Properties | Monthly Revenue | Daily Rate | Avg. Occupancy |
|---|---|---|---|---|
| Grinton | 14 | $5,456 | $365.05 | 51% |
| Stamford Bridge | 11 | $4,669 | $410.14 | 38% |
| Appleby | 10 | $4,577 | $332.39 | 44% |
| Flore | 10 | $4,534 | $347.03 | 40% |
| Hayton | 13 | $4,333 | $239.53 | 60% |
| Bishop Monkton | 11 | $3,999 | $272.00 | 48% |
| Escrick | 10 | $3,849 | $322.07 | 44% |
| Ravensworth | 10 | $3,717 | $203.76 | 57% |
| Blubberhouses | 11 | $3,457 | $361.37 | 41% |
| Lythe | 33 | $3,401 | $304.10 | 44% |