South Staffordshire Airbnb Market Analysis 2025: Short Term Rental Data & Vacation Rental Statistics in England, United Kingdom
Is Airbnb profitable in South Staffordshire in 2025? Explore comprehensive Airbnb analytics for South Staffordshire, England, United Kingdom to uncover income potential. This 2025 STR market report for South Staffordshire, based on AirROI data from April 2024 to March 2025, reveals key trends in the niche market of 74 active listings.
Whether you're considering an Airbnb investment in South Staffordshire, optimizing your existing vacation rental, or exploring rental arbitrage opportunities, understanding the South Staffordshire Airbnb data is crucial. Leveraging the low regulation environment is key to maximizing your short term rental income potential. Let's dive into the specifics.
Key South Staffordshire Airbnb Performance Metrics Overview
Monthly Airbnb Revenue Variations & Income Potential in South Staffordshire (2025)
Understanding the monthly revenue variations for Airbnb listings in South Staffordshire is key to maximizing your short term rental income potential. Seasonality significantly impacts earnings. Our analysis, based on data from the past 12 months, shows that the peak revenue month for STRs in South Staffordshire is typically May, while February often presents the lowest earnings, highlighting opportunities for strategic pricing adjustments during shoulder and low seasons. Explore the typical Airbnb income in South Staffordshire across different performance tiers:
- Best-in-class properties (Top 10%) achieve $4,463+ monthly, often utilizing dynamic pricing and superior guest experiences.
- Strong performing properties (Top 25%) earn $2,785 or more, indicating effective management and desirable locations/amenities.
- Typical properties (Median) generate around $1,819 per month, representing the average market performance.
- Entry-level properties (Bottom 25%) see earnings around $970, often with potential for optimization.
Average Monthly Airbnb Earnings Trend in South Staffordshire
South Staffordshire Airbnb Occupancy Rate Trends (2025)
Maximize your bookings by understanding the South Staffordshire STR occupancy trends. Seasonal demand shifts significantly influence how often properties are booked. Typically, Octobersees the highest demand (peak season occupancy), while March experiences the lowest (low season). Effective strategies, like adjusting minimum stays or offering promotions, can boost occupancy during slower periods. Here's how different property tiers perform in South Staffordshire:
- Best-in-class properties (Top 10%) achieve 83%+ occupancy, indicating high desirability and potentially optimized availability.
- Strong performing properties (Top 25%) maintain 66% or higher occupancy, suggesting good market fit and guest satisfaction.
- Typical properties (Median) have an occupancy rate around 44%.
- Entry-level properties (Bottom 25%) average 21% occupancy, potentially facing higher vacancy.
Average Monthly Occupancy Rate Trend in South Staffordshire
Average Daily Rate (ADR) Airbnb Trends in South Staffordshire (2025)
Effective short term rental pricing strategy in South Staffordshire involves understanding monthly ADR fluctuations. The Average Daily Rate (ADR) for Airbnb in South Staffordshire typically peaks in August and dips lowest during November. Leveraging Airbnb dynamic pricing tools or strategies based on this seasonality can significantly boost revenue. Here's a look at the typical nightly rates achieved:
- Best-in-class properties (Top 10%) command rates of $289+ per night, often due to premium features or locations.
- Strong performing properties (Top 25%) achieve nightly rates of $186 or more.
- Typical properties (Median) charge around $127 per night.
- Entry-level properties (Bottom 25%) earn around $95 per night.
Average Daily Rate (ADR) Trend by Month in South Staffordshire
Get Live South Staffordshire Market Intelligence 👇

Explore Real-time Analytics
Airbnb Seasonality Analysis & Trends in South Staffordshire (2025)
Peak Season (May, December, November)
- Revenue averages $2,900 per month
- Occupancy rates average 47.8%
- Daily rates average $170
Shoulder Season
- Revenue averages $2,545 per month
- Occupancy maintains around 47.8%
- Daily rates hold near $172
Low Season (January, February, March)
- Revenue drops to average $1,674 per month
- Occupancy decreases to average 37.9%
- Daily rates adjust to average $168
Seasonality Insights for South Staffordshire
- The Airbnb seasonality in South Staffordshire shows highly seasonal trends requiring careful strategy. While the sections above show seasonal averages, it's also insightful to look at the extremes:
- During the high season, the absolute peak month showcases South Staffordshire's highest earning potential, with monthly revenues capable of climbing to $3,207, occupancy reaching a high of 49.4%, and ADRs peaking at $174.
- Conversely, the slowest single month of the year, typically falling within the low season, marks the market's lowest point. In this month, revenue might dip to $1,464, occupancy could drop to 36.8%, and ADRs may adjust down to $166.
- Understanding both the seasonal averages and these monthly peaks and troughs in revenue, occupancy, and ADR is crucial for maximizing your Airbnb profit potential in South Staffordshire.
Seasonal Strategies for Maximizing Profit
- Peak Season: Maximize revenue through premium pricing and potentially longer minimum stays. Ensure high availability.
- Low Season: Offer competitive pricing, special promotions (e.g., extended stay discounts), and flexible cancellation policies. Target off-season travelers like remote workers or budget-conscious guests.
- Shoulder Seasons: Implement dynamic pricing that balances peak and low rates. Target weekend travelers or specific events. Offer slightly more flexible terms than peak season.
- Regularly analyze your own performance against these South Staffordshire seasonality benchmarks and adjust your pricing and availability strategy accordingly.
Best Areas for Airbnb Investment in South Staffordshire (2025)
Exploring the top neighborhoods for short-term rentals in South Staffordshire? This section highlights key areas, outlining why they are attractive for hosts and guests, along with notable local attractions. Consider these locations based on your target guest profile and investment strategy.
| Neighborhood / Area | Why Host Here? (Target Guests & Appeal) | Key Attractions & Landmarks |
|---|---|---|
| Lichfield | Historical city known for its stunning cathedral and rich heritage. A popular destination for visitors interested in history and culture, making it ideal for short-term rentals. | Lichfield Cathedral, Samuel Johnson Birthplace Museum, Fradley Junction, The electric Theatre, Beacon Park |
| Penkridge | Charming market town with a strong community feel and picturesque surroundings. Attracts guests looking for a quiet getaway with access to nature and local markets. | Penkridge Market, Staffordshire and Worcestershire Canal, St. Michael's Church, Dunston Hall, Penkridge Old Hall |
| Wolverhampton | A vibrant city with a mix of historical and modern attractions. Popular for business travelers and those visiting for cultural events and entertainment. | Wolverhampton Art Gallery, Wolverhampton Grand Theatre, West Park, Molineux Stadium, Bilston Craft Gallery |
| Bloxwich | A bustling town with historical significance and close proximity to urban amenities. Great for visitors who want to explore the Black Country and Birmingham. | Bloxwich Park, The Bloxwich Builders, St. Mary’s Church, Walsall Arboretum, Walsall Leather Museum |
| Walsall | A town known for its rich industrial history and cultural diversity. Attracts guests interested in exploring the Black Country and its heritage. | Walsall Leather Museum, Walsall Arboretum, The New Art Gallery Walsall, Walsall Town Centre, The Cenozoic |
| Chasewater | A scenic area with a beautiful reservoir, ideal for nature lovers and outdoor enthusiasts. Perfect for guests looking for relaxation and outdoor activities. | Chasewater Country Park, Chasewater Railway, Cannock Chase AONB, Water sports on the reservoir, Walking and cycling trails |
| Stafford | Historic market town known for its proximity to attractive countryside and a variety of local attractions. Great for families and tourists exploring the surrounding area. | Stafford Castle, The Ancient High House, Victoria Park, Stafford Gatehouse Theatre, Staffordshire History Centre |
| Hednesford | A lively town with a mix of local attractions and outdoor spaces, ideal for visitors seeking both urban convenience and nature. | Hednesford Hills Nature Reserve, Hednesford Park, The Chase Golf Club, Cannock Chase, Cineworld |
Understanding Airbnb License Requirements & STR Laws in South Staffordshire (2025)
While South Staffordshire, England, United Kingdom currently shows low STR regulations, specific Airbnb license requirements might still exist or change. Always verify the latest short term rental regulations and Airbnb license requirements directly with local government authorities for South Staffordshire to ensure full compliance before hosting.
(Source: AirROI data, 2025, finding no licensed listings among those analyzed)
Top Performing Airbnb Properties in South Staffordshire (2025)
Benchmark your potential! Explore examples of top-performing Airbnb properties in South Staffordshirebased on Trailing Twelve Month (TTM) revenue. Analyze their characteristics, revenue, occupancy rate, and ADR to understand what drives success in this market.
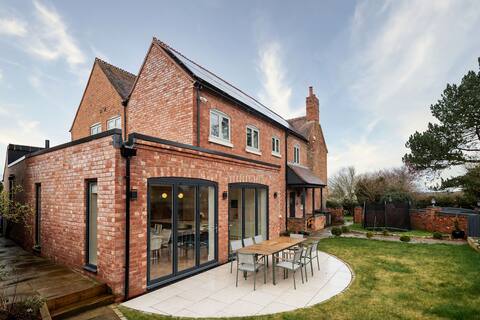
Beautiful countryside farmhouse
Entire Place • 6 bedrooms
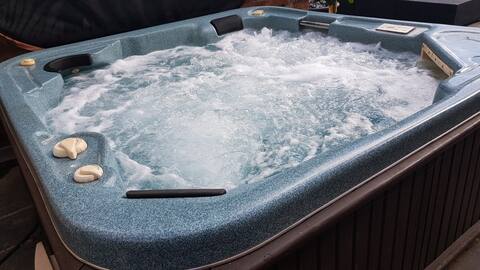
Self contained with hot tub & BBQ rural retreat
Entire Place • N/A

Smestow Wild Retreat
Entire Place • 2 bedrooms
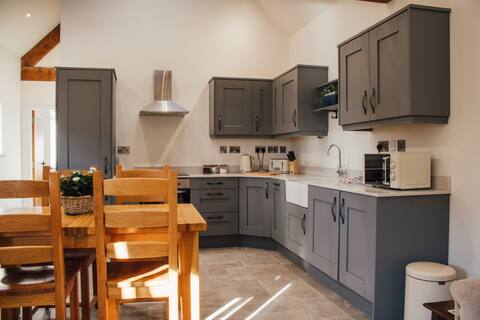
The Little Dairy - Nestled on a working farm
Entire Place • 1 bedroom
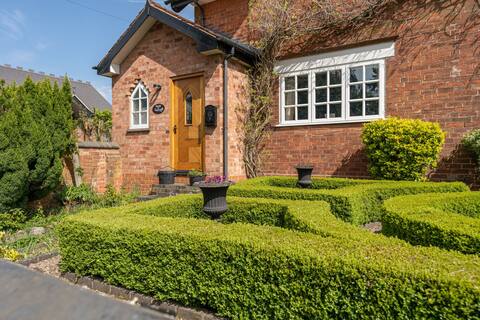
Beautiful Country Cottage for up to 8 people
Entire Place • 4 bedrooms
Gardeners Cottage
Entire Place • 3 bedrooms
Note: Performance varies based on location, size, amenities, seasonality, and management quality. Data reflects the past 12 months.
Top Performing Airbnb Hosts in South Staffordshire (2025)
Learn from the best! This table showcases top-performing Airbnb hosts in South Staffordshire based on the number of properties managed and estimated total revenue over the past year. Analyze their scale and performance metrics.
| Host Name | Properties | Grossing Revenue | Stay Reviews | Avg Rating |
|---|---|---|---|---|
| Cottages | 7 | $214,330 | 83 | 4.59/5.0 |
| Jessica | 1 | $191,046 | 15 | 5.00/5.0 |
| Adrian | 1 | $138,739 | 181 | 4.94/5.0 |
| Sue | 2 | $86,658 | 149 | 4.99/5.0 |
| Charlotte | 1 | $59,811 | 31 | 5.00/5.0 |
| Helena | 2 | $50,049 | 91 | 5.00/5.0 |
| Seven | 1 | $49,046 | 32 | 4.72/5.0 |
| Eirwen | 2 | $47,549 | 629 | 4.96/5.0 |
| Nikola | 1 | $37,381 | 7 | 5.00/5.0 |
| Jodie | 1 | $36,675 | 121 | 4.98/5.0 |
Analyzing the strategies of top hosts, such as their property selection, pricing, and guest communication, can offer valuable lessons for optimizing your own Airbnb operations in South Staffordshire.
Dive Deeper: Advanced South Staffordshire STR Market Data (2025)
Ready to unlock more insights? AirROI provides access to advanced metrics and comprehensive Airbnb data for South Staffordshire. Explore detailed analytics beyond this report to refine your investment strategy, optimize pricing, and maximize your vacation rental profits.
Explore Advanced MetricsSouth Staffordshire Short-Term Rental Market Composition (2025): Property & Room Types
Room Type Distribution
Property Type Distribution
Market Composition Insights for South Staffordshire
- The South Staffordshire Airbnb market composition is heavily skewed towards Entire Home/Apt listings, which make up 86.5% of the 74 active rentals. This indicates strong guest preference for privacy and space.
- Looking at the property type distribution in South Staffordshire, House properties are the most common (58.1%), reflecting the local real estate landscape.
- Houses represent a significant 58.1% portion, catering likely to families or larger groups.
- The presence of 6.8% Hotel/Boutique listings indicates integration with traditional hospitality.
South Staffordshire Airbnb Room Capacity Analysis (2025): Bedroom Distribution
Distribution of Listings by Number of Bedrooms
Room Capacity Insights for South Staffordshire
- The dominant room capacity in South Staffordshire is 1 bedroom listings, making up 47.3% of the market. This suggests a strong demand for properties suitable for couples or solo travelers.
- Together, 1 bedroom and 2 bedrooms properties represent 64.9% of the active Airbnb listings in South Staffordshire, indicating a high concentration in these sizes.
- A significant 23.0% of listings offer 3+ bedrooms, catering to larger groups and families seeking more space in South Staffordshire.
South Staffordshire Vacation Rental Guest Capacity Trends (2025)
Distribution of Listings by Guest Capacity
Guest Capacity Insights for South Staffordshire
- The most common guest capacity trend in South Staffordshire vacation rentals is listings accommodating 2 guests (37.8%). This suggests the primary traveler segment is likely couples or solo travelers.
- Properties designed for 2 guests and 4 guests dominate the South Staffordshire STR market, accounting for 60.8% of listings.
- 14.9% of properties accommodate 6+ guests, serving the market segment for larger families or group travel in South Staffordshire.
- On average, properties in South Staffordshire are equipped to host 3.2 guests.
South Staffordshire Airbnb Booking Patterns (2025): Available vs. Booked Days
Available Days Distribution
Booked Days Distribution
Booking Pattern Insights for South Staffordshire
- The most common availability pattern in South Staffordshire falls within the 271-366 days range, representing 37.8% of listings. This suggests many properties have significant open periods on their calendars.
- Approximately 63.5% of listings show high availability (181+ days open annually), indicating potential for increased bookings or specific owner usage patterns.
- For booked days, the 181-270 days range is most frequent in South Staffordshire (29.7%), reflecting common guest stay durations or potential owner blocking patterns.
- A notable 37.8% of properties secure long booking periods (181+ days booked per year), highlighting successful long-term rental strategies or significant owner usage.
South Staffordshire Airbnb Minimum Stay Requirements Analysis
Distribution of Listings by Minimum Night Requirement
1 Night
25 listings
35.7% of total
2 Nights
26 listings
37.1% of total
3 Nights
5 listings
7.1% of total
4-6 Nights
5 listings
7.1% of total
7-29 Nights
3 listings
4.3% of total
30+ Nights
6 listings
8.6% of total
Key Insights
- The most prevalent minimum stay requirement in South Staffordshire is 2 Nights, adopted by 37.1% of listings. This highlights the market's preference for shorter, flexible bookings.
- A strong majority (72.8%) of the South Staffordshire Airbnb data shows acceptance of very short stays (1-2 nights), indicating a dynamic, high-turnover market.
Recommendations
- Align with the market by considering a 2 Nights minimum stay, as 37.1% of South Staffordshire hosts use this setting.
- Explore offering discounts for stays of 30+ nights to attract the 8.6% of the market seeking extended stays.
- Adjust minimum nights based on seasonality – potentially shorter during low season and longer during peak demand periods in South Staffordshire.
South Staffordshire Airbnb Cancellation Policy Trends Analysis (2025)
Super Strict 60 Days
7 listings
10.6% of total
Flexible
22 listings
33.3% of total
Moderate
23 listings
34.8% of total
Firm
7 listings
10.6% of total
Strict
7 listings
10.6% of total
Cancellation Policy Insights for South Staffordshire
- The prevailing Airbnb cancellation policy trend in South Staffordshire is Moderate, used by 34.8% of listings.
- There's a relatively balanced mix between guest-friendly (68.1%) and stricter (21.2%) policies, offering choices for different guest needs.
Recommendations for Hosts
- Consider adopting a Moderate policy to align with the 34.8% market standard in South Staffordshire.
- Using a Strict policy might deter some guests, as only 10.6% of listings use it. Evaluate if potential revenue protection outweighs possible lower booking rates.
- Regularly review your cancellation policy against competitors and market demand shifts in South Staffordshire.
South Staffordshire STR Booking Lead Time Analysis (2025)
Average Booking Lead Time by Month
Booking Lead Time Insights for South Staffordshire
- The overall average booking lead time for vacation rentals in South Staffordshire is 46 days.
- Guests book furthest in advance for stays during June (average 63 days), likely coinciding with peak travel demand or local events.
- The shortest booking windows occur for stays in March (average 28 days), indicating more last-minute travel plans during this time.
- Seasonally, Summer (61 days avg.) sees the longest lead times, while Fall (44 days avg.) has the shortest, reflecting typical travel planning cycles.
Recommendations for Hosts
- Use the overall average lead time (46 days) as a baseline for your pricing and availability strategy in South Staffordshire.
- For June stays, consider implementing length-of-stay discounts or slightly higher rates for bookings made less than 63 days out to capitalize on advance planning.
- Target marketing efforts for the Summer season well in advance (at least 61 days) to capture early planners.
- Monitor your own booking lead times against these South Staffordshire averages to identify opportunities for dynamic pricing adjustments.
Popular & Essential Airbnb Amenities in South Staffordshire (2025)
Amenity Prevalence
Amenity Insights for South Staffordshire
- Essential amenities in South Staffordshire that guests expect include: Free parking on premises, Wifi. Lacking these (any) could significantly impact bookings.
- Popular amenities like Heating, Smoke alarm, TV are common but not universal. Offering these can provide a competitive edge.
Recommendations for Hosts
- Ensure your listing includes all essential amenities for South Staffordshire: Free parking on premises, Wifi.
- Prioritize adding missing essentials: Free parking on premises, Wifi.
- Consider adding popular differentiators like Heating or Smoke alarm to increase appeal.
- Highlight unique or less common amenities you offer (e.g., hot tub, dedicated workspace, EV charger) in your listing description and photos.
- Regularly check competitor amenities in South Staffordshire to stay competitive.
South Staffordshire Airbnb Guest Demographics & Profile Analysis (2025)
Guest Profile Summary for South Staffordshire
- The typical guest profile for Airbnb in South Staffordshire consists of primarily domestic travelers (92%), often arriving from nearby England, typically belonging to the Post-2000s (Gen Z/Alpha) group (50%), primarily speaking English or French.
- Domestic travelers account for 91.7% of guests.
- Key international markets include United Kingdom (91.7%) and United States (3.1%).
- Top languages spoken are English (77.2%) followed by French (7.3%).
- A significant demographic segment is the Post-2000s (Gen Z/Alpha) group, representing 50% of guests.
Recommendations for Hosts
- Target domestic marketing efforts towards travelers from England and London.
- Tailor amenities and listing descriptions to appeal to the dominant Post-2000s (Gen Z/Alpha) demographic (e.g., highlight fast WiFi, smart home features, local guides).
- Highlight unique local experiences or amenities relevant to the primary guest profile.
- Consider seasonal promotions aligned with peak travel times for key origin markets.
Nearby Short-Term Rental Market Comparison
How does the South Staffordshire Airbnb market stack up against its neighbors? Compare key performance metrics like average monthly revenue, ADR, and occupancy rates in surrounding areas to understand the broader regional STR landscape.
| Market | Active Properties | Monthly Revenue | Daily Rate | Avg. Occupancy |
|---|---|---|---|---|
| Englishcombe | 13 | $8,558 | $573.69 | 49% |
| Chew Magna | 14 | $6,649 | $399.59 | 46% |
| Lambourn | 11 | $6,081 | $669.47 | 28% |
| Long Sutton | 17 | $5,726 | $383.88 | 46% |
| Stoke St. Michael | 10 | $5,277 | $424.04 | 42% |
| Oldland Common | 13 | $5,093 | $355.47 | 43% |
| Crai | 20 | $4,799 | $371.85 | 46% |
| Dinton | 11 | $4,637 | $242.16 | 58% |
| Limpley Stoke | 10 | $4,598 | $523.47 | 52% |
| Flore | 10 | $4,534 | $347.03 | 40% |