Skelwith Bridge Airbnb Market Analysis 2025: Short Term Rental Data & Vacation Rental Statistics in England, United Kingdom
Is Airbnb profitable in Skelwith Bridge in 2025? Explore comprehensive Airbnb analytics for Skelwith Bridge, England, United Kingdom to uncover income potential. This 2025 STR market report for Skelwith Bridge, based on AirROI data from April 2024 to March 2025, reveals key trends in the niche market of 43 active listings.
Whether you're considering an Airbnb investment in Skelwith Bridge, optimizing your existing vacation rental, or exploring rental arbitrage opportunities, understanding the Skelwith Bridge Airbnb data is crucial. Leveraging the low regulation environment is key to maximizing your short term rental income potential. Let's dive into the specifics.
Key Skelwith Bridge Airbnb Performance Metrics Overview
Monthly Airbnb Revenue Variations & Income Potential in Skelwith Bridge (2025)
Understanding the monthly revenue variations for Airbnb listings in Skelwith Bridge is key to maximizing your short term rental income potential. Seasonality significantly impacts earnings. Our analysis, based on data from the past 12 months, shows that the peak revenue month for STRs in Skelwith Bridge is typically July, while March often presents the lowest earnings, highlighting opportunities for strategic pricing adjustments during shoulder and low seasons. Explore the typical Airbnb income in Skelwith Bridge across different performance tiers:
- Best-in-class properties (Top 10%) achieve $6,681+ monthly, often utilizing dynamic pricing and superior guest experiences.
- Strong performing properties (Top 25%) earn $4,558 or more, indicating effective management and desirable locations/amenities.
- Typical properties (Median) generate around $3,116 per month, representing the average market performance.
- Entry-level properties (Bottom 25%) see earnings around $1,711, often with potential for optimization.
Average Monthly Airbnb Earnings Trend in Skelwith Bridge
Skelwith Bridge Airbnb Occupancy Rate Trends (2025)
Maximize your bookings by understanding the Skelwith Bridge STR occupancy trends. Seasonal demand shifts significantly influence how often properties are booked. Typically, Augustsees the highest demand (peak season occupancy), while March experiences the lowest (low season). Effective strategies, like adjusting minimum stays or offering promotions, can boost occupancy during slower periods. Here's how different property tiers perform in Skelwith Bridge:
- Best-in-class properties (Top 10%) achieve 80%+ occupancy, indicating high desirability and potentially optimized availability.
- Strong performing properties (Top 25%) maintain 63% or higher occupancy, suggesting good market fit and guest satisfaction.
- Typical properties (Median) have an occupancy rate around 38%.
- Entry-level properties (Bottom 25%) average 16% occupancy, potentially facing higher vacancy.
Average Monthly Occupancy Rate Trend in Skelwith Bridge
Average Daily Rate (ADR) Airbnb Trends in Skelwith Bridge (2025)
Effective short term rental pricing strategy in Skelwith Bridge involves understanding monthly ADR fluctuations. The Average Daily Rate (ADR) for Airbnb in Skelwith Bridge typically peaks in August and dips lowest during March. Leveraging Airbnb dynamic pricing tools or strategies based on this seasonality can significantly boost revenue. Here's a look at the typical nightly rates achieved:
- Best-in-class properties (Top 10%) command rates of $541+ per night, often due to premium features or locations.
- Strong performing properties (Top 25%) achieve nightly rates of $366 or more.
- Typical properties (Median) charge around $249 per night.
- Entry-level properties (Bottom 25%) earn around $168 per night.
Average Daily Rate (ADR) Trend by Month in Skelwith Bridge
Get Live Skelwith Bridge Market Intelligence 👇

Explore Real-time Analytics
Airbnb Seasonality Analysis & Trends in Skelwith Bridge (2025)
Peak Season (July, August, September)
- Revenue averages $4,706 per month
- Occupancy rates average 51.7%
- Daily rates average $330
Shoulder Season
- Revenue averages $3,964 per month
- Occupancy maintains around 41.7%
- Daily rates hold near $312
Low Season (February, March, November)
- Revenue drops to average $2,366 per month
- Occupancy decreases to average 29.0%
- Daily rates adjust to average $297
Seasonality Insights for Skelwith Bridge
- The Airbnb seasonality in Skelwith Bridge shows highly seasonal trends requiring careful strategy. While the sections above show seasonal averages, it's also insightful to look at the extremes:
- During the high season, the absolute peak month showcases Skelwith Bridge's highest earning potential, with monthly revenues capable of climbing to $4,908, occupancy reaching a high of 53.9%, and ADRs peaking at $340.
- Conversely, the slowest single month of the year, typically falling within the low season, marks the market's lowest point. In this month, revenue might dip to $1,922, occupancy could drop to 21.6%, and ADRs may adjust down to $290.
- Understanding both the seasonal averages and these monthly peaks and troughs in revenue, occupancy, and ADR is crucial for maximizing your Airbnb profit potential in Skelwith Bridge.
Seasonal Strategies for Maximizing Profit
- Peak Season: Maximize revenue through premium pricing and potentially longer minimum stays. Ensure high availability.
- Low Season: Offer competitive pricing, special promotions (e.g., extended stay discounts), and flexible cancellation policies. Target off-season travelers like remote workers or budget-conscious guests.
- Shoulder Seasons: Implement dynamic pricing that balances peak and low rates. Target weekend travelers or specific events. Offer slightly more flexible terms than peak season.
- Regularly analyze your own performance against these Skelwith Bridge seasonality benchmarks and adjust your pricing and availability strategy accordingly.
Best Areas for Airbnb Investment in Skelwith Bridge (2025)
Exploring the top neighborhoods for short-term rentals in Skelwith Bridge? This section highlights key areas, outlining why they are attractive for hosts and guests, along with notable local attractions. Consider these locations based on your target guest profile and investment strategy.
| Neighborhood / Area | Why Host Here? (Target Guests & Appeal) | Key Attractions & Landmarks |
|---|---|---|
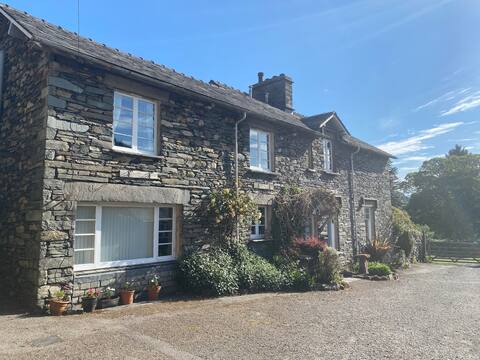
| Skelwith Bridge | A picturesque village in the Lake District, perfect for outdoor enthusiasts and nature lovers. Its serene environment attracts families and groups seeking a peaceful retreat close to beautiful hiking trails and scenic views. | Lake Windermere, Rydal Water, Loughrigg Fell, Grasmere Village, Wordsworth's Dove Cottage, Ambleside Market |
| Ambleside | A bustling town in the Lake District, offering a mix of shops, cafes, and restaurants. Ideal for those looking to host visitors who want easy access to hiking, water sports, and local culture. | Lake Windermere, Stock Ghyll Force, The Bridge House, Ambleside Roman Fort, Rydal Mount, Wansfell Pike |
| Grasmere | Famous for its connection to poet William Wordsworth and stunning scenery. Grasmere is popular for visitors looking to explore the literary heritage and stunning countryside, making it a desirable location for Airbnb. | Dove Cottage, Grasmere Lake, Wordsworth Museum, Rydal Water, Easedale Tarn, Lake District National Park |
| Coniston | A charming village on the shores of Coniston Water, popular for boating and hiking. Perfect for guests who enjoy outdoor activities and scenic landscapes. | Coniston Water, The Old Man of Coniston, Brantwood House, Coniston Boating Centre, Torver Common, South Lakeland Mines |
| Windermere | One of the Lake District's most well-known areas, famous for its lake and tourism offerings. Ideal for attracting tourists who want beautiful scenic views and lakeside activities. | Lake Windermere, Bowness-on-Windermere, The World of Beatrix Potter, Windermere Jetty Museum, Orrest Head, Wray Castle |
| Bowness-on-Windermere | A popular tourist destination on the shores of Lake Windermere, known for its vibrant atmosphere and lake activities. Great for visitors looking for entertainment and relaxation by the water. | Windermere Lake Cruises, Bowness Bay, Blackwell Arts & Crafts House, The Old Laundry Theatre, St Martin's Church, Bay Search and Rescue |
| Kendal | Known as the Southern Gateway to the Lake District, Kendal offers a historic market town experience with amenities. Attracts visitors wanting to explore both the town and the surrounding nature. | Kendal Castle, Abbot Hall Art Gallery, Museum of Lakeland Life, Kendal Brewery, The River Kent, Quaker Tapestry Museum |
| Staveley | A charming village located close to the Lake District, popular for its local craft breweries and scenic walks. Excellent for those wanting to escape into the countryside while still being close to larger towns. | Hawkshead Brewery, Staveley Mill Yard, Kentmere Valley, The Helm, Staveley Village Store, River Gowan |
Understanding Airbnb License Requirements & STR Laws in Skelwith Bridge (2025)
While Skelwith Bridge, England, United Kingdom currently shows low STR regulations, specific Airbnb license requirements might still exist or change. Always verify the latest short term rental regulations and Airbnb license requirements directly with local government authorities for Skelwith Bridge to ensure full compliance before hosting.
(Source: AirROI data, 2025, finding no licensed listings among those analyzed)
Top Performing Airbnb Properties in Skelwith Bridge (2025)
Benchmark your potential! Explore examples of top-performing Airbnb properties in Skelwith Bridgebased on Trailing Twelve Month (TTM) revenue. Analyze their characteristics, revenue, occupancy rate, and ADR to understand what drives success in this market.
Elterwater Park Farmhouse Self Catering with EV
Entire Place • 5 bedrooms
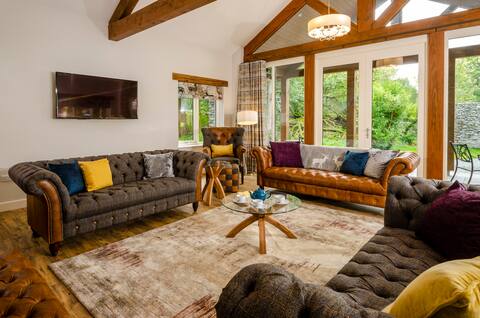
Lake District Luxury 6 Bedroom Home with hot tub
Entire Place • 6 bedrooms
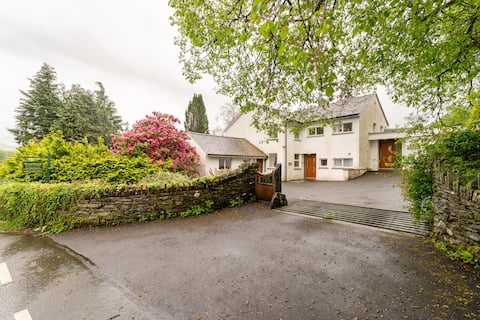
Greenbank House Spacious home for 10; Pet friendly
Entire Place • 5 bedrooms
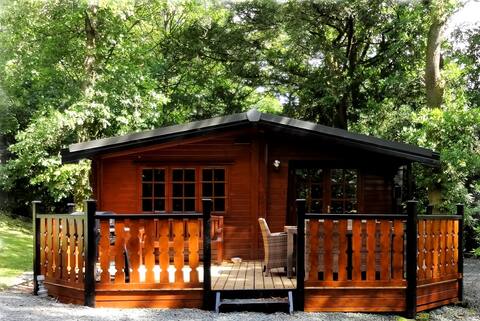
Blelham Tarn (Rustic cabin in tranquil woodland)
Entire Place • 2 bedrooms
Beech Cottage (Hot Tub) - Skelwith Bridge
Entire Place • 3 bedrooms
Ambleside Lakes Romantic country cottage
Entire Place • 1 bedroom
Note: Performance varies based on location, size, amenities, seasonality, and management quality. Data reflects the past 12 months.
Top Performing Airbnb Hosts in Skelwith Bridge (2025)
Learn from the best! This table showcases top-performing Airbnb hosts in Skelwith Bridge based on the number of properties managed and estimated total revenue over the past year. Analyze their scale and performance metrics.
| Host Name | Properties | Grossing Revenue | Stay Reviews | Avg Rating |
|---|---|---|---|---|
| Liz | 7 | $325,715 | 298 | 4.04/5.0 |
| Jerry | 8 | $199,086 | 136 | 4.07/5.0 |
| Lorraine | 4 | $170,364 | 58 | 4.98/5.0 |
| Elizabeth | 2 | $99,975 | 235 | 4.63/5.0 |
| Roja | 1 | $71,520 | 100 | 4.83/5.0 |
| Andy | 1 | $71,164 | 149 | 4.93/5.0 |
| Michelle | 6 | $67,156 | 189 | 4.81/5.0 |
| George | 1 | $65,999 | 41 | 4.71/5.0 |
| Cottages | 2 | $51,191 | 24 | 4.79/5.0 |
| Sherif | 1 | $45,938 | 133 | 4.92/5.0 |
Analyzing the strategies of top hosts, such as their property selection, pricing, and guest communication, can offer valuable lessons for optimizing your own Airbnb operations in Skelwith Bridge.
Dive Deeper: Advanced Skelwith Bridge STR Market Data (2025)
Ready to unlock more insights? AirROI provides access to advanced metrics and comprehensive Airbnb data for Skelwith Bridge. Explore detailed analytics beyond this report to refine your investment strategy, optimize pricing, and maximize your vacation rental profits.
Explore Advanced MetricsSkelwith Bridge Short-Term Rental Market Composition (2025): Property & Room Types
Room Type Distribution
Property Type Distribution
Market Composition Insights for Skelwith Bridge
- The Skelwith Bridge Airbnb market composition is heavily skewed towards Entire Home/Apt listings, which make up 97.7% of the 43 active rentals. This indicates strong guest preference for privacy and space.
- Looking at the property type distribution in Skelwith Bridge, House properties are the most common (60.5%), reflecting the local real estate landscape.
- Houses represent a significant 60.5% portion, catering likely to families or larger groups.
- Smaller segments like hotel/boutique, others (combined 4.6%) offer potential for unique stay experiences.
Skelwith Bridge Airbnb Room Capacity Analysis (2025): Bedroom Distribution
Distribution of Listings by Number of Bedrooms
Room Capacity Insights for Skelwith Bridge
- The dominant room capacity in Skelwith Bridge is 2 bedrooms listings, making up 34.9% of the market. This suggests a strong demand for properties suitable for couples or solo travelers.
- Together, 2 bedrooms and 1 bedroom properties represent 60.5% of the active Airbnb listings in Skelwith Bridge, indicating a high concentration in these sizes.
- A significant 34.9% of listings offer 3+ bedrooms, catering to larger groups and families seeking more space in Skelwith Bridge.
Skelwith Bridge Vacation Rental Guest Capacity Trends (2025)
Distribution of Listings by Guest Capacity
Guest Capacity Insights for Skelwith Bridge
- The most common guest capacity trend in Skelwith Bridge vacation rentals is listings accommodating 4 guests (34.9%). This suggests the primary traveler segment is likely small families or groups.
- Properties designed for 4 guests and 2 guests dominate the Skelwith Bridge STR market, accounting for 65.1% of listings.
- 32.6% of properties accommodate 6+ guests, serving the market segment for larger families or group travel in Skelwith Bridge.
- On average, properties in Skelwith Bridge are equipped to host 4.3 guests.
Skelwith Bridge Airbnb Booking Patterns (2025): Available vs. Booked Days
Available Days Distribution
Booked Days Distribution
Booking Pattern Insights for Skelwith Bridge
- The most common availability pattern in Skelwith Bridge falls within the 271-366 days range, representing 48.8% of listings. This suggests many properties have significant open periods on their calendars.
- Approximately 79.0% of listings show high availability (181+ days open annually), indicating potential for increased bookings or specific owner usage patterns.
- For booked days, the 91-180 days range is most frequent in Skelwith Bridge (34.9%), reflecting common guest stay durations or potential owner blocking patterns.
- A notable 21.0% of properties secure long booking periods (181+ days booked per year), highlighting successful long-term rental strategies or significant owner usage.
Skelwith Bridge Airbnb Minimum Stay Requirements Analysis
Distribution of Listings by Minimum Night Requirement
1 Night
16 listings
38.1% of total
2 Nights
4 listings
9.5% of total
3 Nights
12 listings
28.6% of total
7-29 Nights
2 listings
4.8% of total
30+ Nights
8 listings
19% of total
Key Insights
- The most prevalent minimum stay requirement in Skelwith Bridge is 1 Night, adopted by 38.1% of listings. This highlights the market's preference for shorter, flexible bookings.
- A significant segment (19%) caters to monthly stays (30+ nights) in Skelwith Bridge, pointing to opportunities in the extended-stay market.
Recommendations
- Align with the market by considering a 1 Night minimum stay, as 38.1% of Skelwith Bridge hosts use this setting.
- Explore offering discounts for stays of 30+ nights to attract the 19% of the market seeking extended stays.
- Adjust minimum nights based on seasonality – potentially shorter during low season and longer during peak demand periods in Skelwith Bridge.
Skelwith Bridge Airbnb Cancellation Policy Trends Analysis (2025)
Super Strict 60 Days
4 listings
11.1% of total
Super Strict 30 Days
6 listings
16.7% of total
Firm
1 listings
2.8% of total
Strict
25 listings
69.4% of total
Cancellation Policy Insights for Skelwith Bridge
- The prevailing Airbnb cancellation policy trend in Skelwith Bridge is Strict, used by 69.4% of listings.
- A majority (72.2%) of hosts in Skelwith Bridge utilize Firm or Strict policies, indicating a market where hosts prioritize booking security.
Recommendations for Hosts
- Consider adopting a Strict policy to align with the 69.4% market standard in Skelwith Bridge.
- With 69.4% using Strict terms, this is a viable option in Skelwith Bridge, particularly for high-value properties or during peak demand periods.
- Regularly review your cancellation policy against competitors and market demand shifts in Skelwith Bridge.
Skelwith Bridge STR Booking Lead Time Analysis (2025)
Average Booking Lead Time by Month
Booking Lead Time Insights for Skelwith Bridge
- The overall average booking lead time for vacation rentals in Skelwith Bridge is 80 days.
- Guests book furthest in advance for stays during May (average 113 days), likely coinciding with peak travel demand or local events.
- The shortest booking windows occur for stays in March (average 45 days), indicating more last-minute travel plans during this time.
- Seasonally, Summer (92 days avg.) sees the longest lead times, while Spring (77 days avg.) has the shortest, reflecting typical travel planning cycles.
Recommendations for Hosts
- Use the overall average lead time (80 days) as a baseline for your pricing and availability strategy in Skelwith Bridge.
- For May stays, consider implementing length-of-stay discounts or slightly higher rates for bookings made less than 113 days out to capitalize on advance planning.
- Target marketing efforts for the Summer season well in advance (at least 92 days) to capture early planners.
- Monitor your own booking lead times against these Skelwith Bridge averages to identify opportunities for dynamic pricing adjustments.
Popular & Essential Airbnb Amenities in Skelwith Bridge (2025)
Amenity Prevalence
Amenity Insights for Skelwith Bridge
- Essential amenities in Skelwith Bridge that guests expect include: Heating, TV, Smoke alarm, Kitchen. Lacking these (any) could significantly impact bookings.
- Popular amenities like Fire extinguisher, Wifi, Essentials are common but not universal. Offering these can provide a competitive edge.
- Warning: Wifi is not universally provided but is considered essential globally. Ensure reliable Wifi is offered.
Recommendations for Hosts
- Ensure your listing includes all essential amenities for Skelwith Bridge: Heating, TV, Smoke alarm, Kitchen.
- Prioritize adding missing essentials: Smoke alarm, Kitchen.
- Consider adding popular differentiators like Fire extinguisher or Wifi to increase appeal.
- Highlight unique or less common amenities you offer (e.g., hot tub, dedicated workspace, EV charger) in your listing description and photos.
- Regularly check competitor amenities in Skelwith Bridge to stay competitive.
Skelwith Bridge Airbnb Guest Demographics & Profile Analysis (2025)
Guest Profile Summary for Skelwith Bridge
- The typical guest profile for Airbnb in Skelwith Bridge consists of primarily domestic travelers (96%), often arriving from nearby England, typically belonging to the Post-2000s (Gen Z/Alpha) group (50%), primarily speaking English or French.
- Domestic travelers account for 95.7% of guests.
- Key international markets include United Kingdom (95.7%) and Australia (2.2%).
- Top languages spoken are English (76.5%) followed by French (4.7%).
- A significant demographic segment is the Post-2000s (Gen Z/Alpha) group, representing 50% of guests.
Recommendations for Hosts
- Target domestic marketing efforts towards travelers from England and London.
- Tailor amenities and listing descriptions to appeal to the dominant Post-2000s (Gen Z/Alpha) demographic (e.g., highlight fast WiFi, smart home features, local guides).
- Highlight unique local experiences or amenities relevant to the primary guest profile.
- Consider seasonal promotions aligned with peak travel times for key origin markets.
Nearby Short-Term Rental Market Comparison
How does the Skelwith Bridge Airbnb market stack up against its neighbors? Compare key performance metrics like average monthly revenue, ADR, and occupancy rates in surrounding areas to understand the broader regional STR landscape.
| Market | Active Properties | Monthly Revenue | Daily Rate | Avg. Occupancy |
|---|---|---|---|---|
| Galston | 11 | $7,951 | $676.77 | 46% |
| Gorebridge | 12 | $6,209 | $493.62 | 54% |
| Cartmel Fell | 17 | $4,719 | $331.68 | 52% |
| Casterton | 11 | $4,578 | $300.82 | 51% |
| Cark | 11 | $4,540 | $885.21 | 31% |
| City of Edinburgh | 4,312 | $4,528 | $274.67 | 61% |
| Eglwys-bach | 16 | $4,413 | $315.23 | 52% |
| Waverton | 16 | $4,358 | $444.20 | 33% |
| Watermillock | 16 | $4,281 | $274.03 | 50% |
| Kielder | 12 | $4,215 | $329.21 | 53% |