Shop Airbnb Market Analysis 2025: Short Term Rental Data & Vacation Rental Statistics in England, United Kingdom
Is Airbnb profitable in Shop in 2025? Explore comprehensive Airbnb analytics for Shop, England, United Kingdom to uncover income potential. This 2025 STR market report for Shop, based on AirROI data from April 2024 to March 2025, reveals key trends in the niche market of 17 active listings.
Whether you're considering an Airbnb investment in Shop, optimizing your existing vacation rental, or exploring rental arbitrage opportunities, understanding the Shop Airbnb data is crucial. Leveraging the low regulation environment is key to maximizing your short term rental income potential. Let's dive into the specifics.
Key Shop Airbnb Performance Metrics Overview
Monthly Airbnb Revenue Variations & Income Potential in Shop (2025)
Understanding the monthly revenue variations for Airbnb listings in Shop is key to maximizing your short term rental income potential. Seasonality significantly impacts earnings. Our analysis, based on data from the past 12 months, shows that the peak revenue month for STRs in Shop is typically August, while March often presents the lowest earnings, highlighting opportunities for strategic pricing adjustments during shoulder and low seasons. Explore the typical Airbnb income in Shop across different performance tiers:
- Best-in-class properties (Top 10%) achieve $4,925+ monthly, often utilizing dynamic pricing and superior guest experiences.
- Strong performing properties (Top 25%) earn $3,435 or more, indicating effective management and desirable locations/amenities.
- Typical properties (Median) generate around $2,227 per month, representing the average market performance.
- Entry-level properties (Bottom 25%) see earnings around $1,614, often with potential for optimization.
Average Monthly Airbnb Earnings Trend in Shop
Shop Airbnb Occupancy Rate Trends (2025)
Maximize your bookings by understanding the Shop STR occupancy trends. Seasonal demand shifts significantly influence how often properties are booked. Typically, Augustsees the highest demand (peak season occupancy), while March experiences the lowest (low season). Effective strategies, like adjusting minimum stays or offering promotions, can boost occupancy during slower periods. Here's how different property tiers perform in Shop:
- Best-in-class properties (Top 10%) achieve 68%+ occupancy, indicating high desirability and potentially optimized availability.
- Strong performing properties (Top 25%) maintain 55% or higher occupancy, suggesting good market fit and guest satisfaction.
- Typical properties (Median) have an occupancy rate around 42%.
- Entry-level properties (Bottom 25%) average 30% occupancy, potentially facing higher vacancy.
Average Monthly Occupancy Rate Trend in Shop
Average Daily Rate (ADR) Airbnb Trends in Shop (2025)
Effective short term rental pricing strategy in Shop involves understanding monthly ADR fluctuations. The Average Daily Rate (ADR) for Airbnb in Shop typically peaks in March and dips lowest during September. Leveraging Airbnb dynamic pricing tools or strategies based on this seasonality can significantly boost revenue. Here's a look at the typical nightly rates achieved:
- Best-in-class properties (Top 10%) command rates of $710+ per night, often due to premium features or locations.
- Strong performing properties (Top 25%) achieve nightly rates of $281 or more.
- Typical properties (Median) charge around $164 per night.
- Entry-level properties (Bottom 25%) earn around $137 per night.
Average Daily Rate (ADR) Trend by Month in Shop
Get Live Shop Market Intelligence 👇

Explore Real-time Analytics
Airbnb Seasonality Analysis & Trends in Shop (2025)
Peak Season (August, July, June)
- Revenue averages $4,748 per month
- Occupancy rates average 59.1%
- Daily rates average $254
Shoulder Season
- Revenue averages $2,284 per month
- Occupancy maintains around 41.3%
- Daily rates hold near $284
Low Season (March, April, October)
- Revenue drops to average $1,697 per month
- Occupancy decreases to average 31.2%
- Daily rates adjust to average $286
Seasonality Insights for Shop
- The Airbnb seasonality in Shop shows highly seasonal trends requiring careful strategy. While the sections above show seasonal averages, it's also insightful to look at the extremes:
- During the high season, the absolute peak month showcases Shop's highest earning potential, with monthly revenues capable of climbing to $6,237, occupancy reaching a high of 73.3%, and ADRs peaking at $382.
- Conversely, the slowest single month of the year, typically falling within the low season, marks the market's lowest point. In this month, revenue might dip to $1,190, occupancy could drop to 22.6%, and ADRs may adjust down to $231.
- Understanding both the seasonal averages and these monthly peaks and troughs in revenue, occupancy, and ADR is crucial for maximizing your Airbnb profit potential in Shop.
Seasonal Strategies for Maximizing Profit
- Peak Season: Maximize revenue through premium pricing and potentially longer minimum stays. Ensure high availability.
- Low Season: Offer competitive pricing, special promotions (e.g., extended stay discounts), and flexible cancellation policies. Target off-season travelers like remote workers or budget-conscious guests.
- Shoulder Seasons: Implement dynamic pricing that balances peak and low rates. Target weekend travelers or specific events. Offer slightly more flexible terms than peak season.
- Regularly analyze your own performance against these Shop seasonality benchmarks and adjust your pricing and availability strategy accordingly.
Best Areas for Airbnb Investment in Shop (2025)
Exploring the top neighborhoods for short-term rentals in Shop? This section highlights key areas, outlining why they are attractive for hosts and guests, along with notable local attractions. Consider these locations based on your target guest profile and investment strategy.
| Neighborhood / Area | Why Host Here? (Target Guests & Appeal) | Key Attractions & Landmarks |
|---|---|---|
| Sheffield City Centre | Vibrant urban area with universities, shopping, and entertainment. Appeals to students, professionals, and visitors seeking nightlife and cultural experiences. | Sheffield Winter Garden, Shudehill Market, The Peace Gardens, Odeon Cinema, The Crucible Theatre |
| Peak District National Park | Stunning natural landscape perfect for outdoor enthusiasts. Attracts nature lovers, hikers, and families looking for a peaceful retreat. | Mam Tor, Chatsworth House, Ladybower Reservoir, Bakewell, Eyam Village |
| Bramall Lane | Home of Sheffield United, this area caters to sports fans and those seeking local culture, with nearby shops and amenities. | Bramall Lane Stadium, Sheffield United FC, Nearby pubs and eateries, Local parks |
| Ecclesall Road | Popular for its lively atmosphere, boutique shops, and restaurants, making it an attractive spot for young professionals and families. | Ecclesall Road shops, Endcliffe Park, Pubs and restaurants, Sheffield Botanical Gardens |
| Kelham Island | Historic industrial area transformed into a trendy hotspot with bars, restaurants, and cultural sites. Appeals to young urbanites and foodies. | Kelham Island Museum, Craft breweries, Parks, Restaurants and cafes |
| Lower Don Valley | An up-and-coming area with industrial history, now focusing on regeneration and new developments, attracting investors. | Don Valley Stadium, Sheffield Arena, Parks and riverside walks |
| Brightside | A growing area close to the city with affordable housing options, appealing to budget travelers and families. | Local parks, Community centers, Transport links to the city |
| Attercliffe | An evolving neighborhood with close proximity to the city center and amenities, becoming popular with young families and professionals. | Centertainment leisure complex, Parks, Shops and eateries |
Understanding Airbnb License Requirements & STR Laws in Shop (2025)
While Shop, England, United Kingdom currently shows low STR regulations, specific Airbnb license requirements might still exist or change. Always verify the latest short term rental regulations and Airbnb license requirements directly with local government authorities for Shop to ensure full compliance before hosting.
(Source: AirROI data, 2025, finding no licensed listings among those analyzed)
Top Performing Airbnb Properties in Shop (2025)
Benchmark your potential! Explore examples of top-performing Airbnb properties in Shopbased on Trailing Twelve Month (TTM) revenue. Analyze their characteristics, revenue, occupancy rate, and ADR to understand what drives success in this market.
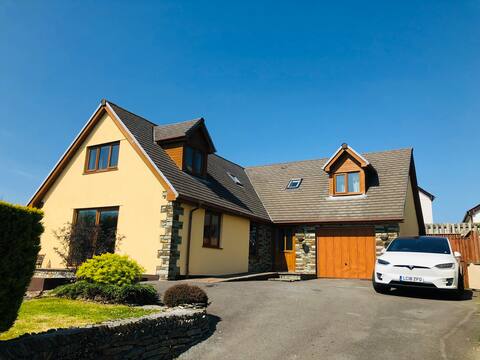
Crosslands House, Nr Bude, Cornwall
Entire Place • 5 bedrooms

'Bramble Cottage' bungalow with optional hot tub
Entire Place • 2 bedrooms

Magical Tabernacle In a Beautiful Setting Hot Tub
Entire Place • N/A
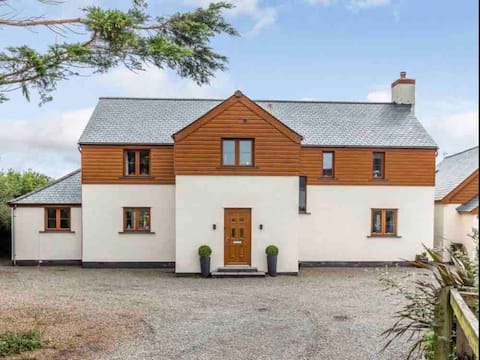
Spacious holiday home 3 miles from Duckpool Bay
Entire Place • 5 bedrooms
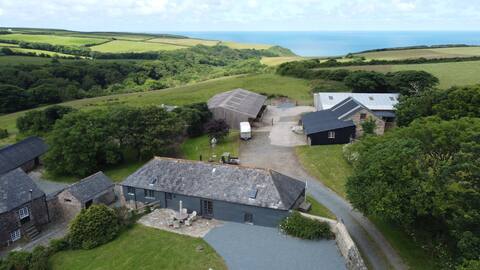
Marsland Manor
Entire Place • 7 bedrooms
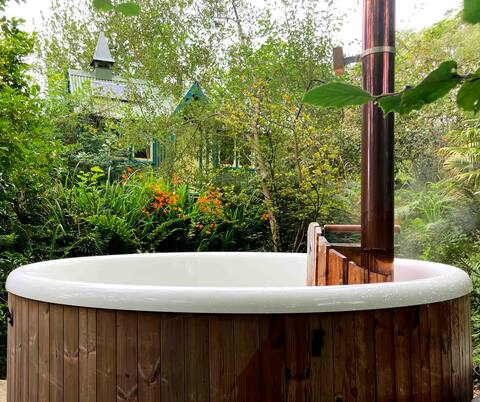
Enchanting Hand Painted Tabernacle with Hot Tub
Entire Place • 1 bedroom
Note: Performance varies based on location, size, amenities, seasonality, and management quality. Data reflects the past 12 months.
Top Performing Airbnb Hosts in Shop (2025)
Learn from the best! This table showcases top-performing Airbnb hosts in Shop based on the number of properties managed and estimated total revenue over the past year. Analyze their scale and performance metrics.
| Host Name | Properties | Grossing Revenue | Stay Reviews | Avg Rating |
|---|---|---|---|---|
| Helen | 4 | $104,064 | 471 | 4.97/5.0 |
| Nicola | 2 | $65,000 | 518 | 4.93/5.0 |
| Carley | 1 | $60,634 | 65 | 4.97/5.0 |
| Host #452991777 | 3 | $55,967 | 0 | 0.00/5.0 |
| Crispin And Sue | 2 | $39,321 | 495 | 4.98/5.0 |
| Paul | 1 | $34,792 | 71 | 4.79/5.0 |
| Laura | 1 | $26,981 | 48 | 4.98/5.0 |
| David | 1 | $20,635 | 55 | 4.91/5.0 |
| Host #97966133 | 1 | $7,652 | 0 | 0.00/5.0 |
| Host #140010779 | 1 | $7,518 | 0 | 0.00/5.0 |
Analyzing the strategies of top hosts, such as their property selection, pricing, and guest communication, can offer valuable lessons for optimizing your own Airbnb operations in Shop.
Dive Deeper: Advanced Shop STR Market Data (2025)
Ready to unlock more insights? AirROI provides access to advanced metrics and comprehensive Airbnb data for Shop. Explore detailed analytics beyond this report to refine your investment strategy, optimize pricing, and maximize your vacation rental profits.
Explore Advanced MetricsShop Short-Term Rental Market Composition (2025): Property & Room Types
Room Type Distribution
Property Type Distribution
Market Composition Insights for Shop
- The Shop Airbnb market composition is heavily skewed towards Entire Home/Apt listings, which make up 100% of the 17 active rentals. This indicates strong guest preference for privacy and space.
- Looking at the property type distribution in Shop, House properties are the most common (70.6%), reflecting the local real estate landscape.
- Houses represent a significant 70.6% portion, catering likely to families or larger groups.
Shop Airbnb Room Capacity Analysis (2025): Bedroom Distribution
Distribution of Listings by Number of Bedrooms
Room Capacity Insights for Shop
- The dominant room capacity in Shop is 1 bedroom listings, making up 29.4% of the market. This suggests a strong demand for properties suitable for couples or solo travelers.
- Together, 1 bedroom and 2 bedrooms properties represent 52.9% of the active Airbnb listings in Shop, indicating a high concentration in these sizes.
- A significant 41.1% of listings offer 3+ bedrooms, catering to larger groups and families seeking more space in Shop.
Shop Vacation Rental Guest Capacity Trends (2025)
Distribution of Listings by Guest Capacity
Guest Capacity Insights for Shop
- The most common guest capacity trend in Shop vacation rentals is listings accommodating 8+ guests (41.2%). This suggests the primary traveler segment is likely larger groups.
- Properties designed for 8+ guests and 2 guests dominate the Shop STR market, accounting for 70.6% of listings.
- 47.1% of properties accommodate 6+ guests, serving the market segment for larger families or group travel in Shop.
- On average, properties in Shop are equipped to host 5.2 guests.
Shop Airbnb Booking Patterns (2025): Available vs. Booked Days
Available Days Distribution
Booked Days Distribution
Booking Pattern Insights for Shop
- The most common availability pattern in Shop falls within the 181-270 days range, representing 35.3% of listings. This suggests many properties have significant open periods on their calendars.
- Approximately 70.6% of listings show high availability (181+ days open annually), indicating potential for increased bookings or specific owner usage patterns.
- For booked days, the 91-180 days range is most frequent in Shop (35.3%), reflecting common guest stay durations or potential owner blocking patterns.
- A notable 29.4% of properties secure long booking periods (181+ days booked per year), highlighting successful long-term rental strategies or significant owner usage.
Shop Airbnb Minimum Stay Requirements Analysis
Distribution of Listings by Minimum Night Requirement
2 Nights
3 listings
20% of total
3 Nights
3 listings
20% of total
4-6 Nights
3 listings
20% of total
30+ Nights
6 listings
40% of total
Key Insights
- The most prevalent minimum stay requirement in Shop is 30+ Nights, adopted by 40% of listings. This highlights the market's preference for longer commitments.
- A significant segment (40%) caters to monthly stays (30+ nights) in Shop, pointing to opportunities in the extended-stay market.
Recommendations
- Align with the market by considering a 30+ Nights minimum stay, as 40% of Shop hosts use this setting.
- Explore offering discounts for stays of 30+ nights to attract the 40% of the market seeking extended stays.
- Adjust minimum nights based on seasonality – potentially shorter during low season and longer during peak demand periods in Shop.
Shop Airbnb Cancellation Policy Trends Analysis (2025)
Moderate
2 listings
16.7% of total
Firm
1 listings
8.3% of total
Strict
9 listings
75% of total
Cancellation Policy Insights for Shop
- The prevailing Airbnb cancellation policy trend in Shop is Strict, used by 75% of listings.
- A majority (83.3%) of hosts in Shop utilize Firm or Strict policies, indicating a market where hosts prioritize booking security.
Recommendations for Hosts
- Consider adopting a Strict policy to align with the 75% market standard in Shop.
- With 75% using Strict terms, this is a viable option in Shop, particularly for high-value properties or during peak demand periods.
- Regularly review your cancellation policy against competitors and market demand shifts in Shop.
Shop STR Booking Lead Time Analysis (2025)
Average Booking Lead Time by Month
Booking Lead Time Insights for Shop
- The overall average booking lead time for vacation rentals in Shop is 82 days.
- Guests book furthest in advance for stays during January (average 117 days), likely coinciding with peak travel demand or local events.
- The shortest booking windows occur for stays in March (average 25 days), indicating more last-minute travel plans during this time.
- Seasonally, Winter (88 days avg.) sees the longest lead times, while Spring (53 days avg.) has the shortest, reflecting typical travel planning cycles.
Recommendations for Hosts
- Use the overall average lead time (82 days) as a baseline for your pricing and availability strategy in Shop.
- For January stays, consider implementing length-of-stay discounts or slightly higher rates for bookings made less than 117 days out to capitalize on advance planning.
- Target marketing efforts for the Winter season well in advance (at least 88 days) to capture early planners.
- Monitor your own booking lead times against these Shop averages to identify opportunities for dynamic pricing adjustments.
Popular & Essential Airbnb Amenities in Shop (2025)
Amenity Prevalence
Amenity Insights for Shop
- Essential amenities in Shop that guests expect include: Essentials, Kitchen, Free parking on premises, Carbon monoxide alarm, Refrigerator, Hot water, Smoke alarm. Lacking these (any) could significantly impact bookings.
- Popular amenities like Dishes and silverware, Heating, Backyard are common but not universal. Offering these can provide a competitive edge.
Recommendations for Hosts
- Ensure your listing includes all essential amenities for Shop: Essentials, Kitchen, Free parking on premises, Carbon monoxide alarm, Refrigerator, Hot water, Smoke alarm.
- Consider adding popular differentiators like Dishes and silverware or Heating to increase appeal.
- Highlight unique or less common amenities you offer (e.g., hot tub, dedicated workspace, EV charger) in your listing description and photos.
- Regularly check competitor amenities in Shop to stay competitive.
Shop Airbnb Guest Demographics & Profile Analysis (2025)
Guest Profile Summary for Shop
- The typical guest profile for Airbnb in Shop consists of primarily domestic travelers (97%), often arriving from nearby England, typically belonging to the Post-2000s (Gen Z/Alpha) group (50%), primarily speaking English or Spanish.
- Domestic travelers account for 97.4% of guests.
- Key international markets include United Kingdom (97.4%) and Germany (0.7%).
- Top languages spoken are English (80.6%) followed by Spanish (5.6%).
- A significant demographic segment is the Post-2000s (Gen Z/Alpha) group, representing 50% of guests.
Recommendations for Hosts
- Target domestic marketing efforts towards travelers from England and Plymouth.
- Tailor amenities and listing descriptions to appeal to the dominant Post-2000s (Gen Z/Alpha) demographic (e.g., highlight fast WiFi, smart home features, local guides).
- Highlight unique local experiences or amenities relevant to the primary guest profile.
- Consider seasonal promotions aligned with peak travel times for key origin markets.
Nearby Short-Term Rental Market Comparison
How does the Shop Airbnb market stack up against its neighbors? Compare key performance metrics like average monthly revenue, ADR, and occupancy rates in surrounding areas to understand the broader regional STR landscape.
| Market | Active Properties | Monthly Revenue | Daily Rate | Avg. Occupancy |
|---|---|---|---|---|
| Llanrhidian | 15 | $4,842 | $386.18 | 53% |
| Crai | 20 | $4,799 | $371.85 | 46% |
| Trenance | 19 | $4,795 | $428.63 | 43% |
| Angle | 13 | $4,602 | $384.81 | 42% |
| Ludchurch | 15 | $4,354 | $291.87 | 43% |
| Redberth | 29 | $4,103 | $223.37 | 59% |
| Higher Crackington | 17 | $3,731 | $340.74 | 37% |
| Milverton | 11 | $3,675 | $393.89 | 37% |
| Pennorth | 13 | $3,595 | $417.69 | 37% |
| Gilwern | 22 | $3,505 | $193.56 | 53% |