Sheffield Airbnb Market Analysis 2025: Short Term Rental Data & Vacation Rental Statistics in England, United Kingdom
Is Airbnb profitable in Sheffield in 2025? Explore comprehensive Airbnb analytics for Sheffield, England, United Kingdom to uncover income potential. This 2025 STR market report for Sheffield, based on AirROI data from April 2024 to March 2025, reveals key trends in the market of 872 active listings.
Whether you're considering an Airbnb investment in Sheffield, optimizing your existing vacation rental, or exploring rental arbitrage opportunities, understanding the Sheffield Airbnb data is crucial. Leveraging the low regulation environment is key to maximizing your short term rental income potential. Let's dive into the specifics.
Key Sheffield Airbnb Performance Metrics Overview
Monthly Airbnb Revenue Variations & Income Potential in Sheffield (2025)
Understanding the monthly revenue variations for Airbnb listings in Sheffield is key to maximizing your short term rental income potential. Seasonality significantly impacts earnings. Our analysis, based on data from the past 12 months, shows that the peak revenue month for STRs in Sheffield is typically May, while March often presents the lowest earnings, highlighting opportunities for strategic pricing adjustments during shoulder and low seasons. Explore the typical Airbnb income in Sheffield across different performance tiers:
- Best-in-class properties (Top 10%) achieve $3,984+ monthly, often utilizing dynamic pricing and superior guest experiences.
- Strong performing properties (Top 25%) earn $2,591 or more, indicating effective management and desirable locations/amenities.
- Typical properties (Median) generate around $1,409 per month, representing the average market performance.
- Entry-level properties (Bottom 25%) see earnings around $703, often with potential for optimization.
Average Monthly Airbnb Earnings Trend in Sheffield
Sheffield Airbnb Occupancy Rate Trends (2025)
Maximize your bookings by understanding the Sheffield STR occupancy trends. Seasonal demand shifts significantly influence how often properties are booked. Typically, Julysees the highest demand (peak season occupancy), while March experiences the lowest (low season). Effective strategies, like adjusting minimum stays or offering promotions, can boost occupancy during slower periods. Here's how different property tiers perform in Sheffield:
- Best-in-class properties (Top 10%) achieve 82%+ occupancy, indicating high desirability and potentially optimized availability.
- Strong performing properties (Top 25%) maintain 64% or higher occupancy, suggesting good market fit and guest satisfaction.
- Typical properties (Median) have an occupancy rate around 41%.
- Entry-level properties (Bottom 25%) average 21% occupancy, potentially facing higher vacancy.
Average Monthly Occupancy Rate Trend in Sheffield
Average Daily Rate (ADR) Airbnb Trends in Sheffield (2025)
Effective short term rental pricing strategy in Sheffield involves understanding monthly ADR fluctuations. The Average Daily Rate (ADR) for Airbnb in Sheffield typically peaks in July and dips lowest during March. Leveraging Airbnb dynamic pricing tools or strategies based on this seasonality can significantly boost revenue. Here's a look at the typical nightly rates achieved:
- Best-in-class properties (Top 10%) command rates of $349+ per night, often due to premium features or locations.
- Strong performing properties (Top 25%) achieve nightly rates of $175 or more.
- Typical properties (Median) charge around $118 per night.
- Entry-level properties (Bottom 25%) earn around $67 per night.
Average Daily Rate (ADR) Trend by Month in Sheffield
Get Live Sheffield Market Intelligence 👇

Explore Real-time Analytics
Airbnb Seasonality Analysis & Trends in Sheffield (2025)
Peak Season (May, July, June)
- Revenue averages $2,455 per month
- Occupancy rates average 47.2%
- Daily rates average $258
Shoulder Season
- Revenue averages $1,909 per month
- Occupancy maintains around 44.3%
- Daily rates hold near $219
Low Season (January, February, March)
- Revenue drops to average $1,429 per month
- Occupancy decreases to average 37.0%
- Daily rates adjust to average $135
Seasonality Insights for Sheffield
- The Airbnb seasonality in Sheffield shows moderate seasonality with distinct peak and low periods. While the sections above show seasonal averages, it's also insightful to look at the extremes:
- During the high season, the absolute peak month showcases Sheffield's highest earning potential, with monthly revenues capable of climbing to $2,508, occupancy reaching a high of 56.3%, and ADRs peaking at $261.
- Conversely, the slowest single month of the year, typically falling within the low season, marks the market's lowest point. In this month, revenue might dip to $1,386, occupancy could drop to 35.3%, and ADRs may adjust down to $134.
- Understanding both the seasonal averages and these monthly peaks and troughs in revenue, occupancy, and ADR is crucial for maximizing your Airbnb profit potential in Sheffield.
Seasonal Strategies for Maximizing Profit
- Peak Season: Maximize revenue through premium pricing and potentially longer minimum stays. Ensure high availability.
- Low Season: Offer competitive pricing, special promotions (e.g., extended stay discounts), and flexible cancellation policies. Target off-season travelers like remote workers or budget-conscious guests.
- Shoulder Seasons: Implement dynamic pricing that balances peak and low rates. Target weekend travelers or specific events. Offer slightly more flexible terms than peak season.
- Regularly analyze your own performance against these Sheffield seasonality benchmarks and adjust your pricing and availability strategy accordingly.
Best Areas for Airbnb Investment in Sheffield (2025)
Exploring the top neighborhoods for short-term rentals in Sheffield? This section highlights key areas, outlining why they are attractive for hosts and guests, along with notable local attractions. Consider these locations based on your target guest profile and investment strategy.
| Neighborhood / Area | Why Host Here? (Target Guests & Appeal) | Key Attractions & Landmarks |
|---|---|---|
| City Centre | The heart of Sheffield, offering a mix of shopping, dining, and entertainment. Ideal for guests wanting to explore the city's vibrant life and historical sites. | Sheffield Crucible Theatre, The Peace Gardens, Winter Garden, Sheffield City Hall, Millennium Gallery |
| Kelham Island | A rejuvenated industrial area known for its trendy bars, restaurants, and cultural heritage. Attracts young professionals and travelers looking for a unique local experience. | Kelham Island Museum, The Fat Cat Pub, The Isle of Skye, Peddler Market, Sheffield Industrial Museums Trust |
| Ecclesall Road | A bustling area with a vibrant dining scene and proximity to parks. Popular among students and young professionals, making it a great spot for short-term rentals. | Endcliffe Park, Sheffield Botanical Gardens, Cafes and restaurants, Sharrow Vale, Sheffield Hallam University |
| Broomhill | A residential area with a mix of culture and convenience, known for its independent shops and close proximity to the university. Ideal for guests visiting for academic purposes. | Royal Hallamshire Hospital, Sheffield University, Arts Tower, Broomhill market, Botanical Gardens |
| Brightside | An up-and-coming area with more affordable properties, attracting investors looking for growth potential. Proximity to the city centre makes it appealing. | The Don Valley, Sheaf Valley Park, A short distance to the city types of amenities |
| Sharrow | Known for its diverse community and strong sense of local culture. Attracts cultural travelers looking to explore Sheffield's local lifestyle. | Sharrow Vale Road, Pubs and cafes, Local Markets, Community events, Park Life |
| Nether Edge | A vibrant suburb filled with leafy streets and independent shops. Ideal for families and those wanting a quieter stay close to the city. | Nether Edge Park, Shops and cafes, Historic architecture, Cultural festivals, Local events |
| Crookes | A strong community feel with a mix of families and students. Offers great local amenities and beautiful views over the city, attracting a wide range of visitors. | Crookes Valley Park, Local restaurants, Close proximity to University, Natural views, Cultural events |
Understanding Airbnb License Requirements & STR Laws in Sheffield (2025)
While Sheffield, England, United Kingdom currently shows low STR regulations, specific Airbnb license requirements might still exist or change. Always verify the latest short term rental regulations and Airbnb license requirements directly with local government authorities for Sheffield to ensure full compliance before hosting.
(Source: AirROI data, 2025, based on 0% licensed listings)
Top Performing Airbnb Properties in Sheffield (2025)
Benchmark your potential! Explore examples of top-performing Airbnb properties in Sheffieldbased on Trailing Twelve Month (TTM) revenue. Analyze their characteristics, revenue, occupancy rate, and ADR to understand what drives success in this market.
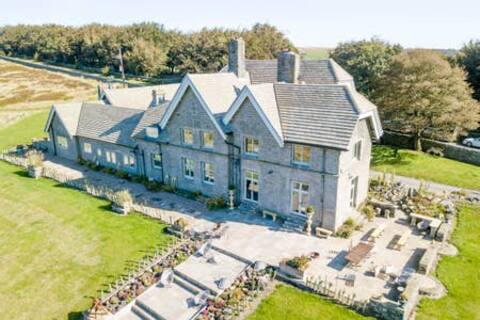
Moscar Lodge, Peak District
Entire Place • 10 bedrooms
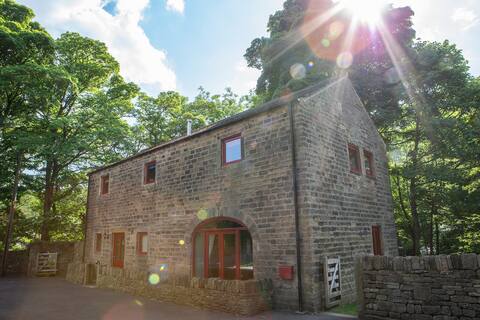
Unsliven Bridge Barn
Entire Place • 3 bedrooms
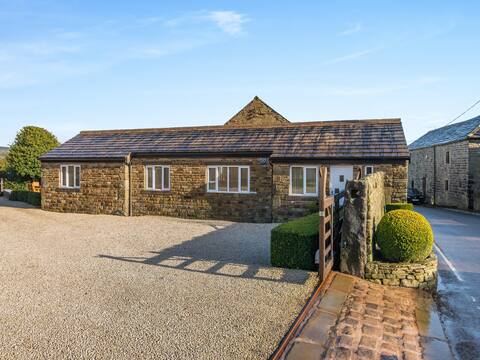
The Cottage
Entire Place • 3 bedrooms

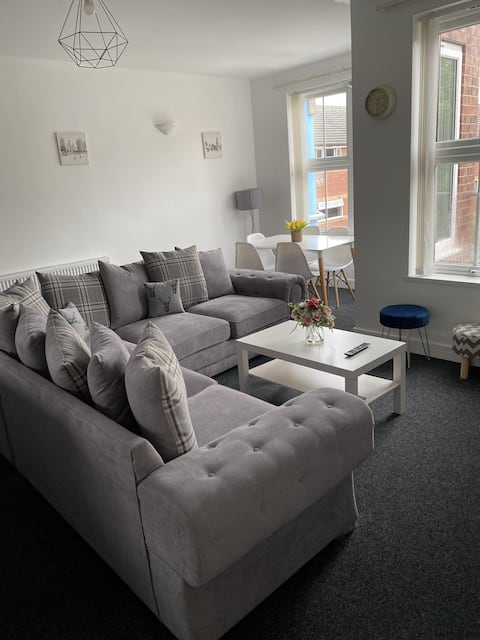
Outstanding 4 Bedroom Loft Apartment with Hot Tub
Entire Place • 4 bedrooms

Luxury Pad✔Inc Games Room✔Nr Town+Full3D Tour★★★★★
Entire Place • 6 bedrooms
8Bed & 9Bath Ensuite House w/ Hot Tub & Free Wi-Fi
Entire Place • 8 bedrooms
Note: Performance varies based on location, size, amenities, seasonality, and management quality. Data reflects the past 12 months.
Top Performing Airbnb Hosts in Sheffield (2025)
Learn from the best! This table showcases top-performing Airbnb hosts in Sheffield based on the number of properties managed and estimated total revenue over the past year. Analyze their scale and performance metrics.
| Host Name | Properties | Grossing Revenue | Stay Reviews | Avg Rating |
|---|---|---|---|---|
| David | 10 | $517,669 | 1350 | 4.80/5.0 |
| Luke | Stay Host Save | 17 | $416,098 | 271 | 4.58/5.0 |
| Andrew | 17 | $369,981 | 493 | 4.17/5.0 |
| Bethany | 11 | $366,230 | 498 | 4.81/5.0 |
| Rachel | 9 | $313,474 | 1554 | 4.64/5.0 |
| Avo | 27 | $299,793 | 1279 | 4.36/5.0 |
| Emma | 1 | $286,366 | 35 | 4.91/5.0 |
| DerBnB | 5 | $274,913 | 131 | 4.46/5.0 |
| Cottages | 3 | $210,151 | 29 | 4.93/5.0 |
| Joe | 12 | $198,758 | 237 | 4.47/5.0 |
Analyzing the strategies of top hosts, such as their property selection, pricing, and guest communication, can offer valuable lessons for optimizing your own Airbnb operations in Sheffield.
Dive Deeper: Advanced Sheffield STR Market Data (2025)
Ready to unlock more insights? AirROI provides access to advanced metrics and comprehensive Airbnb data for Sheffield. Explore detailed analytics beyond this report to refine your investment strategy, optimize pricing, and maximize your vacation rental profits.
Explore Advanced MetricsSheffield Short-Term Rental Market Composition (2025): Property & Room Types
Room Type Distribution
Property Type Distribution
Market Composition Insights for Sheffield
- The Sheffield Airbnb market composition is heavily skewed towards Entire Home/Apt listings, which make up 72.7% of the 872 active rentals. This indicates strong guest preference for privacy and space.
- Looking at the property type distribution in Sheffield, Apartment/Condo properties are the most common (48.3%), reflecting the local real estate landscape.
- Houses represent a significant 43.2% portion, catering likely to families or larger groups.
- Smaller segments like hotel/boutique, others, outdoor/unique, unique stays (combined 8.5%) offer potential for unique stay experiences.
Sheffield Airbnb Room Capacity Analysis (2025): Bedroom Distribution
Distribution of Listings by Number of Bedrooms
Room Capacity Insights for Sheffield
- The dominant room capacity in Sheffield is 1 bedroom listings, making up 39.2% of the market. This suggests a strong demand for properties suitable for couples or solo travelers.
- Together, 1 bedroom and 2 bedrooms properties represent 60.4% of the active Airbnb listings in Sheffield, indicating a high concentration in these sizes.
Sheffield Vacation Rental Guest Capacity Trends (2025)
Distribution of Listings by Guest Capacity
Guest Capacity Insights for Sheffield
- The most common guest capacity trend in Sheffield vacation rentals is listings accommodating 2 guests (29.6%). This suggests the primary traveler segment is likely couples or solo travelers.
- Properties designed for 2 guests and 4 guests dominate the Sheffield STR market, accounting for 46.3% of listings.
- 20.0% of properties accommodate 6+ guests, serving the market segment for larger families or group travel in Sheffield.
- On average, properties in Sheffield are equipped to host 3.2 guests.
Sheffield Airbnb Booking Patterns (2025): Available vs. Booked Days
Available Days Distribution
Booked Days Distribution
Booking Pattern Insights for Sheffield
- The most common availability pattern in Sheffield falls within the 271-366 days range, representing 34.7% of listings. This suggests many properties have significant open periods on their calendars.
- Approximately 68.9% of listings show high availability (181+ days open annually), indicating potential for increased bookings or specific owner usage patterns.
- For booked days, the 91-180 days range is most frequent in Sheffield (33.4%), reflecting common guest stay durations or potential owner blocking patterns.
- A notable 32.7% of properties secure long booking periods (181+ days booked per year), highlighting successful long-term rental strategies or significant owner usage.
Sheffield Airbnb Minimum Stay Requirements Analysis
Distribution of Listings by Minimum Night Requirement
1 Night
259 listings
33.9% of total
2 Nights
267 listings
34.9% of total
3 Nights
32 listings
4.2% of total
4-6 Nights
58 listings
7.6% of total
7-29 Nights
34 listings
4.4% of total
30+ Nights
115 listings
15% of total
Key Insights
- The most prevalent minimum stay requirement in Sheffield is 2 Nights, adopted by 34.9% of listings. This highlights the market's preference for shorter, flexible bookings.
- A strong majority (68.8%) of the Sheffield Airbnb data shows acceptance of very short stays (1-2 nights), indicating a dynamic, high-turnover market.
- A significant segment (15%) caters to monthly stays (30+ nights) in Sheffield, pointing to opportunities in the extended-stay market.
Recommendations
- Align with the market by considering a 2 Nights minimum stay, as 34.9% of Sheffield hosts use this setting.
- Explore offering discounts for stays of 30+ nights to attract the 15% of the market seeking extended stays.
- Adjust minimum nights based on seasonality – potentially shorter during low season and longer during peak demand periods in Sheffield.
Sheffield Airbnb Cancellation Policy Trends Analysis (2025)
Super Strict 30 Days
7 listings
1% of total
Super Strict 60 Days
10 listings
1.4% of total
Flexible
198 listings
26.9% of total
Moderate
292 listings
39.7% of total
Firm
115 listings
15.6% of total
Strict
113 listings
15.4% of total
Cancellation Policy Insights for Sheffield
- The prevailing Airbnb cancellation policy trend in Sheffield is Moderate, used by 39.7% of listings.
- There's a relatively balanced mix between guest-friendly (66.6%) and stricter (31.0%) policies, offering choices for different guest needs.
Recommendations for Hosts
- Consider adopting a Moderate policy to align with the 39.7% market standard in Sheffield.
- Regularly review your cancellation policy against competitors and market demand shifts in Sheffield.
Sheffield STR Booking Lead Time Analysis (2025)
Average Booking Lead Time by Month
Booking Lead Time Insights for Sheffield
- The overall average booking lead time for vacation rentals in Sheffield is 41 days.
- Guests book furthest in advance for stays during July (average 79 days), likely coinciding with peak travel demand or local events.
- The shortest booking windows occur for stays in March (average 32 days), indicating more last-minute travel plans during this time.
- Seasonally, Summer (60 days avg.) sees the longest lead times, while Winter (39 days avg.) has the shortest, reflecting typical travel planning cycles.
Recommendations for Hosts
- Use the overall average lead time (41 days) as a baseline for your pricing and availability strategy in Sheffield.
- For July stays, consider implementing length-of-stay discounts or slightly higher rates for bookings made less than 79 days out to capitalize on advance planning.
- Target marketing efforts for the Summer season well in advance (at least 60 days) to capture early planners.
- Monitor your own booking lead times against these Sheffield averages to identify opportunities for dynamic pricing adjustments.
Popular & Essential Airbnb Amenities in Sheffield (2025)
Amenity Prevalence
Amenity Insights for Sheffield
- Essential amenities in Sheffield that guests expect include: Wifi, Smoke alarm, Heating. Lacking these (any) could significantly impact bookings.
- Popular amenities like Kitchen, TV, Hot water are common but not universal. Offering these can provide a competitive edge.
Recommendations for Hosts
- Ensure your listing includes all essential amenities for Sheffield: Wifi, Smoke alarm, Heating.
- Prioritize adding missing essentials: Wifi, Smoke alarm, Heating.
- Consider adding popular differentiators like Kitchen or TV to increase appeal.
- Highlight unique or less common amenities you offer (e.g., hot tub, dedicated workspace, EV charger) in your listing description and photos.
- Regularly check competitor amenities in Sheffield to stay competitive.
Sheffield Airbnb Guest Demographics & Profile Analysis (2025)
Guest Profile Summary for Sheffield
- The typical guest profile for Airbnb in Sheffield consists of primarily domestic travelers (87%), often arriving from nearby England, typically belonging to the Post-2000s (Gen Z/Alpha) group (50%), primarily speaking English or French.
- Domestic travelers account for 86.8% of guests.
- Key international markets include United Kingdom (86.8%) and United States (2.6%).
- Top languages spoken are English (62.4%) followed by French (7.4%).
- A significant demographic segment is the Post-2000s (Gen Z/Alpha) group, representing 50% of guests.
Recommendations for Hosts
- Target domestic marketing efforts towards travelers from England and London.
- Tailor amenities and listing descriptions to appeal to the dominant Post-2000s (Gen Z/Alpha) demographic (e.g., highlight fast WiFi, smart home features, local guides).
- Highlight unique local experiences or amenities relevant to the primary guest profile.
- Consider seasonal promotions aligned with peak travel times for key origin markets.
Nearby Short-Term Rental Market Comparison
How does the Sheffield Airbnb market stack up against its neighbors? Compare key performance metrics like average monthly revenue, ADR, and occupancy rates in surrounding areas to understand the broader regional STR landscape.
| Market | Active Properties | Monthly Revenue | Daily Rate | Avg. Occupancy |
|---|---|---|---|---|
| Grinton | 14 | $5,456 | $365.05 | 51% |
| Cartmel Fell | 17 | $4,719 | $331.68 | 52% |
| Stamford Bridge | 11 | $4,669 | $410.14 | 38% |
| Casterton | 11 | $4,578 | $300.82 | 51% |
| Appleby | 10 | $4,577 | $332.39 | 44% |
| Cark | 11 | $4,540 | $885.21 | 31% |
| Flore | 10 | $4,534 | $347.03 | 40% |
| Craven Arms | 10 | $4,487 | $292.69 | 50% |
| Hayton | 13 | $4,333 | $239.53 | 60% |
| Watermillock | 16 | $4,281 | $274.03 | 50% |