Sebergham Airbnb Market Analysis 2025: Short Term Rental Data & Vacation Rental Statistics in England, United Kingdom
Is Airbnb profitable in Sebergham in 2025? Explore comprehensive Airbnb analytics for Sebergham, England, United Kingdom to uncover income potential. This 2025 STR market report for Sebergham, based on AirROI data from April 2024 to March 2025, reveals key trends in the niche market of 17 active listings.
Whether you're considering an Airbnb investment in Sebergham, optimizing your existing vacation rental, or exploring rental arbitrage opportunities, understanding the Sebergham Airbnb data is crucial. Leveraging the low regulation environment is key to maximizing your short term rental income potential. Let's dive into the specifics.
Key Sebergham Airbnb Performance Metrics Overview
Monthly Airbnb Revenue Variations & Income Potential in Sebergham (2025)
Understanding the monthly revenue variations for Airbnb listings in Sebergham is key to maximizing your short term rental income potential. Seasonality significantly impacts earnings. Our analysis, based on data from the past 12 months, shows that the peak revenue month for STRs in Sebergham is typically August, while March often presents the lowest earnings, highlighting opportunities for strategic pricing adjustments during shoulder and low seasons. Explore the typical Airbnb income in Sebergham across different performance tiers:
- Best-in-class properties (Top 10%) achieve $4,855+ monthly, often utilizing dynamic pricing and superior guest experiences.
- Strong performing properties (Top 25%) earn $3,136 or more, indicating effective management and desirable locations/amenities.
- Typical properties (Median) generate around $2,223 per month, representing the average market performance.
- Entry-level properties (Bottom 25%) see earnings around $1,600, often with potential for optimization.
Average Monthly Airbnb Earnings Trend in Sebergham
Sebergham Airbnb Occupancy Rate Trends (2025)
Maximize your bookings by understanding the Sebergham STR occupancy trends. Seasonal demand shifts significantly influence how often properties are booked. Typically, Augustsees the highest demand (peak season occupancy), while March experiences the lowest (low season). Effective strategies, like adjusting minimum stays or offering promotions, can boost occupancy during slower periods. Here's how different property tiers perform in Sebergham:
- Best-in-class properties (Top 10%) achieve 77%+ occupancy, indicating high desirability and potentially optimized availability.
- Strong performing properties (Top 25%) maintain 64% or higher occupancy, suggesting good market fit and guest satisfaction.
- Typical properties (Median) have an occupancy rate around 47%.
- Entry-level properties (Bottom 25%) average 27% occupancy, potentially facing higher vacancy.
Average Monthly Occupancy Rate Trend in Sebergham
Average Daily Rate (ADR) Airbnb Trends in Sebergham (2025)
Effective short term rental pricing strategy in Sebergham involves understanding monthly ADR fluctuations. The Average Daily Rate (ADR) for Airbnb in Sebergham typically peaks in February and dips lowest during September. Leveraging Airbnb dynamic pricing tools or strategies based on this seasonality can significantly boost revenue. Here's a look at the typical nightly rates achieved:
- Best-in-class properties (Top 10%) command rates of $246+ per night, often due to premium features or locations.
- Strong performing properties (Top 25%) achieve nightly rates of $209 or more.
- Typical properties (Median) charge around $132 per night.
- Entry-level properties (Bottom 25%) earn around $109 per night.
Average Daily Rate (ADR) Trend by Month in Sebergham
Get Live Sebergham Market Intelligence 👇

Explore Real-time Analytics
Airbnb Seasonality Analysis & Trends in Sebergham (2025)
Peak Season (August, July, May)
- Revenue averages $3,399 per month
- Occupancy rates average 61.3%
- Daily rates average $157
Shoulder Season
- Revenue averages $2,586 per month
- Occupancy maintains around 46.5%
- Daily rates hold near $159
Low Season (January, February, March)
- Revenue drops to average $1,750 per month
- Occupancy decreases to average 37.4%
- Daily rates adjust to average $165
Seasonality Insights for Sebergham
- The Airbnb seasonality in Sebergham shows highly seasonal trends requiring careful strategy. While the sections above show seasonal averages, it's also insightful to look at the extremes:
- During the high season, the absolute peak month showcases Sebergham's highest earning potential, with monthly revenues capable of climbing to $3,831, occupancy reaching a high of 73.4%, and ADRs peaking at $170.
- Conversely, the slowest single month of the year, typically falling within the low season, marks the market's lowest point. In this month, revenue might dip to $1,565, occupancy could drop to 31.5%, and ADRs may adjust down to $152.
- Understanding both the seasonal averages and these monthly peaks and troughs in revenue, occupancy, and ADR is crucial for maximizing your Airbnb profit potential in Sebergham.
Seasonal Strategies for Maximizing Profit
- Peak Season: Maximize revenue through premium pricing and potentially longer minimum stays. Ensure high availability.
- Low Season: Offer competitive pricing, special promotions (e.g., extended stay discounts), and flexible cancellation policies. Target off-season travelers like remote workers or budget-conscious guests.
- Shoulder Seasons: Implement dynamic pricing that balances peak and low rates. Target weekend travelers or specific events. Offer slightly more flexible terms than peak season.
- Regularly analyze your own performance against these Sebergham seasonality benchmarks and adjust your pricing and availability strategy accordingly.
Best Areas for Airbnb Investment in Sebergham (2025)
Exploring the top neighborhoods for short-term rentals in Sebergham? This section highlights key areas, outlining why they are attractive for hosts and guests, along with notable local attractions. Consider these locations based on your target guest profile and investment strategy.
| Neighborhood / Area | Why Host Here? (Target Guests & Appeal) | Key Attractions & Landmarks |
|---|---|---|
| Sebergham Village | A picturesque village close to the Lake District with charming landscapes, inviting country cottages and local hospitality. Ideal for guests looking for a peaceful retreat and exploring the countryside. | Lake District National Park, Bowness-on-Windermere, Hadrian's Wall, Carlisle Castle, Talkin Tarn, Aira Force Waterfall |
| Carlisle | A historic city with a vibrant atmosphere, offering a mix of heritage and modern attractions. It is popular among travelers for its regional significance and amenities. | Carlisle Cathedral, Tullie House Museum, Carlisle Castle, Shopping in the city center, Petra's Pit, St. Cuthbert's Church |
| Wigton | A charming market town close to Sebergham, offering a friendly community feel and access to local shops. Ideal for those wanting to experience small-town life while being near Lake District attractions. | Wigton Market Square, St. Mary’s Church, Wigton Railway Station, The Old Bank, Wigton Town Trail |
| Dalston | A quaint village with historical sites and strong local culture. It attracts visitors who want to explore the nearby countryside and engage with friendly locals. | Dalston Hall, St. Michael's Church, The Dalston Methodists, Nearby walking trails, Local pubs and tea rooms |
| Hesket Newmarket | A lovely village in the northern part of the Lake District, known for its scenic beauty, community-run pubs, and local craft shops. It provides an authentic Lake District experience. | The Watermill Inn, Hesket Newmarket Brewery, Walking trails in the area, A scenic bike route, The historic village church |
| Newcastle upon Tyne | A vibrant city known for its nightlife, cultural attractions, and the iconic Tyne Bridge. A major destination for short stays and business travelers alike. | The Quayside, Newcastle Castle, BALTIC Centre for Contemporary Art, St. Nicholas Cathedral, Shopping at Eldon Square |
| Greystoke | A tranquil village near Ullswater, perfect for guests who want to engage with nature and outdoor activities such as hiking and cycling in the Lake District. | Greystoke Castle, Ullswater Lake, Greystoke Cycle Centre, Nearby hiking trails, Local tea shops |
| Penrith | Close to the Lake District, this market town offers a range of shops, restaurants, and proximity to numerous outdoor activities, making it a great base for travelers. | Penrith Castle, Alhambra Cinema, Penrith Beacon, Cumbria Sausage Company, Nearby Lake Ullswater |
Understanding Airbnb License Requirements & STR Laws in Sebergham (2025)
While Sebergham, England, United Kingdom currently shows low STR regulations, specific Airbnb license requirements might still exist or change. Always verify the latest short term rental regulations and Airbnb license requirements directly with local government authorities for Sebergham to ensure full compliance before hosting.
(Source: AirROI data, 2025, finding no licensed listings among those analyzed)
Top Performing Airbnb Properties in Sebergham (2025)
Benchmark your potential! Explore examples of top-performing Airbnb properties in Seberghambased on Trailing Twelve Month (TTM) revenue. Analyze their characteristics, revenue, occupancy rate, and ADR to understand what drives success in this market.
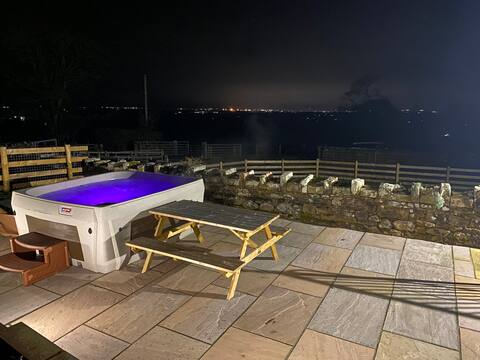
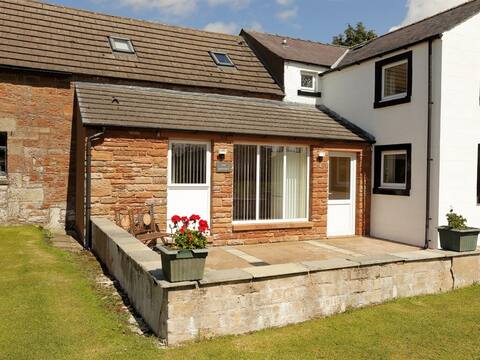
Rattlebeck Farm Cottage & Hot Tub *Pet Friendly*
Entire Place • 2 bedrooms
Countryside barn conversion w/optional hot tub
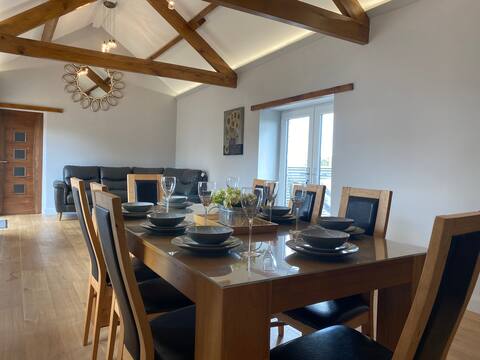
Entire Place • 4 bedrooms
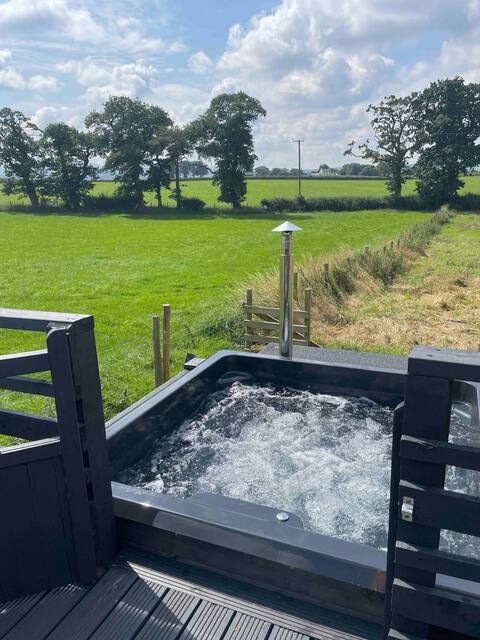
1.Moss end pods - pod 1 with hot tub
Entire Place • 1 bedroom
Cottage with private hot tub
Entire Place • 1 bedroom

Dalston Countryside 5-bed home w/optional hot tub.
Entire Place • 5 bedrooms

3. Moss end pods - pod 3
Entire Place • 1 bedroom
Note: Performance varies based on location, size, amenities, seasonality, and management quality. Data reflects the past 12 months.
Top Performing Airbnb Hosts in Sebergham (2025)
Learn from the best! This table showcases top-performing Airbnb hosts in Sebergham based on the number of properties managed and estimated total revenue over the past year. Analyze their scale and performance metrics.
| Host Name | Properties | Grossing Revenue | Stay Reviews | Avg Rating |
|---|---|---|---|---|
| Jade | 8 | $248,126 | 549 | 4.97/5.0 |
| Emily | 3 | $87,046 | 64 | 4.97/5.0 |
| Amy | 1 | $82,679 | 165 | 4.94/5.0 |
| Kathleen | 3 | $40,604 | 64 | 4.99/5.0 |
| Rob | 1 | $22,841 | 834 | 4.95/5.0 |
| David | 1 | $18,098 | 44 | 4.91/5.0 |
Analyzing the strategies of top hosts, such as their property selection, pricing, and guest communication, can offer valuable lessons for optimizing your own Airbnb operations in Sebergham.
Dive Deeper: Advanced Sebergham STR Market Data (2025)
Ready to unlock more insights? AirROI provides access to advanced metrics and comprehensive Airbnb data for Sebergham. Explore detailed analytics beyond this report to refine your investment strategy, optimize pricing, and maximize your vacation rental profits.
Explore Advanced MetricsSebergham Short-Term Rental Market Composition (2025): Property & Room Types
Room Type Distribution
Property Type Distribution
Market Composition Insights for Sebergham
- The Sebergham Airbnb market composition is heavily skewed towards Entire Home/Apt listings, which make up 88.2% of the 17 active rentals. This indicates strong guest preference for privacy and space.
- Looking at the property type distribution in Sebergham, House properties are the most common (64.7%), reflecting the local real estate landscape.
- Houses represent a significant 64.7% portion, catering likely to families or larger groups.
Sebergham Airbnb Room Capacity Analysis (2025): Bedroom Distribution
Distribution of Listings by Number of Bedrooms
Room Capacity Insights for Sebergham
- The dominant room capacity in Sebergham is 1 bedroom listings, making up 64.7% of the market. This suggests a strong demand for properties suitable for couples or solo travelers.
- Together, 1 bedroom and 3 bedrooms properties represent 76.5% of the active Airbnb listings in Sebergham, indicating a high concentration in these sizes.
- With over half the market (64.7%) consisting of studios or 1-bedroom units, Sebergham is particularly well-suited for individuals or couples.
- A significant 23.6% of listings offer 3+ bedrooms, catering to larger groups and families seeking more space in Sebergham.
Sebergham Vacation Rental Guest Capacity Trends (2025)
Distribution of Listings by Guest Capacity
Guest Capacity Insights for Sebergham
- The most common guest capacity trend in Sebergham vacation rentals is listings accommodating 4 guests (35.3%). This suggests the primary traveler segment is likely small families or groups.
- Properties designed for 4 guests and 2 guests dominate the Sebergham STR market, accounting for 70.6% of listings.
- 23.5% of properties accommodate 6+ guests, serving the market segment for larger families or group travel in Sebergham.
- On average, properties in Sebergham are equipped to host 3.9 guests.
Sebergham Airbnb Booking Patterns (2025): Available vs. Booked Days
Available Days Distribution
Booked Days Distribution
Booking Pattern Insights for Sebergham
- The most common availability pattern in Sebergham falls within the 91-180 days range, representing 41.2% of listings. This suggests many properties have significant open periods on their calendars.
- Approximately 47.0% of listings show high availability (181+ days open annually), indicating potential for increased bookings or specific owner usage patterns.
- For booked days, the 181-270 days range is most frequent in Sebergham (41.2%), reflecting common guest stay durations or potential owner blocking patterns.
- A notable 53.0% of properties secure long booking periods (181+ days booked per year), highlighting successful long-term rental strategies or significant owner usage.
Sebergham Airbnb Minimum Stay Requirements Analysis
Distribution of Listings by Minimum Night Requirement
1 Night
4 listings
23.5% of total
2 Nights
7 listings
41.2% of total
3 Nights
2 listings
11.8% of total
30+ Nights
4 listings
23.5% of total
Key Insights
- The most prevalent minimum stay requirement in Sebergham is 2 Nights, adopted by 41.2% of listings. This highlights the market's preference for shorter, flexible bookings.
- A strong majority (64.7%) of the Sebergham Airbnb data shows acceptance of very short stays (1-2 nights), indicating a dynamic, high-turnover market.
- A significant segment (23.5%) caters to monthly stays (30+ nights) in Sebergham, pointing to opportunities in the extended-stay market.
Recommendations
- Align with the market by considering a 2 Nights minimum stay, as 41.2% of Sebergham hosts use this setting.
- If feasible, allowing 1-night stays, especially midweek or during low season, could capture last-minute bookings, as only 23.5% currently do.
- Explore offering discounts for stays of 30+ nights to attract the 23.5% of the market seeking extended stays.
- Adjust minimum nights based on seasonality – potentially shorter during low season and longer during peak demand periods in Sebergham.
Sebergham Airbnb Cancellation Policy Trends Analysis (2025)
Non-refundable
1 listings
5.9% of total
Refundable
2 listings
11.8% of total
Flexible
1 listings
5.9% of total
Moderate
9 listings
52.9% of total
Firm
2 listings
11.8% of total
Strict
2 listings
11.8% of total
Cancellation Policy Insights for Sebergham
- The prevailing Airbnb cancellation policy trend in Sebergham is Moderate, used by 52.9% of listings.
- There's a relatively balanced mix between guest-friendly (58.8%) and stricter (23.6%) policies, offering choices for different guest needs.
Recommendations for Hosts
- Consider adopting a Moderate policy to align with the 52.9% market standard in Sebergham.
- Using a Strict policy might deter some guests, as only 11.8% of listings use it. Evaluate if potential revenue protection outweighs possible lower booking rates.
- Regularly review your cancellation policy against competitors and market demand shifts in Sebergham.
Sebergham STR Booking Lead Time Analysis (2025)
Average Booking Lead Time by Month
Booking Lead Time Insights for Sebergham
- The overall average booking lead time for vacation rentals in Sebergham is 80 days.
- Guests book furthest in advance for stays during August (average 135 days), likely coinciding with peak travel demand or local events.
- The shortest booking windows occur for stays in October (average 40 days), indicating more last-minute travel plans during this time.
- Seasonally, Summer (131 days avg.) sees the longest lead times, while Fall (57 days avg.) has the shortest, reflecting typical travel planning cycles.
Recommendations for Hosts
- Use the overall average lead time (80 days) as a baseline for your pricing and availability strategy in Sebergham.
- For August stays, consider implementing length-of-stay discounts or slightly higher rates for bookings made less than 135 days out to capitalize on advance planning.
- Target marketing efforts for the Summer season well in advance (at least 131 days) to capture early planners.
- Monitor your own booking lead times against these Sebergham averages to identify opportunities for dynamic pricing adjustments.
Popular & Essential Airbnb Amenities in Sebergham (2025)
Amenity Prevalence
Amenity Insights for Sebergham
- Essential amenities in Sebergham that guests expect include: TV, Refrigerator, Free parking on premises. Lacking these (any) could significantly impact bookings.
- Popular amenities like Kitchen, Bed linens, Smoke alarm are common but not universal. Offering these can provide a competitive edge.
Recommendations for Hosts
- Ensure your listing includes all essential amenities for Sebergham: TV, Refrigerator, Free parking on premises.
- Consider adding popular differentiators like Kitchen or Bed linens to increase appeal.
- Highlight unique or less common amenities you offer (e.g., hot tub, dedicated workspace, EV charger) in your listing description and photos.
- Regularly check competitor amenities in Sebergham to stay competitive.
Sebergham Airbnb Guest Demographics & Profile Analysis (2025)
Guest Profile Summary for Sebergham
- The typical guest profile for Airbnb in Sebergham consists of primarily domestic travelers (96%), often arriving from nearby England, typically belonging to the Post-2000s (Gen Z/Alpha) group (50%), primarily speaking English or French.
- Domestic travelers account for 95.8% of guests.
- Key international markets include United Kingdom (95.8%) and Australia (2.7%).
- Top languages spoken are English (78.6%) followed by French (3.3%).
- A significant demographic segment is the Post-2000s (Gen Z/Alpha) group, representing 50% of guests.
Recommendations for Hosts
- Target domestic marketing efforts towards travelers from England and Newcastle upon Tyne.
- Tailor amenities and listing descriptions to appeal to the dominant Post-2000s (Gen Z/Alpha) demographic (e.g., highlight fast WiFi, smart home features, local guides).
- Highlight unique local experiences or amenities relevant to the primary guest profile.
- Consider seasonal promotions aligned with peak travel times for key origin markets.
Nearby Short-Term Rental Market Comparison
How does the Sebergham Airbnb market stack up against its neighbors? Compare key performance metrics like average monthly revenue, ADR, and occupancy rates in surrounding areas to understand the broader regional STR landscape.
| Market | Active Properties | Monthly Revenue | Daily Rate | Avg. Occupancy |
|---|---|---|---|---|
| Galston | 11 | $7,951 | $676.77 | 46% |
| Gorebridge | 12 | $6,209 | $493.62 | 54% |
| Cartmel Fell | 17 | $4,719 | $331.68 | 52% |
| Casterton | 11 | $4,578 | $300.82 | 51% |
| Cark | 11 | $4,540 | $885.21 | 31% |
| City of Edinburgh | 4,312 | $4,528 | $274.67 | 61% |
| Eglwys-bach | 16 | $4,413 | $315.23 | 52% |
| Waverton | 16 | $4,358 | $444.20 | 33% |
| Watermillock | 16 | $4,281 | $274.03 | 50% |
| Kielder | 12 | $4,215 | $329.21 | 53% |