Seaham Airbnb Market Analysis 2025: Short Term Rental Data & Vacation Rental Statistics in England, United Kingdom
Is Airbnb profitable in Seaham in 2025? Explore comprehensive Airbnb analytics for Seaham, England, United Kingdom to uncover income potential. This 2025 STR market report for Seaham, based on AirROI data from April 2024 to March 2025, reveals key trends in the niche market of 24 active listings.
Whether you're considering an Airbnb investment in Seaham, optimizing your existing vacation rental, or exploring rental arbitrage opportunities, understanding the Seaham Airbnb data is crucial. Leveraging the low regulation environment is key to maximizing your short term rental income potential. Let's dive into the specifics.
Key Seaham Airbnb Performance Metrics Overview
Monthly Airbnb Revenue Variations & Income Potential in Seaham (2025)
Understanding the monthly revenue variations for Airbnb listings in Seaham is key to maximizing your short term rental income potential. Seasonality significantly impacts earnings. Our analysis, based on data from the past 12 months, shows that the peak revenue month for STRs in Seaham is typically August, while January often presents the lowest earnings, highlighting opportunities for strategic pricing adjustments during shoulder and low seasons. Explore the typical Airbnb income in Seaham across different performance tiers:
- Best-in-class properties (Top 10%) achieve $4,239+ monthly, often utilizing dynamic pricing and superior guest experiences.
- Strong performing properties (Top 25%) earn $3,180 or more, indicating effective management and desirable locations/amenities.
- Typical properties (Median) generate around $2,135 per month, representing the average market performance.
- Entry-level properties (Bottom 25%) see earnings around $1,296, often with potential for optimization.
Average Monthly Airbnb Earnings Trend in Seaham
Seaham Airbnb Occupancy Rate Trends (2025)
Maximize your bookings by understanding the Seaham STR occupancy trends. Seasonal demand shifts significantly influence how often properties are booked. Typically, Augustsees the highest demand (peak season occupancy), while January experiences the lowest (low season). Effective strategies, like adjusting minimum stays or offering promotions, can boost occupancy during slower periods. Here's how different property tiers perform in Seaham:
- Best-in-class properties (Top 10%) achieve 81%+ occupancy, indicating high desirability and potentially optimized availability.
- Strong performing properties (Top 25%) maintain 68% or higher occupancy, suggesting good market fit and guest satisfaction.
- Typical properties (Median) have an occupancy rate around 48%.
- Entry-level properties (Bottom 25%) average 30% occupancy, potentially facing higher vacancy.
Average Monthly Occupancy Rate Trend in Seaham
Average Daily Rate (ADR) Airbnb Trends in Seaham (2025)
Effective short term rental pricing strategy in Seaham involves understanding monthly ADR fluctuations. The Average Daily Rate (ADR) for Airbnb in Seaham typically peaks in April and dips lowest during March. Leveraging Airbnb dynamic pricing tools or strategies based on this seasonality can significantly boost revenue. Here's a look at the typical nightly rates achieved:
- Best-in-class properties (Top 10%) command rates of $216+ per night, often due to premium features or locations.
- Strong performing properties (Top 25%) achieve nightly rates of $158 or more.
- Typical properties (Median) charge around $129 per night.
- Entry-level properties (Bottom 25%) earn around $108 per night.
Average Daily Rate (ADR) Trend by Month in Seaham
Get Live Seaham Market Intelligence 👇

Explore Real-time Analytics
Airbnb Seasonality Analysis & Trends in Seaham (2025)
Peak Season (August, June, July)
- Revenue averages $3,284 per month
- Occupancy rates average 63.9%
- Daily rates average $193
Shoulder Season
- Revenue averages $2,500 per month
- Occupancy maintains around 50.7%
- Daily rates hold near $175
Low Season (January, February, March)
- Revenue drops to average $1,487 per month
- Occupancy decreases to average 35.7%
- Daily rates adjust to average $137
Seasonality Insights for Seaham
- The Airbnb seasonality in Seaham shows highly seasonal trends requiring careful strategy. While the sections above show seasonal averages, it's also insightful to look at the extremes:
- During the high season, the absolute peak month showcases Seaham's highest earning potential, with monthly revenues capable of climbing to $3,371, occupancy reaching a high of 74.2%, and ADRs peaking at $194.
- Conversely, the slowest single month of the year, typically falling within the low season, marks the market's lowest point. In this month, revenue might dip to $1,336, occupancy could drop to 31.9%, and ADRs may adjust down to $135.
- Understanding both the seasonal averages and these monthly peaks and troughs in revenue, occupancy, and ADR is crucial for maximizing your Airbnb profit potential in Seaham.
Seasonal Strategies for Maximizing Profit
- Peak Season: Maximize revenue through premium pricing and potentially longer minimum stays. Ensure high availability.
- Low Season: Offer competitive pricing, special promotions (e.g., extended stay discounts), and flexible cancellation policies. Target off-season travelers like remote workers or budget-conscious guests.
- Shoulder Seasons: Implement dynamic pricing that balances peak and low rates. Target weekend travelers or specific events. Offer slightly more flexible terms than peak season.
- Regularly analyze your own performance against these Seaham seasonality benchmarks and adjust your pricing and availability strategy accordingly.
Best Areas for Airbnb Investment in Seaham (2025)
Exploring the top neighborhoods for short-term rentals in Seaham? This section highlights key areas, outlining why they are attractive for hosts and guests, along with notable local attractions. Consider these locations based on your target guest profile and investment strategy.
| Neighborhood / Area | Why Host Here? (Target Guests & Appeal) | Key Attractions & Landmarks |
|---|---|---|
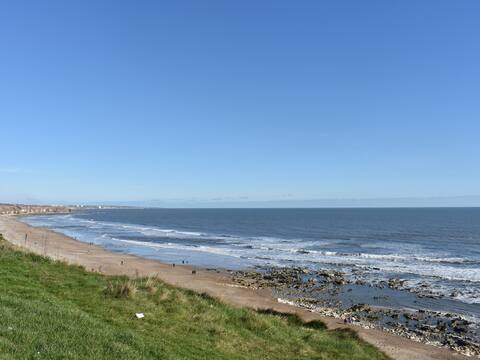
| Seaham Beach | A beautiful coastal area popular for its stunning beaches and scenic views. Great for tourists looking for relaxation and outdoor activities right by the sea. | Seaham Beach, Seaham Lighthouse, Blast Beach, East Durham Coast, St. Mary's Parish Church, Seaham Hall |
| Dalton-le-Dale | A charming village close to Seaham with a quaint atmosphere. Appeals to visitors wanting a quiet stay but close access to coastal attractions. | Dalton Park Outlet Shopping, St. Andrew's Church, Parks and nature walks, local pubs and eateries |
| East Shore Village | An up-and-coming residential and commercial area with new developments. Attractive for families and long-term visitors to the region. | Sunderland Marina, Riverside walks, local cafes and shops |
| Seaton Carew | A nearby coastal town known for its beach and recreational activities. Ideal for families and beach-goers during the summer. | Seaton Carew Beach, Seaton Carew Golf Club, Rockcliffe Hall Hotel, local amusement arcades |
| Whitburn | A historic village near Seaham that offers a glimpse into local history and a rich cultural experience. Great for tourists interested in heritage and local attractions. | Whitburn Coastal Park, St. Andrew's Church, Whitburn Village |
| Murton | A small town that is close to Seaham and offers quiet accommodations for those wishing to explore the surrounding areas and attractions. | Murton Park, local walking trails, community events |
| Horden | An industrial heritage village with easy access to the coast, attracting those interested in the history and culture of the Durham area. | Horden Welfare Park, local heritage sites, nearby coastline |
| Durham City | Not far from Seaham, Durham City offers a UNESCO World Heritage site and vibrant cultural experiences, making it a prime location for visitors. | Durham Cathedral, Durham Castle, Botanical Gardens, River Wear |
Understanding Airbnb License Requirements & STR Laws in Seaham (2025)
While Seaham, England, United Kingdom currently shows low STR regulations, specific Airbnb license requirements might still exist or change. Always verify the latest short term rental regulations and Airbnb license requirements directly with local government authorities for Seaham to ensure full compliance before hosting.
(Source: AirROI data, 2025, finding no licensed listings among those analyzed)
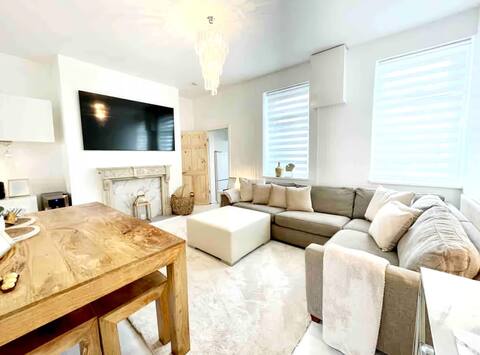
Top Performing Airbnb Properties in Seaham (2025)
Benchmark your potential! Explore examples of top-performing Airbnb properties in Seahambased on Trailing Twelve Month (TTM) revenue. Analyze their characteristics, revenue, occupancy rate, and ADR to understand what drives success in this market.

Sea Glass Cottage with Hot Tub
Entire Place • 3 bedrooms

Seaview Penthouse
Entire Place • 3 bedrooms
The Hawthorns
Entire Place • 3 bedrooms

Welcoming, bright, two bedroom seaside house.
Entire Place • 2 bedrooms
Coastal, Stylish 3 Bedroom Property, Sea Views
Entire Place • 3 bedrooms

Bright and airy, 3 bedroom, house at the beach.
Entire Place • 3 bedrooms
Note: Performance varies based on location, size, amenities, seasonality, and management quality. Data reflects the past 12 months.
Top Performing Airbnb Hosts in Seaham (2025)
Learn from the best! This table showcases top-performing Airbnb hosts in Seaham based on the number of properties managed and estimated total revenue over the past year. Analyze their scale and performance metrics.
| Host Name | Properties | Grossing Revenue | Stay Reviews | Avg Rating |
|---|---|---|---|---|
| Dave | 5 | $82,823 | 95 | 4.87/5.0 |
| Chrissie | 1 | $66,679 | 45 | 4.80/5.0 |
| Michael | 2 | $56,347 | 144 | 4.71/5.0 |
| Melanie | 1 | $55,543 | 21 | 5.00/5.0 |
| Dale | 3 | $49,588 | 45 | 4.08/5.0 |
| Cottages | 1 | $43,019 | 3 | 5.00/5.0 |
| Joanne | 1 | $40,982 | 82 | 4.95/5.0 |
| Steph | 1 | $36,627 | 152 | 4.97/5.0 |
| Elizabeth | 1 | $35,438 | 73 | 4.92/5.0 |
| Paul | 1 | $30,909 | 82 | 4.85/5.0 |
Analyzing the strategies of top hosts, such as their property selection, pricing, and guest communication, can offer valuable lessons for optimizing your own Airbnb operations in Seaham.
Dive Deeper: Advanced Seaham STR Market Data (2025)
Ready to unlock more insights? AirROI provides access to advanced metrics and comprehensive Airbnb data for Seaham. Explore detailed analytics beyond this report to refine your investment strategy, optimize pricing, and maximize your vacation rental profits.
Explore Advanced MetricsSeaham Short-Term Rental Market Composition (2025): Property & Room Types
Room Type Distribution
Property Type Distribution
Market Composition Insights for Seaham
- The Seaham Airbnb market composition is heavily skewed towards Entire Home/Apt listings, which make up 70.8% of the 24 active rentals. This indicates strong guest preference for privacy and space.
- Looking at the property type distribution in Seaham, Apartment/Condo properties are the most common (41.7%), reflecting the local real estate landscape.
- Houses represent a significant 41.7% portion, catering likely to families or larger groups.
- The presence of 16.7% Hotel/Boutique listings indicates integration with traditional hospitality.
Seaham Airbnb Room Capacity Analysis (2025): Bedroom Distribution
Distribution of Listings by Number of Bedrooms
Room Capacity Insights for Seaham
- The dominant room capacity in Seaham is 2 bedrooms listings, making up 37.5% of the market. This suggests a strong demand for properties suitable for couples or solo travelers.
- Together, 2 bedrooms and 1 bedroom properties represent 70.8% of the active Airbnb listings in Seaham, indicating a high concentration in these sizes.
- A significant 20.8% of listings offer 3+ bedrooms, catering to larger groups and families seeking more space in Seaham.
Seaham Vacation Rental Guest Capacity Trends (2025)
Distribution of Listings by Guest Capacity
Guest Capacity Insights for Seaham
- The most common guest capacity trend in Seaham vacation rentals is listings accommodating 4 guests (29.2%). This suggests the primary traveler segment is likely small families or groups.
- Properties designed for 4 guests and 2 guests dominate the Seaham STR market, accounting for 54.2% of listings.
- 25.0% of properties accommodate 6+ guests, serving the market segment for larger families or group travel in Seaham.
- On average, properties in Seaham are equipped to host 3.8 guests.
Seaham Airbnb Booking Patterns (2025): Available vs. Booked Days
Available Days Distribution
Booked Days Distribution
Booking Pattern Insights for Seaham
- The most common availability pattern in Seaham falls within the 91-180 days range, representing 41.7% of listings. This suggests many properties have significant open periods on their calendars.
- Approximately 41.6% of listings show high availability (181+ days open annually), indicating potential for increased bookings or specific owner usage patterns.
- For booked days, the 181-270 days range is most frequent in Seaham (41.7%), reflecting common guest stay durations or potential owner blocking patterns.
- A notable 58.4% of properties secure long booking periods (181+ days booked per year), highlighting successful long-term rental strategies or significant owner usage.
Seaham Airbnb Minimum Stay Requirements Analysis
Distribution of Listings by Minimum Night Requirement
1 Night
12 listings
52.2% of total
2 Nights
7 listings
30.4% of total
3 Nights
2 listings
8.7% of total
30+ Nights
2 listings
8.7% of total
Key Insights
- The most prevalent minimum stay requirement in Seaham is 1 Night, adopted by 52.2% of listings. This highlights the market's preference for shorter, flexible bookings.
- A strong majority (82.6%) of the Seaham Airbnb data shows acceptance of very short stays (1-2 nights), indicating a dynamic, high-turnover market.
Recommendations
- Align with the market by considering a 1 Night minimum stay, as 52.2% of Seaham hosts use this setting.
- Explore offering discounts for stays of 30+ nights to attract the 8.7% of the market seeking extended stays.
- Adjust minimum nights based on seasonality – potentially shorter during low season and longer during peak demand periods in Seaham.
Seaham Airbnb Cancellation Policy Trends Analysis (2025)
Super Strict 60 Days
1 listings
4.5% of total
Flexible
5 listings
22.7% of total
Moderate
4 listings
18.2% of total
Firm
5 listings
22.7% of total
Strict
7 listings
31.8% of total
Cancellation Policy Insights for Seaham
- The prevailing Airbnb cancellation policy trend in Seaham is Strict, used by 31.8% of listings.
- A majority (54.5%) of hosts in Seaham utilize Firm or Strict policies, indicating a market where hosts prioritize booking security.
Recommendations for Hosts
- Consider adopting a Strict policy to align with the 31.8% market standard in Seaham.
- With 31.8% using Strict terms, this is a viable option in Seaham, particularly for high-value properties or during peak demand periods.
- Regularly review your cancellation policy against competitors and market demand shifts in Seaham.
Seaham STR Booking Lead Time Analysis (2025)
Average Booking Lead Time by Month
Booking Lead Time Insights for Seaham
- The overall average booking lead time for vacation rentals in Seaham is 41 days.
- Guests book furthest in advance for stays during June (average 103 days), likely coinciding with peak travel demand or local events.
- The shortest booking windows occur for stays in January (average 26 days), indicating more last-minute travel plans during this time.
- Seasonally, Summer (85 days avg.) sees the longest lead times, while Winter (33 days avg.) has the shortest, reflecting typical travel planning cycles.
Recommendations for Hosts
- Use the overall average lead time (41 days) as a baseline for your pricing and availability strategy in Seaham.
- For June stays, consider implementing length-of-stay discounts or slightly higher rates for bookings made less than 103 days out to capitalize on advance planning.
- Target marketing efforts for the Summer season well in advance (at least 85 days) to capture early planners.
- Monitor your own booking lead times against these Seaham averages to identify opportunities for dynamic pricing adjustments.
Popular & Essential Airbnb Amenities in Seaham (2025)
Amenity Prevalence
Amenity Insights for Seaham
- Essential amenities in Seaham that guests expect include: Wifi, TV, Essentials. Lacking these (any) could significantly impact bookings.
- Popular amenities like Bed linens, Iron, Smoke alarm are common but not universal. Offering these can provide a competitive edge.
Recommendations for Hosts
- Ensure your listing includes all essential amenities for Seaham: Wifi, TV, Essentials.
- Prioritize adding missing essentials: TV, Essentials.
- Consider adding popular differentiators like Bed linens or Iron to increase appeal.
- Highlight unique or less common amenities you offer (e.g., hot tub, dedicated workspace, EV charger) in your listing description and photos.
- Regularly check competitor amenities in Seaham to stay competitive.
Seaham Airbnb Guest Demographics & Profile Analysis (2025)
Guest Profile Summary for Seaham
- The typical guest profile for Airbnb in Seaham consists of primarily domestic travelers (82%), often arriving from nearby England, typically belonging to the Post-2000s (Gen Z/Alpha) group (50%), primarily speaking English or Spanish.
- Domestic travelers account for 81.5% of guests.
- Key international markets include United Kingdom (81.5%) and United States (7.7%).
- Top languages spoken are English (71.3%) followed by Spanish (6.3%).
- A significant demographic segment is the Post-2000s (Gen Z/Alpha) group, representing 50% of guests.
Recommendations for Hosts
- Target domestic marketing efforts towards travelers from England and London.
- Tailor amenities and listing descriptions to appeal to the dominant Post-2000s (Gen Z/Alpha) demographic (e.g., highlight fast WiFi, smart home features, local guides).
- Highlight unique local experiences or amenities relevant to the primary guest profile.
- Consider seasonal promotions aligned with peak travel times for key origin markets.
Nearby Short-Term Rental Market Comparison
How does the Seaham Airbnb market stack up against its neighbors? Compare key performance metrics like average monthly revenue, ADR, and occupancy rates in surrounding areas to understand the broader regional STR landscape.
| Market | Active Properties | Monthly Revenue | Daily Rate | Avg. Occupancy |
|---|---|---|---|---|
| Grinton | 14 | $5,456 | $365.05 | 51% |
| Cartmel Fell | 17 | $4,719 | $331.68 | 52% |
| Stamford Bridge | 11 | $4,669 | $410.14 | 38% |
| Casterton | 11 | $4,578 | $300.82 | 51% |
| Appleby | 10 | $4,577 | $332.39 | 44% |
| Cark | 11 | $4,540 | $885.21 | 31% |
| Hayton | 13 | $4,333 | $239.53 | 60% |
| Watermillock | 16 | $4,281 | $274.03 | 50% |
| Kielder | 12 | $4,215 | $329.21 | 53% |
| Pooley Bridge | 13 | $4,145 | $317.26 | 52% |