Sandwell Airbnb Market Analysis 2025: Short Term Rental Data & Vacation Rental Statistics in England, United Kingdom
Is Airbnb profitable in Sandwell in 2025? Explore comprehensive Airbnb analytics for Sandwell, England, United Kingdom to uncover income potential. This 2025 STR market report for Sandwell, based on AirROI data from April 2024 to March 2025, reveals key trends in the niche market of 187 active listings.
Whether you're considering an Airbnb investment in Sandwell, optimizing your existing vacation rental, or exploring rental arbitrage opportunities, understanding the Sandwell Airbnb data is crucial. Leveraging the low regulation environment is key to maximizing your short term rental income potential. Let's dive into the specifics.
Key Sandwell Airbnb Performance Metrics Overview
Monthly Airbnb Revenue Variations & Income Potential in Sandwell (2025)
Understanding the monthly revenue variations for Airbnb listings in Sandwell is key to maximizing your short term rental income potential. Seasonality significantly impacts earnings. Our analysis, based on data from the past 12 months, shows that the peak revenue month for STRs in Sandwell is typically June, while January often presents the lowest earnings, highlighting opportunities for strategic pricing adjustments during shoulder and low seasons. Explore the typical Airbnb income in Sandwell across different performance tiers:
- Best-in-class properties (Top 10%) achieve $3,125+ monthly, often utilizing dynamic pricing and superior guest experiences.
- Strong performing properties (Top 25%) earn $1,996 or more, indicating effective management and desirable locations/amenities.
- Typical properties (Median) generate around $1,018 per month, representing the average market performance.
- Entry-level properties (Bottom 25%) see earnings around $384, often with potential for optimization.
Average Monthly Airbnb Earnings Trend in Sandwell
Sandwell Airbnb Occupancy Rate Trends (2025)
Maximize your bookings by understanding the Sandwell STR occupancy trends. Seasonal demand shifts significantly influence how often properties are booked. Typically, Septembersees the highest demand (peak season occupancy), while January experiences the lowest (low season). Effective strategies, like adjusting minimum stays or offering promotions, can boost occupancy during slower periods. Here's how different property tiers perform in Sandwell:
- Best-in-class properties (Top 10%) achieve 78%+ occupancy, indicating high desirability and potentially optimized availability.
- Strong performing properties (Top 25%) maintain 56% or higher occupancy, suggesting good market fit and guest satisfaction.
- Typical properties (Median) have an occupancy rate around 31%.
- Entry-level properties (Bottom 25%) average 14% occupancy, potentially facing higher vacancy.
Average Monthly Occupancy Rate Trend in Sandwell
Average Daily Rate (ADR) Airbnb Trends in Sandwell (2025)
Effective short term rental pricing strategy in Sandwell involves understanding monthly ADR fluctuations. The Average Daily Rate (ADR) for Airbnb in Sandwell typically peaks in July and dips lowest during February. Leveraging Airbnb dynamic pricing tools or strategies based on this seasonality can significantly boost revenue. Here's a look at the typical nightly rates achieved:
- Best-in-class properties (Top 10%) command rates of $217+ per night, often due to premium features or locations.
- Strong performing properties (Top 25%) achieve nightly rates of $149 or more.
- Typical properties (Median) charge around $87 per night.
- Entry-level properties (Bottom 25%) earn around $46 per night.
Average Daily Rate (ADR) Trend by Month in Sandwell
Get Live Sandwell Market Intelligence 👇

Explore Real-time Analytics
Airbnb Seasonality Analysis & Trends in Sandwell (2025)
Peak Season (June, May, April)
- Revenue averages $1,866 per month
- Occupancy rates average 34.4%
- Daily rates average $124
Shoulder Season
- Revenue averages $1,343 per month
- Occupancy maintains around 40.4%
- Daily rates hold near $122
Low Season (January, February, March)
- Revenue drops to average $1,019 per month
- Occupancy decreases to average 33.0%
- Daily rates adjust to average $115
Seasonality Insights for Sandwell
- The Airbnb seasonality in Sandwell shows moderate seasonality with distinct peak and low periods. While the sections above show seasonal averages, it's also insightful to look at the extremes:
- During the high season, the absolute peak month showcases Sandwell's highest earning potential, with monthly revenues capable of climbing to $1,871, occupancy reaching a high of 43.3%, and ADRs peaking at $125.
- Conversely, the slowest single month of the year, typically falling within the low season, marks the market's lowest point. In this month, revenue might dip to $978, occupancy could drop to 31.3%, and ADRs may adjust down to $115.
- Understanding both the seasonal averages and these monthly peaks and troughs in revenue, occupancy, and ADR is crucial for maximizing your Airbnb profit potential in Sandwell.
Seasonal Strategies for Maximizing Profit
- Peak Season: Maximize revenue through premium pricing and potentially longer minimum stays. Ensure high availability.
- Low Season: Offer competitive pricing, special promotions (e.g., extended stay discounts), and flexible cancellation policies. Target off-season travelers like remote workers or budget-conscious guests.
- Shoulder Seasons: Implement dynamic pricing that balances peak and low rates. Target weekend travelers or specific events. Offer slightly more flexible terms than peak season.
- Regularly analyze your own performance against these Sandwell seasonality benchmarks and adjust your pricing and availability strategy accordingly.
Best Areas for Airbnb Investment in Sandwell (2025)
Exploring the top neighborhoods for short-term rentals in Sandwell? This section highlights key areas, outlining why they are attractive for hosts and guests, along with notable local attractions. Consider these locations based on your target guest profile and investment strategy.
| Neighborhood / Area | Why Host Here? (Target Guests & Appeal) | Key Attractions & Landmarks |
|---|---|---|
| West Bromwich | A vibrant town with a rich industrial heritage, West Bromwich is seeing growth in tourism and business travel. It’s close to attractions and offers easy access to Birmingham. | Sandwell Valley Country Park, West Bromwich Albion FC, The Oak House Museum, The Public Art Gallery, New Square Shopping Centre, Birmingham City Centre |
| Smethwick | Smethwick offers a mix of residential and commercial areas, making it a draw for visitors looking to explore the Black Country and Birmingham. It’s well connected and offers great local amenities. | Smethwick Galton Bridge, Warley Woods, The Sundridge Golf Club, The Bearwood High Street, Theython Heath Nature Reserve, Birmingham Canal Navigation |
| Rowley Regis | Rowley Regis is a picturesque area with a blend of nature and suburban living, attracting families and businesses alike. It’s perfect for those looking to enjoy more rural charms close to urban conveniences. | Sandwell Valley, Rowley Regis Golf Club, Haden Hill House, The Black Country Living Museum, The Smethwick Hall, Wollaston and Stourbridge |
| Oldbury | Oldbury is a key transport area with good access to the M5 and nearby attractions. It appeals to both business travelers and leisure visitors seeking local experiences and shopping. | Oldbury Town Centre, The Wow Centre, The Oldbury Cemetery, Sandwell Park Farm, The Dartmouth Park, Birmingham's local attractions |
| Tipton | Tipton has historical significance and a growing community, making it an interesting spot for visitors. It features local parks and canals which are attractive for walks and scenic views. | Tipton Green, The Black Country Living Museum, Parks and recreation areas, Dudley Canal Trust, The Tipton Cemetery, Local industrial heritage |
| Wednesbury | Wednesbury is known for its shopping and local culture, providing a central location for visitors to explore the West Midlands. Its history and community events draw various tourists. | Wednesbury Museum and Art Gallery, The Wednesbury Oak, Local markets, The Park Inn, Wednesbury Town Hall, Shopping centres and outlets |
| Brierley Hill | Brierley Hill is strengthening as a commercial hub and destination with attractions such as Merry Hill shopping centre, making it a prime location for short-term rentals. | Merry Hill Shopping Centre, The Waterfront, Brierley Hill Civic Hall, St. Michael's Church, Canalside walks, Local eateries and pubs |
| Sandwell Valley | An area rich in natural beauty and outdoor activities, Sandwell Valley serves as a haven for nature enthusiasts and family activities, enhancing its appeal for short-term stays. | Sandwell Valley Country Park, Haden Hill Park, The Black Country Living Museum, The Sandwell Park Farm, Nature trails and bike paths, Picnic areas and wildlife |
Understanding Airbnb License Requirements & STR Laws in Sandwell (2025)
While Sandwell, England, United Kingdom currently shows low STR regulations, specific Airbnb license requirements might still exist or change. Always verify the latest short term rental regulations and Airbnb license requirements directly with local government authorities for Sandwell to ensure full compliance before hosting.
(Source: AirROI data, 2025, finding no licensed listings among those analyzed)
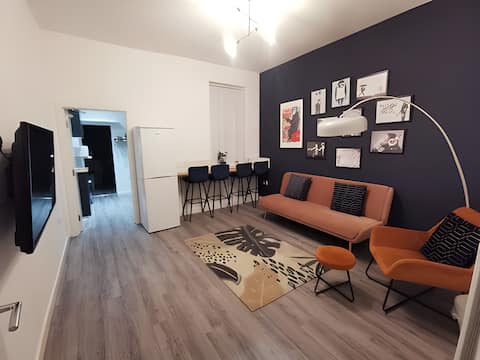
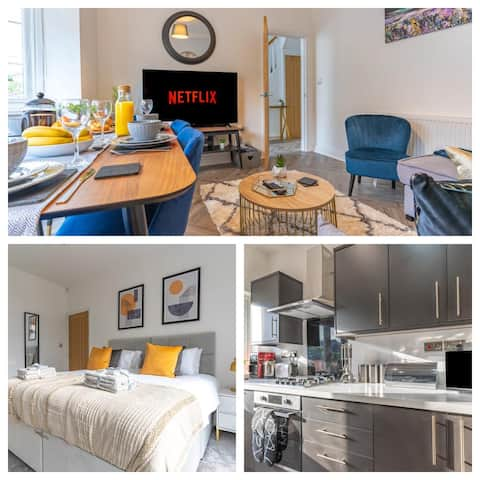
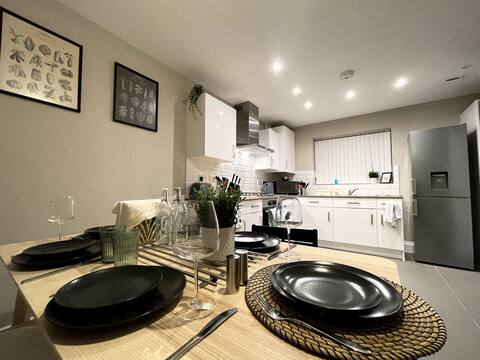
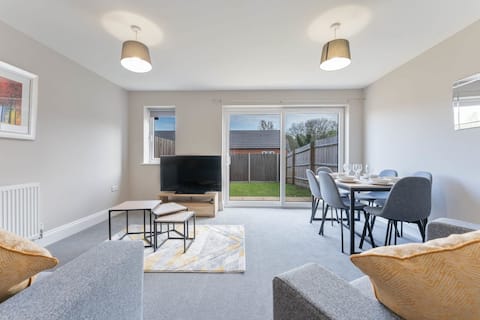
Top Performing Airbnb Properties in Sandwell (2025)
Benchmark your potential! Explore examples of top-performing Airbnb properties in Sandwellbased on Trailing Twelve Month (TTM) revenue. Analyze their characteristics, revenue, occupancy rate, and ADR to understand what drives success in this market.
High-speed Wi-Fi | 6 Ensuite | Dedicated Workspace
Entire Place • 7 bedrooms
Family Home close to Birmingham City Centre
Entire Place • 4 bedrooms
Brand New sleeps 7, BEST IN Birmingham
Entire Place • 3 bedrooms
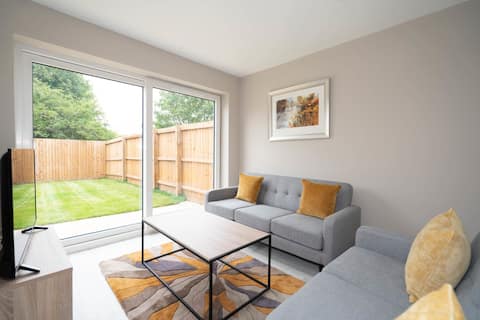
Spacious 3 Bedroom House with Garden in Birmingham
Entire Place • 3 bedrooms
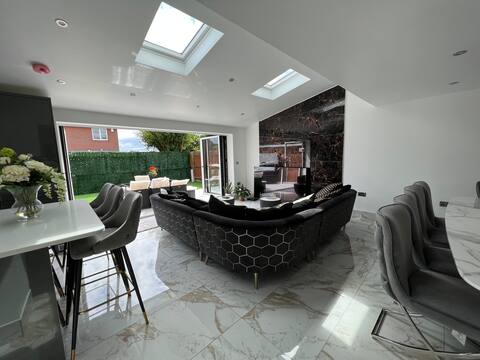
Luxury 4 bedroom family home, hot tub and parking
Entire Place • 4 bedrooms
Fantastic 3BR House in Birmingham With Garden
Entire Place • 3 bedrooms
Note: Performance varies based on location, size, amenities, seasonality, and management quality. Data reflects the past 12 months.
Top Performing Airbnb Hosts in Sandwell (2025)
Learn from the best! This table showcases top-performing Airbnb hosts in Sandwell based on the number of properties managed and estimated total revenue over the past year. Analyze their scale and performance metrics.
| Host Name | Properties | Grossing Revenue | Stay Reviews | Avg Rating |
|---|---|---|---|---|
| Mohammed | 12 | $104,229 | 94 | 3.40/5.0 |
| Helen & Ally | 2 | $81,429 | 58 | 4.12/5.0 |
| Martin | 4 | $61,167 | 104 | 4.77/5.0 |
| Wahida | 4 | $58,608 | 73 | 3.66/5.0 |
| David | 1 | $53,862 | 33 | 4.67/5.0 |
| Raquel | 9 | $53,309 | 27 | 2.98/5.0 |
| Steve | 1 | $49,893 | 14 | 4.64/5.0 |
| Brimstone | 1 | $47,974 | 58 | 4.81/5.0 |
| James | 4 | $47,209 | 289 | 4.71/5.0 |
| Ash | 1 | $40,861 | 34 | 4.97/5.0 |
Analyzing the strategies of top hosts, such as their property selection, pricing, and guest communication, can offer valuable lessons for optimizing your own Airbnb operations in Sandwell.
Dive Deeper: Advanced Sandwell STR Market Data (2025)
Ready to unlock more insights? AirROI provides access to advanced metrics and comprehensive Airbnb data for Sandwell. Explore detailed analytics beyond this report to refine your investment strategy, optimize pricing, and maximize your vacation rental profits.
Explore Advanced MetricsSandwell Short-Term Rental Market Composition (2025): Property & Room Types
Room Type Distribution
Property Type Distribution
Market Composition Insights for Sandwell
- The Sandwell Airbnb market composition is heavily skewed towards Entire Home/Apt listings, which make up 64.2% of the 187 active rentals. This indicates strong guest preference for privacy and space.
- However, a notable 35.3% share for Private Rooms suggests opportunities for budget-conscious travelers or hosts renting out spare rooms.
- Looking at the property type distribution in Sandwell, House properties are the most common (61.5%), reflecting the local real estate landscape.
- Houses represent a significant 61.5% portion, catering likely to families or larger groups.
- Smaller segments like hotel/boutique, others (combined 2.6%) offer potential for unique stay experiences.
Sandwell Airbnb Room Capacity Analysis (2025): Bedroom Distribution
Distribution of Listings by Number of Bedrooms
Room Capacity Insights for Sandwell
- The dominant room capacity in Sandwell is 1 bedroom listings, making up 37.4% of the market. This suggests a strong demand for properties suitable for couples or solo travelers.
- Together, 1 bedroom and 2 bedrooms properties represent 57.2% of the active Airbnb listings in Sandwell, indicating a high concentration in these sizes.
- A significant 23.5% of listings offer 3+ bedrooms, catering to larger groups and families seeking more space in Sandwell.
Sandwell Vacation Rental Guest Capacity Trends (2025)
Distribution of Listings by Guest Capacity
Guest Capacity Insights for Sandwell
- The most common guest capacity trend in Sandwell vacation rentals is listings accommodating 2 guests (18.2%). This suggests the primary traveler segment is likely couples or solo travelers.
- Properties designed for 2 guests and 4 guests dominate the Sandwell STR market, accounting for 35.8% of listings.
- 21.5% of properties accommodate 6+ guests, serving the market segment for larger families or group travel in Sandwell.
- On average, properties in Sandwell are equipped to host 3.3 guests.
Sandwell Airbnb Booking Patterns (2025): Available vs. Booked Days
Available Days Distribution
Booked Days Distribution
Booking Pattern Insights for Sandwell
- The most common availability pattern in Sandwell falls within the 271-366 days range, representing 59.9% of listings. This suggests many properties have significant open periods on their calendars.
- Approximately 84.5% of listings show high availability (181+ days open annually), indicating potential for increased bookings or specific owner usage patterns.
- For booked days, the 31-90 days range is most frequent in Sandwell (31.6%), reflecting common guest stay durations or potential owner blocking patterns.
- A notable 16.6% of properties secure long booking periods (181+ days booked per year), highlighting successful long-term rental strategies or significant owner usage.
Sandwell Airbnb Minimum Stay Requirements Analysis
Distribution of Listings by Minimum Night Requirement
1 Night
65 listings
38.7% of total
2 Nights
39 listings
23.2% of total
3 Nights
19 listings
11.3% of total
4-6 Nights
29 listings
17.3% of total
7-29 Nights
9 listings
5.4% of total
30+ Nights
7 listings
4.2% of total
Key Insights
- The most prevalent minimum stay requirement in Sandwell is 1 Night, adopted by 38.7% of listings. This highlights the market's preference for shorter, flexible bookings.
- A strong majority (61.9%) of the Sandwell Airbnb data shows acceptance of very short stays (1-2 nights), indicating a dynamic, high-turnover market.
Recommendations
- Align with the market by considering a 1 Night minimum stay, as 38.7% of Sandwell hosts use this setting.
- Adjust minimum nights based on seasonality – potentially shorter during low season and longer during peak demand periods in Sandwell.
Sandwell Airbnb Cancellation Policy Trends Analysis (2025)
Super Strict 30 Days
1 listings
0.8% of total
Flexible
55 listings
42.6% of total
Moderate
29 listings
22.5% of total
Firm
22 listings
17.1% of total
Strict
22 listings
17.1% of total
Cancellation Policy Insights for Sandwell
- The prevailing Airbnb cancellation policy trend in Sandwell is Flexible, used by 42.6% of listings.
- There's a relatively balanced mix between guest-friendly (65.1%) and stricter (34.2%) policies, offering choices for different guest needs.
Recommendations for Hosts
- Consider adopting a Flexible policy to align with the 42.6% market standard in Sandwell.
- Regularly review your cancellation policy against competitors and market demand shifts in Sandwell.
Sandwell STR Booking Lead Time Analysis (2025)
Average Booking Lead Time by Month
Booking Lead Time Insights for Sandwell
- The overall average booking lead time for vacation rentals in Sandwell is 28 days.
- Guests book furthest in advance for stays during May (average 53 days), likely coinciding with peak travel demand or local events.
- The shortest booking windows occur for stays in February (average 20 days), indicating more last-minute travel plans during this time.
- Seasonally, Summer (40 days avg.) sees the longest lead times, while Winter (26 days avg.) has the shortest, reflecting typical travel planning cycles.
Recommendations for Hosts
- Use the overall average lead time (28 days) as a baseline for your pricing and availability strategy in Sandwell.
- For May stays, consider implementing length-of-stay discounts or slightly higher rates for bookings made less than 53 days out to capitalize on advance planning.
- Target marketing efforts for the Summer season well in advance (at least 40 days) to capture early planners.
- Monitor your own booking lead times against these Sandwell averages to identify opportunities for dynamic pricing adjustments.
Popular & Essential Airbnb Amenities in Sandwell (2025)
Amenity Prevalence
Amenity Insights for Sandwell
- Essential amenities in Sandwell that guests expect include: Wifi, Smoke alarm, Heating. Lacking these (any) could significantly impact bookings.
- Popular amenities like Kitchen, Washer, TV are common but not universal. Offering these can provide a competitive edge.
Recommendations for Hosts
- Ensure your listing includes all essential amenities for Sandwell: Wifi, Smoke alarm, Heating.
- Prioritize adding missing essentials: Wifi, Smoke alarm, Heating.
- Consider adding popular differentiators like Kitchen or Washer to increase appeal.
- Highlight unique or less common amenities you offer (e.g., hot tub, dedicated workspace, EV charger) in your listing description and photos.
- Regularly check competitor amenities in Sandwell to stay competitive.
Sandwell Airbnb Guest Demographics & Profile Analysis (2025)
Guest Profile Summary for Sandwell
- The typical guest profile for Airbnb in Sandwell consists of primarily domestic travelers (87%), often arriving from nearby England, typically belonging to the Post-2000s (Gen Z/Alpha) group (50%), primarily speaking English or Spanish.
- Domestic travelers account for 87.3% of guests.
- Key international markets include United Kingdom (87.3%) and Germany (1.4%).
- Top languages spoken are English (62.4%) followed by Spanish (5.3%).
- A significant demographic segment is the Post-2000s (Gen Z/Alpha) group, representing 50% of guests.
Recommendations for Hosts
- Target domestic marketing efforts towards travelers from England and London.
- Tailor amenities and listing descriptions to appeal to the dominant Post-2000s (Gen Z/Alpha) demographic (e.g., highlight fast WiFi, smart home features, local guides).
- Highlight unique local experiences or amenities relevant to the primary guest profile.
- Consider seasonal promotions aligned with peak travel times for key origin markets.
Nearby Short-Term Rental Market Comparison
How does the Sandwell Airbnb market stack up against its neighbors? Compare key performance metrics like average monthly revenue, ADR, and occupancy rates in surrounding areas to understand the broader regional STR landscape.
| Market | Active Properties | Monthly Revenue | Daily Rate | Avg. Occupancy |
|---|---|---|---|---|
| Englishcombe | 13 | $8,558 | $573.69 | 49% |
| Dorney | 12 | $8,335 | $622.48 | 45% |
| Chew Magna | 14 | $6,649 | $399.59 | 46% |
| Lambourn | 11 | $6,081 | $669.47 | 28% |
| City of Westminster | 1,327 | $6,043 | $486.66 | 52% |
| Long Sutton | 17 | $5,726 | $383.88 | 46% |
| Stoke St. Michael | 10 | $5,277 | $424.04 | 42% |
| Oldland Common | 13 | $5,093 | $355.47 | 43% |
| Wraysbury | 14 | $4,719 | $396.18 | 46% |
| Stamford Bridge | 11 | $4,669 | $410.14 | 38% |