Saltford Airbnb Market Analysis 2025: Short Term Rental Data & Vacation Rental Statistics in England, United Kingdom
Is Airbnb profitable in Saltford in 2025? Explore comprehensive Airbnb analytics for Saltford, England, United Kingdom to uncover income potential. This 2025 STR market report for Saltford, based on AirROI data from April 2024 to March 2025, reveals key trends in the niche market of 27 active listings.
Whether you're considering an Airbnb investment in Saltford, optimizing your existing vacation rental, or exploring rental arbitrage opportunities, understanding the Saltford Airbnb data is crucial. Leveraging the low regulation environment is key to maximizing your short term rental income potential. Let's dive into the specifics.
Key Saltford Airbnb Performance Metrics Overview
Monthly Airbnb Revenue Variations & Income Potential in Saltford (2025)
Understanding the monthly revenue variations for Airbnb listings in Saltford is key to maximizing your short term rental income potential. Seasonality significantly impacts earnings. Our analysis, based on data from the past 12 months, shows that the peak revenue month for STRs in Saltford is typically July, while January often presents the lowest earnings, highlighting opportunities for strategic pricing adjustments during shoulder and low seasons. Explore the typical Airbnb income in Saltford across different performance tiers:
- Best-in-class properties (Top 10%) achieve $9,624+ monthly, often utilizing dynamic pricing and superior guest experiences.
- Strong performing properties (Top 25%) earn $4,600 or more, indicating effective management and desirable locations/amenities.
- Typical properties (Median) generate around $2,710 per month, representing the average market performance.
- Entry-level properties (Bottom 25%) see earnings around $1,719, often with potential for optimization.
Average Monthly Airbnb Earnings Trend in Saltford
Saltford Airbnb Occupancy Rate Trends (2025)
Maximize your bookings by understanding the Saltford STR occupancy trends. Seasonal demand shifts significantly influence how often properties are booked. Typically, Julysees the highest demand (peak season occupancy), while March experiences the lowest (low season). Effective strategies, like adjusting minimum stays or offering promotions, can boost occupancy during slower periods. Here's how different property tiers perform in Saltford:
- Best-in-class properties (Top 10%) achieve 80%+ occupancy, indicating high desirability and potentially optimized availability.
- Strong performing properties (Top 25%) maintain 62% or higher occupancy, suggesting good market fit and guest satisfaction.
- Typical properties (Median) have an occupancy rate around 42%.
- Entry-level properties (Bottom 25%) average 28% occupancy, potentially facing higher vacancy.
Average Monthly Occupancy Rate Trend in Saltford
Average Daily Rate (ADR) Airbnb Trends in Saltford (2025)
Effective short term rental pricing strategy in Saltford involves understanding monthly ADR fluctuations. The Average Daily Rate (ADR) for Airbnb in Saltford typically peaks in August and dips lowest during March. Leveraging Airbnb dynamic pricing tools or strategies based on this seasonality can significantly boost revenue. Here's a look at the typical nightly rates achieved:
- Best-in-class properties (Top 10%) command rates of $1,027+ per night, often due to premium features or locations.
- Strong performing properties (Top 25%) achieve nightly rates of $368 or more.
- Typical properties (Median) charge around $227 per night.
- Entry-level properties (Bottom 25%) earn around $132 per night.
Average Daily Rate (ADR) Trend by Month in Saltford
Get Live Saltford Market Intelligence 👇

Explore Real-time Analytics
Airbnb Seasonality Analysis & Trends in Saltford (2025)
Peak Season (July, August, May)
- Revenue averages $6,134 per month
- Occupancy rates average 52.4%
- Daily rates average $353
Shoulder Season
- Revenue averages $4,246 per month
- Occupancy maintains around 44.1%
- Daily rates hold near $333
Low Season (January, March, November)
- Revenue drops to average $2,976 per month
- Occupancy decreases to average 41.5%
- Daily rates adjust to average $321
Seasonality Insights for Saltford
- The Airbnb seasonality in Saltford shows highly seasonal trends requiring careful strategy. While the sections above show seasonal averages, it's also insightful to look at the extremes:
- During the high season, the absolute peak month showcases Saltford's highest earning potential, with monthly revenues capable of climbing to $6,375, occupancy reaching a high of 54.8%, and ADRs peaking at $361.
- Conversely, the slowest single month of the year, typically falling within the low season, marks the market's lowest point. In this month, revenue might dip to $2,755, occupancy could drop to 39.1%, and ADRs may adjust down to $313.
- Understanding both the seasonal averages and these monthly peaks and troughs in revenue, occupancy, and ADR is crucial for maximizing your Airbnb profit potential in Saltford.
Seasonal Strategies for Maximizing Profit
- Peak Season: Maximize revenue through premium pricing and potentially longer minimum stays. Ensure high availability.
- Low Season: Offer competitive pricing, special promotions (e.g., extended stay discounts), and flexible cancellation policies. Target off-season travelers like remote workers or budget-conscious guests.
- Shoulder Seasons: Implement dynamic pricing that balances peak and low rates. Target weekend travelers or specific events. Offer slightly more flexible terms than peak season.
- Regularly analyze your own performance against these Saltford seasonality benchmarks and adjust your pricing and availability strategy accordingly.
Best Areas for Airbnb Investment in Saltford (2025)
Exploring the top neighborhoods for short-term rentals in Saltford? This section highlights key areas, outlining why they are attractive for hosts and guests, along with notable local attractions. Consider these locations based on your target guest profile and investment strategy.
| Neighborhood / Area | Why Host Here? (Target Guests & Appeal) | Key Attractions & Landmarks |
|---|---|---|
| Saltford Village | Charming village atmosphere with historical charm and a close-knit community. Attracts visitors looking for a peaceful getaway with local amenities and scenic beauty. | All Saints Church, The Saltford Brass Mill, The Avon Valley, Saltford Sports Club |
| Bristol Temple Meads | Major transport hub and gateway to Bristol, attracting business travelers and tourists alike. Ideal for short-term stays with easy access to the city and surrounding areas. | Bristol Temple Meads Station, Explore Bristol's waterfront, Cabot Circus shopping area, Bristol Old Vic |
| Keynsham | Nearby town with historical significance and vibrant shopping options. Benefits from proximity to both Bristol and Bath, appealing to families and tourists. | Keynsham Memorial Park, The River Chew, Keynsham Abbey, Local restaurants and cafés |
| Bath | Famous for its Roman Baths and Georgian architecture, Bath is a UNESCO World Heritage site and a major tourist destination, making it a prime location for Airbnb. | The Roman Baths, Bath Abbey, Royal Crescent, Thermae Bath Spa |
| Claverton | Beautiful countryside location with access to hiking trails and rural attractions. Perfect for guests looking to escape the city and enjoy nature. | Claverton Pumping Station, Bath Skyline Walk, The American Museum in Britain |
| Pensford | Scenic village near the river, ideal for outdoor activities and exploration. Attractive for guests looking for tranquility and nature. | Pensford Viaduct, The River Chew, Walks along the countryside |
| Saltford Marina | Waterfront location with options for boating and scenic views. Attractive to guests wanting a unique experience close to nature. | Saltford Marina, The River Avon, Outdoor water activities |
| Long Ashton | Green suburban area close to Bristol, offering a mix of urban and rural experiences. Ideal for families and those wanting access to city life with a quieter home base. | Long Ashton Park, The Ashton Court Estate, Local pubs and eateries |
Understanding Airbnb License Requirements & STR Laws in Saltford (2025)
While Saltford, England, United Kingdom currently shows low STR regulations, specific Airbnb license requirements might still exist or change. Always verify the latest short term rental regulations and Airbnb license requirements directly with local government authorities for Saltford to ensure full compliance before hosting.
(Source: AirROI data, 2025, finding no licensed listings among those analyzed)
Top Performing Airbnb Properties in Saltford (2025)
Benchmark your potential! Explore examples of top-performing Airbnb properties in Saltfordbased on Trailing Twelve Month (TTM) revenue. Analyze their characteristics, revenue, occupancy rate, and ADR to understand what drives success in this market.

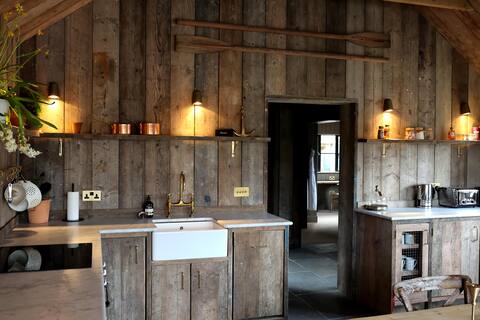
Fabulous Family House 5*location & 5*accommodation
Entire Place • 5 bedrooms

Love Island Mansion, Hot Tub, Sauna, Games, bar 24
Entire Place • 8 bedrooms
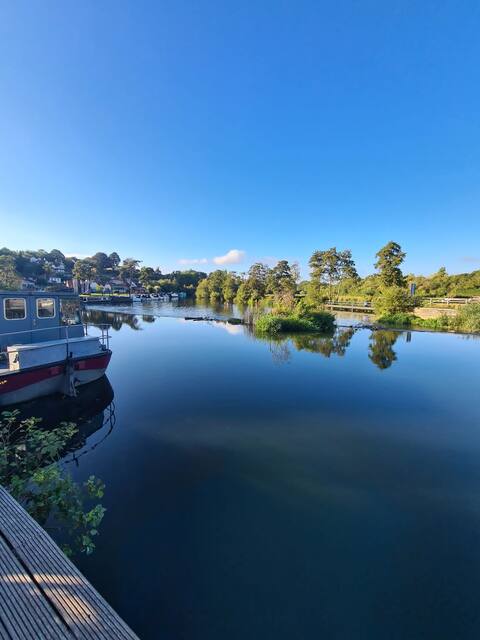
Christmas Cabin - River View 10 mins from Bath
Entire Place • 2 bedrooms
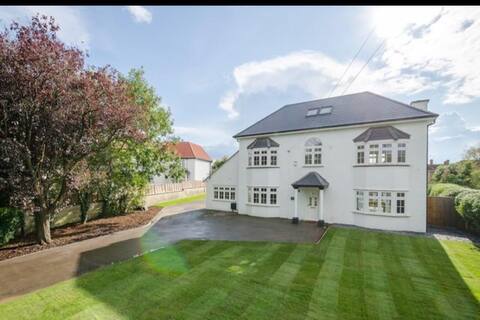
Home in Saltford with Hot Tub and Sauna.
Entire Place • 4 bedrooms
River fronted, Mill Cottage
Entire Place • 2 bedrooms
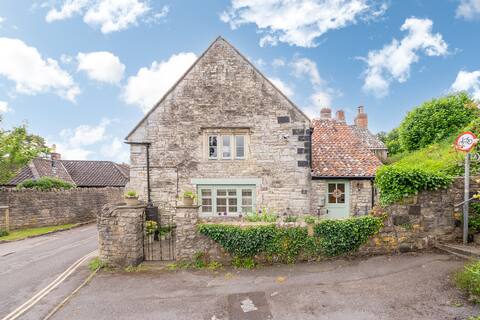
Cosy cottage on the outskirts of Bath
Entire Place • 2 bedrooms
Note: Performance varies based on location, size, amenities, seasonality, and management quality. Data reflects the past 12 months.
Top Performing Airbnb Hosts in Saltford (2025)
Learn from the best! This table showcases top-performing Airbnb hosts in Saltford based on the number of properties managed and estimated total revenue over the past year. Analyze their scale and performance metrics.
| Host Name | Properties | Grossing Revenue | Stay Reviews | Avg Rating |
|---|---|---|---|---|
| Serena | 7 | $210,767 | 1363 | 4.97/5.0 |
| Liz | 1 | $210,384 | 23 | 5.00/5.0 |
| Jordan | 3 | $187,417 | 552 | 4.98/5.0 |
| Geoffrey | 1 | $173,874 | 130 | 4.94/5.0 |
| Mostufa | 1 | $88,198 | 16 | 4.94/5.0 |
| Mandy | 2 | $81,273 | 177 | 4.86/5.0 |
| Nick & Claire | 2 | $72,895 | 62 | 4.92/5.0 |
| Imogen And Dan | 1 | $48,508 | 23 | 5.00/5.0 |
| Linda | 1 | $33,527 | 321 | 4.97/5.0 |
| Vicki | 1 | $22,688 | 64 | 4.92/5.0 |
Analyzing the strategies of top hosts, such as their property selection, pricing, and guest communication, can offer valuable lessons for optimizing your own Airbnb operations in Saltford.
Dive Deeper: Advanced Saltford STR Market Data (2025)
Ready to unlock more insights? AirROI provides access to advanced metrics and comprehensive Airbnb data for Saltford. Explore detailed analytics beyond this report to refine your investment strategy, optimize pricing, and maximize your vacation rental profits.
Explore Advanced MetricsSaltford Short-Term Rental Market Composition (2025): Property & Room Types
Room Type Distribution
Property Type Distribution
Market Composition Insights for Saltford
- The Saltford Airbnb market composition is heavily skewed towards Entire Home/Apt listings, which make up 92.6% of the 27 active rentals. This indicates strong guest preference for privacy and space.
- Looking at the property type distribution in Saltford, House properties are the most common (74.1%), reflecting the local real estate landscape.
- Houses represent a significant 74.1% portion, catering likely to families or larger groups.
- The presence of 7.4% Hotel/Boutique listings indicates integration with traditional hospitality.
- Smaller segments like others, unique stays, apartment/condo (combined 11.1%) offer potential for unique stay experiences.
Saltford Airbnb Room Capacity Analysis (2025): Bedroom Distribution
Distribution of Listings by Number of Bedrooms
Room Capacity Insights for Saltford
- The dominant room capacity in Saltford is 1 bedroom listings, making up 48.1% of the market. This suggests a strong demand for properties suitable for couples or solo travelers.
- Together, 1 bedroom and 2 bedrooms properties represent 74.0% of the active Airbnb listings in Saltford, indicating a high concentration in these sizes.
Saltford Vacation Rental Guest Capacity Trends (2025)
Distribution of Listings by Guest Capacity
Guest Capacity Insights for Saltford
- The most common guest capacity trend in Saltford vacation rentals is listings accommodating 2 guests (48.1%). This suggests the primary traveler segment is likely couples or solo travelers.
- Properties designed for 2 guests and 4 guests dominate the Saltford STR market, accounting for 66.6% of listings.
- A significant 48.1% of listings cater specifically to 1-2 guests, highlighting strong demand from couples and solo travelers in Saltford.
- 18.5% of properties accommodate 6+ guests, serving the market segment for larger families or group travel in Saltford.
- On average, properties in Saltford are equipped to host 3.0 guests.
Saltford Airbnb Booking Patterns (2025): Available vs. Booked Days
Available Days Distribution
Booked Days Distribution
Booking Pattern Insights for Saltford
- The most common availability pattern in Saltford falls within the 181-270 days range, representing 63% of listings. This suggests many properties have significant open periods on their calendars.
- Approximately 74.1% of listings show high availability (181+ days open annually), indicating potential for increased bookings or specific owner usage patterns.
- For booked days, the 91-180 days range is most frequent in Saltford (59.3%), reflecting common guest stay durations or potential owner blocking patterns.
- A notable 29.6% of properties secure long booking periods (181+ days booked per year), highlighting successful long-term rental strategies or significant owner usage.
Saltford Airbnb Minimum Stay Requirements Analysis
Distribution of Listings by Minimum Night Requirement
1 Night
8 listings
33.3% of total
2 Nights
9 listings
37.5% of total
30+ Nights
7 listings
29.2% of total
Key Insights
- The most prevalent minimum stay requirement in Saltford is 2 Nights, adopted by 37.5% of listings. This highlights the market's preference for shorter, flexible bookings.
- A strong majority (70.8%) of the Saltford Airbnb data shows acceptance of very short stays (1-2 nights), indicating a dynamic, high-turnover market.
- A significant segment (29.2%) caters to monthly stays (30+ nights) in Saltford, pointing to opportunities in the extended-stay market.
Recommendations
- Align with the market by considering a 2 Nights minimum stay, as 37.5% of Saltford hosts use this setting.
- Explore offering discounts for stays of 30+ nights to attract the 29.2% of the market seeking extended stays.
- Adjust minimum nights based on seasonality – potentially shorter during low season and longer during peak demand periods in Saltford.
Saltford Airbnb Cancellation Policy Trends Analysis (2025)
Flexible
3 listings
11.1% of total
Moderate
11 listings
40.7% of total
Firm
8 listings
29.6% of total
Strict
5 listings
18.5% of total
Cancellation Policy Insights for Saltford
- The prevailing Airbnb cancellation policy trend in Saltford is Moderate, used by 40.7% of listings.
- There's a relatively balanced mix between guest-friendly (51.8%) and stricter (48.1%) policies, offering choices for different guest needs.
Recommendations for Hosts
- Consider adopting a Moderate policy to align with the 40.7% market standard in Saltford.
- Regularly review your cancellation policy against competitors and market demand shifts in Saltford.
Saltford STR Booking Lead Time Analysis (2025)
Average Booking Lead Time by Month
Booking Lead Time Insights for Saltford
- The overall average booking lead time for vacation rentals in Saltford is 54 days.
- Guests book furthest in advance for stays during July (average 81 days), likely coinciding with peak travel demand or local events.
- The shortest booking windows occur for stays in March (average 42 days), indicating more last-minute travel plans during this time.
- Seasonally, Summer (66 days avg.) sees the longest lead times, while Fall (46 days avg.) has the shortest, reflecting typical travel planning cycles.
Recommendations for Hosts
- Use the overall average lead time (54 days) as a baseline for your pricing and availability strategy in Saltford.
- For July stays, consider implementing length-of-stay discounts or slightly higher rates for bookings made less than 81 days out to capitalize on advance planning.
- Target marketing efforts for the Summer season well in advance (at least 66 days) to capture early planners.
- Monitor your own booking lead times against these Saltford averages to identify opportunities for dynamic pricing adjustments.
Popular & Essential Airbnb Amenities in Saltford (2025)
Amenity Prevalence
Amenity Insights for Saltford
- Essential amenities in Saltford that guests expect include: TV, Smoke alarm, Free parking on premises, Heating, Dishes and silverware. Lacking these (any) could significantly impact bookings.
- Popular amenities like Hot water, Bed linens, Hair dryer are common but not universal. Offering these can provide a competitive edge.
- Warning: Wifi is not universally provided but is considered essential globally. Ensure reliable Wifi is offered.
Recommendations for Hosts
- Ensure your listing includes all essential amenities for Saltford: TV, Smoke alarm, Free parking on premises, Heating, Dishes and silverware.
- Prioritize adding missing essentials: Free parking on premises, Heating, Dishes and silverware.
- Consider adding popular differentiators like Hot water or Bed linens to increase appeal.
- Highlight unique or less common amenities you offer (e.g., hot tub, dedicated workspace, EV charger) in your listing description and photos.
- Regularly check competitor amenities in Saltford to stay competitive.
Saltford Airbnb Guest Demographics & Profile Analysis (2025)
Guest Profile Summary for Saltford
- The typical guest profile for Airbnb in Saltford consists of primarily domestic travelers (92%), often arriving from nearby England, typically belonging to the Post-2000s (Gen Z/Alpha) group (50%), primarily speaking English or Spanish.
- Domestic travelers account for 91.6% of guests.
- Key international markets include United Kingdom (91.6%) and United States (1.9%).
- Top languages spoken are English (67.4%) followed by Spanish (7%).
- A significant demographic segment is the Post-2000s (Gen Z/Alpha) group, representing 50% of guests.
Recommendations for Hosts
- Target domestic marketing efforts towards travelers from England and London.
- Tailor amenities and listing descriptions to appeal to the dominant Post-2000s (Gen Z/Alpha) demographic (e.g., highlight fast WiFi, smart home features, local guides).
- Highlight unique local experiences or amenities relevant to the primary guest profile.
- Consider seasonal promotions aligned with peak travel times for key origin markets.
Nearby Short-Term Rental Market Comparison
How does the Saltford Airbnb market stack up against its neighbors? Compare key performance metrics like average monthly revenue, ADR, and occupancy rates in surrounding areas to understand the broader regional STR landscape.
| Market | Active Properties | Monthly Revenue | Daily Rate | Avg. Occupancy |
|---|---|---|---|---|
| Englishcombe | 13 | $8,558 | $573.69 | 49% |
| Chew Magna | 14 | $6,649 | $399.59 | 46% |
| Lambourn | 11 | $6,081 | $669.47 | 28% |
| Long Sutton | 17 | $5,726 | $383.88 | 46% |
| Stoke St. Michael | 10 | $5,277 | $424.04 | 42% |
| Winsham | 10 | $5,154 | $484.22 | 52% |
| Oldland Common | 13 | $5,093 | $355.47 | 43% |
| Crai | 20 | $4,799 | $371.85 | 46% |
| Dinton | 11 | $4,637 | $242.16 | 58% |
| Limpley Stoke | 10 | $4,598 | $523.47 | 52% |