Rodney Stoke Airbnb Market Analysis 2025: Short Term Rental Data & Vacation Rental Statistics in England, United Kingdom
Is Airbnb profitable in Rodney Stoke in 2025? Explore comprehensive Airbnb analytics for Rodney Stoke, England, United Kingdom to uncover income potential. This 2025 STR market report for Rodney Stoke, based on AirROI data from April 2024 to March 2025, reveals key trends in the niche market of 17 active listings.
Whether you're considering an Airbnb investment in Rodney Stoke, optimizing your existing vacation rental, or exploring rental arbitrage opportunities, understanding the Rodney Stoke Airbnb data is crucial. Leveraging the low regulation environment is key to maximizing your short term rental income potential. Let's dive into the specifics.
Key Rodney Stoke Airbnb Performance Metrics Overview
Monthly Airbnb Revenue Variations & Income Potential in Rodney Stoke (2025)
Understanding the monthly revenue variations for Airbnb listings in Rodney Stoke is key to maximizing your short term rental income potential. Seasonality significantly impacts earnings. Our analysis, based on data from the past 12 months, shows that the peak revenue month for STRs in Rodney Stoke is typically August, while January often presents the lowest earnings, highlighting opportunities for strategic pricing adjustments during shoulder and low seasons. Explore the typical Airbnb income in Rodney Stoke across different performance tiers:
- Best-in-class properties (Top 10%) achieve $5,230+ monthly, often utilizing dynamic pricing and superior guest experiences.
- Strong performing properties (Top 25%) earn $3,596 or more, indicating effective management and desirable locations/amenities.
- Typical properties (Median) generate around $1,901 per month, representing the average market performance.
- Entry-level properties (Bottom 25%) see earnings around $1,059, often with potential for optimization.
Average Monthly Airbnb Earnings Trend in Rodney Stoke
Rodney Stoke Airbnb Occupancy Rate Trends (2025)
Maximize your bookings by understanding the Rodney Stoke STR occupancy trends. Seasonal demand shifts significantly influence how often properties are booked. Typically, Augustsees the highest demand (peak season occupancy), while April experiences the lowest (low season). Effective strategies, like adjusting minimum stays or offering promotions, can boost occupancy during slower periods. Here's how different property tiers perform in Rodney Stoke:
- Best-in-class properties (Top 10%) achieve 75%+ occupancy, indicating high desirability and potentially optimized availability.
- Strong performing properties (Top 25%) maintain 64% or higher occupancy, suggesting good market fit and guest satisfaction.
- Typical properties (Median) have an occupancy rate around 41%.
- Entry-level properties (Bottom 25%) average 20% occupancy, potentially facing higher vacancy.
Average Monthly Occupancy Rate Trend in Rodney Stoke
Average Daily Rate (ADR) Airbnb Trends in Rodney Stoke (2025)
Effective short term rental pricing strategy in Rodney Stoke involves understanding monthly ADR fluctuations. The Average Daily Rate (ADR) for Airbnb in Rodney Stoke typically peaks in August and dips lowest during March. Leveraging Airbnb dynamic pricing tools or strategies based on this seasonality can significantly boost revenue. Here's a look at the typical nightly rates achieved:
- Best-in-class properties (Top 10%) command rates of $478+ per night, often due to premium features or locations.
- Strong performing properties (Top 25%) achieve nightly rates of $300 or more.
- Typical properties (Median) charge around $197 per night.
- Entry-level properties (Bottom 25%) earn around $109 per night.
Average Daily Rate (ADR) Trend by Month in Rodney Stoke
Get Live Rodney Stoke Market Intelligence 👇

Explore Real-time Analytics
Airbnb Seasonality Analysis & Trends in Rodney Stoke (2025)
Peak Season (August, May, September)
- Revenue averages $3,348 per month
- Occupancy rates average 55.7%
- Daily rates average $284
Shoulder Season
- Revenue averages $2,555 per month
- Occupancy maintains around 42.8%
- Daily rates hold near $248
Low Season (January, February, March)
- Revenue drops to average $1,592 per month
- Occupancy decreases to average 33.2%
- Daily rates adjust to average $174
Seasonality Insights for Rodney Stoke
- The Airbnb seasonality in Rodney Stoke shows highly seasonal trends requiring careful strategy. While the sections above show seasonal averages, it's also insightful to look at the extremes:
- During the high season, the absolute peak month showcases Rodney Stoke's highest earning potential, with monthly revenues capable of climbing to $3,786, occupancy reaching a high of 63.1%, and ADRs peaking at $295.
- Conversely, the slowest single month of the year, typically falling within the low season, marks the market's lowest point. In this month, revenue might dip to $1,439, occupancy could drop to 29.8%, and ADRs may adjust down to $171.
- Understanding both the seasonal averages and these monthly peaks and troughs in revenue, occupancy, and ADR is crucial for maximizing your Airbnb profit potential in Rodney Stoke.
Seasonal Strategies for Maximizing Profit
- Peak Season: Maximize revenue through premium pricing and potentially longer minimum stays. Ensure high availability.
- Low Season: Offer competitive pricing, special promotions (e.g., extended stay discounts), and flexible cancellation policies. Target off-season travelers like remote workers or budget-conscious guests.
- Shoulder Seasons: Implement dynamic pricing that balances peak and low rates. Target weekend travelers or specific events. Offer slightly more flexible terms than peak season.
- Regularly analyze your own performance against these Rodney Stoke seasonality benchmarks and adjust your pricing and availability strategy accordingly.
Best Areas for Airbnb Investment in Rodney Stoke (2025)
Exploring the top neighborhoods for short-term rentals in Rodney Stoke? This section highlights key areas, outlining why they are attractive for hosts and guests, along with notable local attractions. Consider these locations based on your target guest profile and investment strategy.
| Neighborhood / Area | Why Host Here? (Target Guests & Appeal) | Key Attractions & Landmarks |
|---|---|---|
| Cheddar Gorge | A stunning natural landmark known for its dramatic cliffs and caves, offering opportunities for hiking and outdoor activities. It's a favorite among tourists seeking nature and adventure. | Cheddar Gorge Caves, Cheddar Village, Cliff-top walk, Honey & Garlic Cafe, Cheddar Crazy Golf |
| Wells | The smallest city in England, Wells is famous for its medieval architecture, including the stunning cathedral. It attracts visitors interested in history and culture. | Wells Cathedral, Vicars' Close, Wells Market Place, Bishop's Palace, Wells & Mendip Museum |
| Bristol | A vibrant city with a rich maritime history, Bristol is close to Rodney Stoke and offers a lively arts scene, great restaurants, and historic attractions, making it popular among tourists and business travelers alike. | Clifton Suspension Bridge, Bristol Zoo Gardens, SS Great Britain, Bristol Museum & Art Gallery, Harbourside |
| Bath | Known for its Roman baths and Georgian architecture, Bath is a UNESCO World Heritage Site and attracts visitors for its historic and cultural significance. | The Roman Baths, Bath Abbey, Pulteney Bridge, Jane Austen Centre, Thermae Bath Spa |
| Longleat | Home to Longleat House and Longleat Safari Park, this area is great for family-friendly stays and offers unique attractions. | Longleat House, Longleat Safari Park, Adventure Park at Longleat, Longleat Hedge Maze, Thornyhurst Manor |
| Glastonbury | Famous for its music festival and spiritual significance, Glastonbury attracts a diverse crowd looking for cultural and mystical experiences. | Glastonbury Tor, Glastonbury Abbey, Chalice Well, The Rural Museum, Glastonbury Festival Site |
| Chew Valley Lake | A picturesque spot popular for sailing and walking, Chew Valley Lake offers beautiful countryside and outdoor activities, attracting nature lovers. | Chew Valley Lake, Sailing and water activities, Nature trails, Chew Magna village, Local pubs and cafes |
| Bruton | A charming town known for its art galleries and gourmet food, Bruton is appealing to those looking for a quiet getaway with cultural experiences. | Hauser & Wirth Gallery, Bruton Dovecote, Bruton Museum, The Newt in Somerset, Local artisanal shops |
Understanding Airbnb License Requirements & STR Laws in Rodney Stoke (2025)
While Rodney Stoke, England, United Kingdom currently shows low STR regulations, specific Airbnb license requirements might still exist or change. Always verify the latest short term rental regulations and Airbnb license requirements directly with local government authorities for Rodney Stoke to ensure full compliance before hosting.
(Source: AirROI data, 2025, finding no licensed listings among those analyzed)
Top Performing Airbnb Properties in Rodney Stoke (2025)
Benchmark your potential! Explore examples of top-performing Airbnb properties in Rodney Stokebased on Trailing Twelve Month (TTM) revenue. Analyze their characteristics, revenue, occupancy rate, and ADR to understand what drives success in this market.

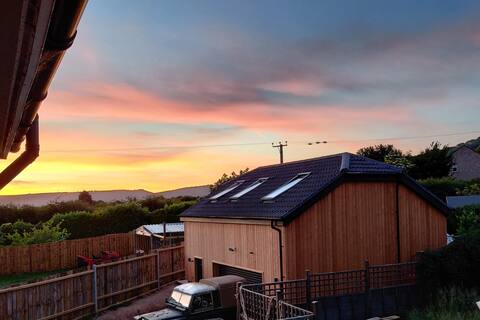
The Nook- A Rustic Cottage in a Beautiful Village.
Entire Place • 3 bedrooms
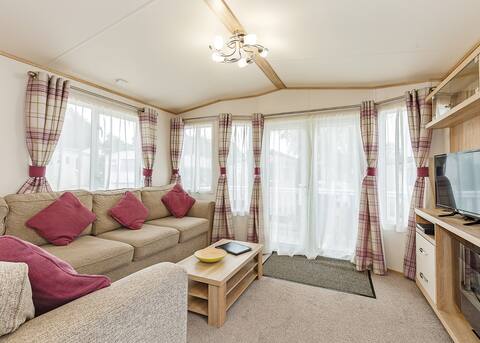
Scandi-luxe Studio, with wood fired hot tub
Entire Place • 1 bedroom
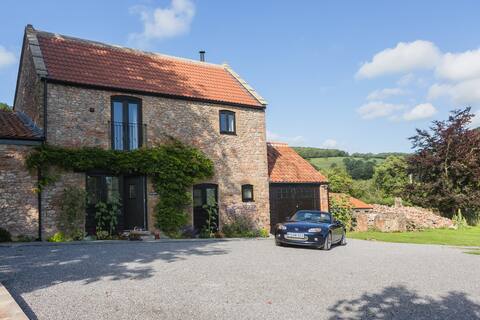
The Hayloft
Entire Place • 2 bedrooms
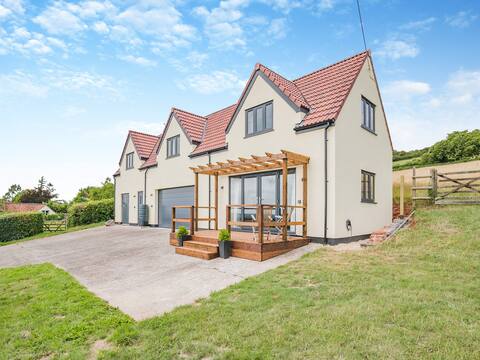
Luxury 3
Entire Place • 3 bedrooms
The Old Stable At Henley View
Entire Place • 1 bedroom
Sunny 4-bedroom cottage with South facing garden
Entire Place • 4 bedrooms
Note: Performance varies based on location, size, amenities, seasonality, and management quality. Data reflects the past 12 months.
Top Performing Airbnb Hosts in Rodney Stoke (2025)
Learn from the best! This table showcases top-performing Airbnb hosts in Rodney Stoke based on the number of properties managed and estimated total revenue over the past year. Analyze their scale and performance metrics.
| Host Name | Properties | Grossing Revenue | Stay Reviews | Avg Rating |
|---|---|---|---|---|
| Marie | 1 | $75,231 | 27 | 4.89/5.0 |
| Sam | 1 | $62,559 | 179 | 4.95/5.0 |
| Sue | 1 | $48,584 | 77 | 5.00/5.0 |
| Hoseasons | 1 | $47,377 | 17 | 4.71/5.0 |
| Marcia | 2 | $27,258 | 64 | 4.97/5.0 |
| Cottages | 1 | $26,643 | 4 | 5.00/5.0 |
| Jonathan | 1 | $26,262 | 173 | 4.94/5.0 |
| Nick & Sofia | 1 | $22,569 | 527 | 4.99/5.0 |
| Gavin | 1 | $19,578 | 82 | 4.85/5.0 |
| Ash | 1 | $15,277 | 24 | 4.96/5.0 |
Analyzing the strategies of top hosts, such as their property selection, pricing, and guest communication, can offer valuable lessons for optimizing your own Airbnb operations in Rodney Stoke.
Dive Deeper: Advanced Rodney Stoke STR Market Data (2025)
Ready to unlock more insights? AirROI provides access to advanced metrics and comprehensive Airbnb data for Rodney Stoke. Explore detailed analytics beyond this report to refine your investment strategy, optimize pricing, and maximize your vacation rental profits.
Explore Advanced MetricsRodney Stoke Short-Term Rental Market Composition (2025): Property & Room Types
Room Type Distribution
Property Type Distribution
Market Composition Insights for Rodney Stoke
- The Rodney Stoke Airbnb market composition is heavily skewed towards Entire Home/Apt listings, which make up 94.1% of the 17 active rentals. This indicates strong guest preference for privacy and space.
- Looking at the property type distribution in Rodney Stoke, House properties are the most common (52.9%), reflecting the local real estate landscape.
- Houses represent a significant 52.9% portion, catering likely to families or larger groups.
Rodney Stoke Airbnb Room Capacity Analysis (2025): Bedroom Distribution
Distribution of Listings by Number of Bedrooms
Room Capacity Insights for Rodney Stoke
- The dominant room capacity in Rodney Stoke is 1 bedroom listings, making up 47.1% of the market. This suggests a strong demand for properties suitable for couples or solo travelers.
- Together, 1 bedroom and 2 bedrooms properties represent 82.4% of the active Airbnb listings in Rodney Stoke, indicating a high concentration in these sizes.
Rodney Stoke Vacation Rental Guest Capacity Trends (2025)
Distribution of Listings by Guest Capacity
Guest Capacity Insights for Rodney Stoke
- The most common guest capacity trend in Rodney Stoke vacation rentals is listings accommodating 4 guests (41.2%). This suggests the primary traveler segment is likely small families or groups.
- Properties designed for 4 guests and 2 guests dominate the Rodney Stoke STR market, accounting for 70.6% of listings.
- 17.7% of properties accommodate 6+ guests, serving the market segment for larger families or group travel in Rodney Stoke.
- On average, properties in Rodney Stoke are equipped to host 3.6 guests.
Rodney Stoke Airbnb Booking Patterns (2025): Available vs. Booked Days
Available Days Distribution
Booked Days Distribution
Booking Pattern Insights for Rodney Stoke
- The most common availability pattern in Rodney Stoke falls within the 271-366 days range, representing 35.3% of listings. This suggests many properties have significant open periods on their calendars.
- Approximately 64.7% of listings show high availability (181+ days open annually), indicating potential for increased bookings or specific owner usage patterns.
- For booked days, the 91-180 days range is most frequent in Rodney Stoke (35.3%), reflecting common guest stay durations or potential owner blocking patterns.
- A notable 35.3% of properties secure long booking periods (181+ days booked per year), highlighting successful long-term rental strategies or significant owner usage.
Rodney Stoke Airbnb Minimum Stay Requirements Analysis
Distribution of Listings by Minimum Night Requirement
1 Night
7 listings
41.2% of total
2 Nights
5 listings
29.4% of total
3 Nights
2 listings
11.8% of total
30+ Nights
3 listings
17.6% of total
Key Insights
- The most prevalent minimum stay requirement in Rodney Stoke is 1 Night, adopted by 41.2% of listings. This highlights the market's preference for shorter, flexible bookings.
- A strong majority (70.6%) of the Rodney Stoke Airbnb data shows acceptance of very short stays (1-2 nights), indicating a dynamic, high-turnover market.
- A significant segment (17.6%) caters to monthly stays (30+ nights) in Rodney Stoke, pointing to opportunities in the extended-stay market.
Recommendations
- Align with the market by considering a 1 Night minimum stay, as 41.2% of Rodney Stoke hosts use this setting.
- Explore offering discounts for stays of 30+ nights to attract the 17.6% of the market seeking extended stays.
- Adjust minimum nights based on seasonality – potentially shorter during low season and longer during peak demand periods in Rodney Stoke.
Rodney Stoke Airbnb Cancellation Policy Trends Analysis (2025)
Super Strict 60 Days
4 listings
23.5% of total
Flexible
5 listings
29.4% of total
Moderate
3 listings
17.6% of total
Firm
4 listings
23.5% of total
Strict
1 listings
5.9% of total
Cancellation Policy Insights for Rodney Stoke
- The prevailing Airbnb cancellation policy trend in Rodney Stoke is Flexible, used by 29.4% of listings.
- There's a relatively balanced mix between guest-friendly (47.0%) and stricter (29.4%) policies, offering choices for different guest needs.
- Strict cancellation policies are quite rare (5.9%), potentially making listings with this policy less competitive unless justified by high demand or property type.
Recommendations for Hosts
- Consider adopting a Flexible policy to align with the 29.4% market standard in Rodney Stoke.
- Using a Strict policy might deter some guests, as only 5.9% of listings use it. Evaluate if potential revenue protection outweighs possible lower booking rates.
- Regularly review your cancellation policy against competitors and market demand shifts in Rodney Stoke.
Rodney Stoke STR Booking Lead Time Analysis (2025)
Average Booking Lead Time by Month
Booking Lead Time Insights for Rodney Stoke
- The overall average booking lead time for vacation rentals in Rodney Stoke is 40 days.
- Guests book furthest in advance for stays during August (average 92 days), likely coinciding with peak travel demand or local events.
- The shortest booking windows occur for stays in February (average 20 days), indicating more last-minute travel plans during this time.
- Seasonally, Summer (80 days avg.) sees the longest lead times, while Winter (39 days avg.) has the shortest, reflecting typical travel planning cycles.
Recommendations for Hosts
- Use the overall average lead time (40 days) as a baseline for your pricing and availability strategy in Rodney Stoke.
- For August stays, consider implementing length-of-stay discounts or slightly higher rates for bookings made less than 92 days out to capitalize on advance planning.
- Target marketing efforts for the Summer season well in advance (at least 80 days) to capture early planners.
- Monitor your own booking lead times against these Rodney Stoke averages to identify opportunities for dynamic pricing adjustments.
Popular & Essential Airbnb Amenities in Rodney Stoke (2025)
Amenity Prevalence
Amenity Insights for Rodney Stoke
- Popular amenities like TV, Smoke alarm, Free parking on premises are common but not universal. Offering these can provide a competitive edge.
- Warning: Wifi is not universally provided but is considered essential globally. Ensure reliable Wifi is offered.
Recommendations for Hosts
- Consider adding popular differentiators like TV or Smoke alarm to increase appeal.
- Highlight unique or less common amenities you offer (e.g., hot tub, dedicated workspace, EV charger) in your listing description and photos.
- Regularly check competitor amenities in Rodney Stoke to stay competitive.
Rodney Stoke Airbnb Guest Demographics & Profile Analysis (2025)
Guest Profile Summary for Rodney Stoke
- The typical guest profile for Airbnb in Rodney Stoke consists of primarily domestic travelers (88%), often arriving from nearby England, typically belonging to the Post-2000s (Gen Z/Alpha) group (50%), primarily speaking English or French.
- Domestic travelers account for 88.0% of guests.
- Key international markets include United Kingdom (88%) and France (3%).
- Top languages spoken are English (67.3%) followed by French (7.3%).
- A significant demographic segment is the Post-2000s (Gen Z/Alpha) group, representing 50% of guests.
Recommendations for Hosts
- Target domestic marketing efforts towards travelers from England and London.
- Tailor amenities and listing descriptions to appeal to the dominant Post-2000s (Gen Z/Alpha) demographic (e.g., highlight fast WiFi, smart home features, local guides).
- Highlight unique local experiences or amenities relevant to the primary guest profile.
- Consider seasonal promotions aligned with peak travel times for key origin markets.
Nearby Short-Term Rental Market Comparison
How does the Rodney Stoke Airbnb market stack up against its neighbors? Compare key performance metrics like average monthly revenue, ADR, and occupancy rates in surrounding areas to understand the broader regional STR landscape.
| Market | Active Properties | Monthly Revenue | Daily Rate | Avg. Occupancy |
|---|---|---|---|---|
| Englishcombe | 13 | $8,558 | $573.69 | 49% |
| Chew Magna | 14 | $6,649 | $399.59 | 46% |
| Lambourn | 11 | $6,081 | $669.47 | 28% |
| Long Sutton | 17 | $5,726 | $383.88 | 46% |
| Stoke St. Michael | 10 | $5,277 | $424.04 | 42% |
| Winsham | 10 | $5,154 | $484.22 | 52% |
| Oldland Common | 13 | $5,093 | $355.47 | 43% |
| Crai | 20 | $4,799 | $371.85 | 46% |
| Dinton | 11 | $4,637 | $242.16 | 58% |
| Limpley Stoke | 10 | $4,598 | $523.47 | 52% |