Rochester Airbnb Market Analysis 2025: Short Term Rental Data & Vacation Rental Statistics in England, United Kingdom
Is Airbnb profitable in Rochester in 2025? Explore comprehensive Airbnb analytics for Rochester, England, United Kingdom to uncover income potential. This 2025 STR market report for Rochester, based on AirROI data from April 2024 to March 2025, reveals key trends in the niche market of 48 active listings.
Whether you're considering an Airbnb investment in Rochester, optimizing your existing vacation rental, or exploring rental arbitrage opportunities, understanding the Rochester Airbnb data is crucial. Leveraging the low regulation environment is key to maximizing your short term rental income potential. Let's dive into the specifics.
Key Rochester Airbnb Performance Metrics Overview
Monthly Airbnb Revenue Variations & Income Potential in Rochester (2025)
Understanding the monthly revenue variations for Airbnb listings in Rochester is key to maximizing your short term rental income potential. Seasonality significantly impacts earnings. Our analysis, based on data from the past 12 months, shows that the peak revenue month for STRs in Rochester is typically April, while February often presents the lowest earnings, highlighting opportunities for strategic pricing adjustments during shoulder and low seasons. Explore the typical Airbnb income in Rochester across different performance tiers:
- Best-in-class properties (Top 10%) achieve $4,670+ monthly, often utilizing dynamic pricing and superior guest experiences.
- Strong performing properties (Top 25%) earn $3,055 or more, indicating effective management and desirable locations/amenities.
- Typical properties (Median) generate around $1,766 per month, representing the average market performance.
- Entry-level properties (Bottom 25%) see earnings around $917, often with potential for optimization.
Average Monthly Airbnb Earnings Trend in Rochester
Rochester Airbnb Occupancy Rate Trends (2025)
Maximize your bookings by understanding the Rochester STR occupancy trends. Seasonal demand shifts significantly influence how often properties are booked. Typically, Aprilsees the highest demand (peak season occupancy), while March experiences the lowest (low season). Effective strategies, like adjusting minimum stays or offering promotions, can boost occupancy during slower periods. Here's how different property tiers perform in Rochester:
- Best-in-class properties (Top 10%) achieve 79%+ occupancy, indicating high desirability and potentially optimized availability.
- Strong performing properties (Top 25%) maintain 64% or higher occupancy, suggesting good market fit and guest satisfaction.
- Typical properties (Median) have an occupancy rate around 44%.
- Entry-level properties (Bottom 25%) average 24% occupancy, potentially facing higher vacancy.
Average Monthly Occupancy Rate Trend in Rochester
Average Daily Rate (ADR) Airbnb Trends in Rochester (2025)
Effective short term rental pricing strategy in Rochester involves understanding monthly ADR fluctuations. The Average Daily Rate (ADR) for Airbnb in Rochester typically peaks in November and dips lowest during April. Leveraging Airbnb dynamic pricing tools or strategies based on this seasonality can significantly boost revenue. Here's a look at the typical nightly rates achieved:
- Best-in-class properties (Top 10%) command rates of $287+ per night, often due to premium features or locations.
- Strong performing properties (Top 25%) achieve nightly rates of $193 or more.
- Typical properties (Median) charge around $134 per night.
- Entry-level properties (Bottom 25%) earn around $83 per night.
Average Daily Rate (ADR) Trend by Month in Rochester
Get Live Rochester Market Intelligence 👇

Explore Real-time Analytics
Airbnb Seasonality Analysis & Trends in Rochester (2025)
Peak Season (April, June, August)
- Revenue averages $3,535 per month
- Occupancy rates average 51.0%
- Daily rates average $156
Shoulder Season
- Revenue averages $2,724 per month
- Occupancy maintains around 47.3%
- Daily rates hold near $166
Low Season (January, February, March)
- Revenue drops to average $1,714 per month
- Occupancy decreases to average 34.2%
- Daily rates adjust to average $177
Seasonality Insights for Rochester
- The Airbnb seasonality in Rochester shows highly seasonal trends requiring careful strategy. While the sections above show seasonal averages, it's also insightful to look at the extremes:
- During the high season, the absolute peak month showcases Rochester's highest earning potential, with monthly revenues capable of climbing to $3,627, occupancy reaching a high of 54.3%, and ADRs peaking at $189.
- Conversely, the slowest single month of the year, typically falling within the low season, marks the market's lowest point. In this month, revenue might dip to $1,321, occupancy could drop to 30.9%, and ADRs may adjust down to $154.
- Understanding both the seasonal averages and these monthly peaks and troughs in revenue, occupancy, and ADR is crucial for maximizing your Airbnb profit potential in Rochester.
Seasonal Strategies for Maximizing Profit
- Peak Season: Maximize revenue through premium pricing and potentially longer minimum stays. Ensure high availability.
- Low Season: Offer competitive pricing, special promotions (e.g., extended stay discounts), and flexible cancellation policies. Target off-season travelers like remote workers or budget-conscious guests.
- Shoulder Seasons: Implement dynamic pricing that balances peak and low rates. Target weekend travelers or specific events. Offer slightly more flexible terms than peak season.
- Regularly analyze your own performance against these Rochester seasonality benchmarks and adjust your pricing and availability strategy accordingly.
Best Areas for Airbnb Investment in Rochester (2025)
Exploring the top neighborhoods for short-term rentals in Rochester? This section highlights key areas, outlining why they are attractive for hosts and guests, along with notable local attractions. Consider these locations based on your target guest profile and investment strategy.
| Neighborhood / Area | Why Host Here? (Target Guests & Appeal) | Key Attractions & Landmarks |
|---|---|---|
| City Centre | The vibrant heart of Rochester, bustling with shops, restaurants, and cultural attractions. Ideal for guests wanting easy access to historical sites and modern conveniences. | Rochester Castle, Rochester Cathedral, Dickens World, High Street shops, Rochester Dickens Festival |
| Strood | Located just across the river from Rochester, Strood offers quick access to the city while being more affordable. Popular with families and commuters. | Strood Town Centre, Riverside Country Park, Medway Valley Walk, Historic Strood railway station |
| Rochester Riverside | A newly developed area along the Medway River, featuring modern apartments and scenic views. Attractive to guests looking for waterfront properties and dining options. | Rochester Riverside Market, Riverside Gardens, Historic waterfront views |
| Chatham | Adjacent to Rochester, Chatham has a rich maritime history and offers amenities like shopping and entertainment, appealing to a variety of guests. | Chatham Historic Dockyard, Royal Engineers Museum, The Pentagon Shopping Centre |
| Medway Towns | Encompassing several towns including Rochester, Chatham, and Gillingham, this area is great for budget travelers and offers diverse attractions. | Medway Park, Gillingham Pier, Chatham Theatre |
| East Rochester | A quieter residential area with parks and local cafes, ideal for guests looking for a peaceful stay while being close to attractions. | Rochester Castle Gardens, Local parks, Community events |
| Frindsbury | A suburban area with a mix of residential and green spaces, popular for families and longer stays. Provides a more local feel while being near urban conveniences. | Frindsbury village, Nature trails, Local pubs |
| Cuxton | A small village on the outskirts of Rochester, ideal for guests seeking country living with access to urban areas. Perfect for a relaxing retreat. | Cuxton Church, Chattenden Woods, Local farm shops |
Understanding Airbnb License Requirements & STR Laws in Rochester (2025)
While Rochester, England, United Kingdom currently shows low STR regulations, specific Airbnb license requirements might still exist or change. Always verify the latest short term rental regulations and Airbnb license requirements directly with local government authorities for Rochester to ensure full compliance before hosting.
(Source: AirROI data, 2025, finding no licensed listings among those analyzed)
Top Performing Airbnb Properties in Rochester (2025)
Benchmark your potential! Explore examples of top-performing Airbnb properties in Rochesterbased on Trailing Twelve Month (TTM) revenue. Analyze their characteristics, revenue, occupancy rate, and ADR to understand what drives success in this market.
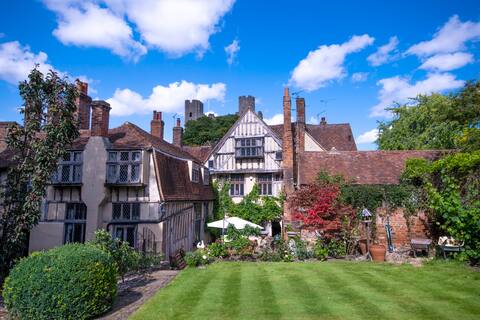
Historic House
Entire Place • 6 bedrooms
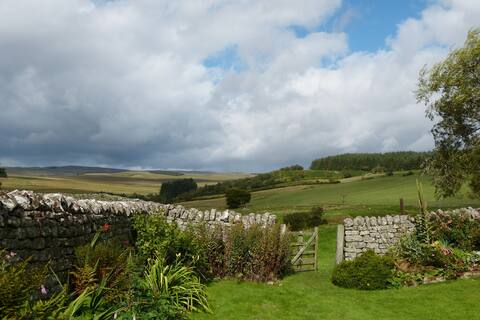
Roman Cottage - Hadrian's Wall dark sky outpost.
Entire Place • 3 bedrooms
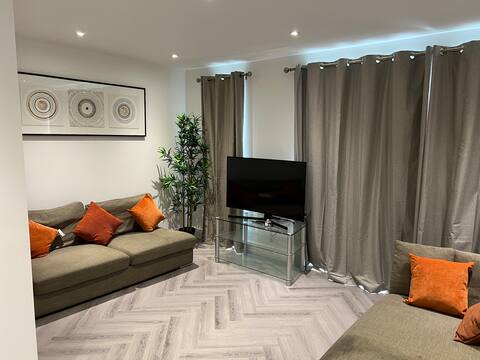
Rochester Lux Stay Townhouse 1
Entire Place • 3 bedrooms
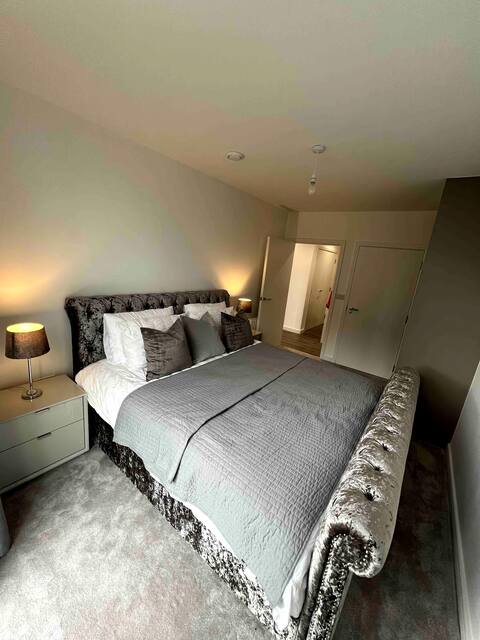
Stylish 2 Bed Apartment in Rochester
Entire Place • 2 bedrooms
Rochester Lux Stay Townhouse 2
Entire Place • 4 bedrooms
Rochester slopes - Free Street Parking
Entire Place • 3 bedrooms
Note: Performance varies based on location, size, amenities, seasonality, and management quality. Data reflects the past 12 months.
Top Performing Airbnb Hosts in Rochester (2025)
Learn from the best! This table showcases top-performing Airbnb hosts in Rochester based on the number of properties managed and estimated total revenue over the past year. Analyze their scale and performance metrics.
| Host Name | Properties | Grossing Revenue | Stay Reviews | Avg Rating |
|---|---|---|---|---|
| Pia | 1 | $248,313 | 70 | 5.00/5.0 |
| Host #330349179 | 2 | $95,823 | 1 | 0.00/5.0 |
| 360 | 4 | $92,126 | 17 | 3.40/5.0 |
| Mary | 1 | $66,325 | 30 | 5.00/5.0 |
| Catherine | 2 | $62,914 | 317 | 4.96/5.0 |
| Harry | 4 | $50,377 | 55 | 4.39/5.0 |
| Hardeep | 1 | $46,651 | 28 | 4.93/5.0 |
| Cottages | 2 | $39,516 | 12 | 4.66/5.0 |
| Kasar | 1 | $38,560 | 33 | 4.58/5.0 |
| Tom | 1 | $36,804 | 56 | 4.95/5.0 |
Analyzing the strategies of top hosts, such as their property selection, pricing, and guest communication, can offer valuable lessons for optimizing your own Airbnb operations in Rochester.
Dive Deeper: Advanced Rochester STR Market Data (2025)
Ready to unlock more insights? AirROI provides access to advanced metrics and comprehensive Airbnb data for Rochester. Explore detailed analytics beyond this report to refine your investment strategy, optimize pricing, and maximize your vacation rental profits.
Explore Advanced MetricsRochester Short-Term Rental Market Composition (2025): Property & Room Types
Room Type Distribution
Property Type Distribution
Market Composition Insights for Rochester
- The Rochester Airbnb market composition is heavily skewed towards Entire Home/Apt listings, which make up 79.2% of the 48 active rentals. This indicates strong guest preference for privacy and space.
- Looking at the property type distribution in Rochester, House properties are the most common (54.2%), reflecting the local real estate landscape.
- Houses represent a significant 54.2% portion, catering likely to families or larger groups.
Rochester Airbnb Room Capacity Analysis (2025): Bedroom Distribution
Distribution of Listings by Number of Bedrooms
Room Capacity Insights for Rochester
- The dominant room capacity in Rochester is 2 bedrooms listings, making up 41.7% of the market. This suggests a strong demand for properties suitable for couples or solo travelers.
- Together, 2 bedrooms and 1 bedroom properties represent 64.6% of the active Airbnb listings in Rochester, indicating a high concentration in these sizes.
- A significant 20.9% of listings offer 3+ bedrooms, catering to larger groups and families seeking more space in Rochester.
Rochester Vacation Rental Guest Capacity Trends (2025)
Distribution of Listings by Guest Capacity
Guest Capacity Insights for Rochester
- The most common guest capacity trend in Rochester vacation rentals is listings accommodating 6 guests (20.8%). This suggests the primary traveler segment is likely larger groups.
- Properties designed for 6 guests and 2 guests dominate the Rochester STR market, accounting for 37.5% of listings.
- 35.4% of properties accommodate 6+ guests, serving the market segment for larger families or group travel in Rochester.
- On average, properties in Rochester are equipped to host 4.2 guests.
Rochester Airbnb Booking Patterns (2025): Available vs. Booked Days
Available Days Distribution
Booked Days Distribution
Booking Pattern Insights for Rochester
- The most common availability pattern in Rochester falls within the 271-366 days range, representing 37.5% of listings. This suggests many properties have significant open periods on their calendars.
- Approximately 72.9% of listings show high availability (181+ days open annually), indicating potential for increased bookings or specific owner usage patterns.
- For booked days, the 91-180 days range is most frequent in Rochester (33.3%), reflecting common guest stay durations or potential owner blocking patterns.
- A notable 29.2% of properties secure long booking periods (181+ days booked per year), highlighting successful long-term rental strategies or significant owner usage.
Rochester Airbnb Minimum Stay Requirements Analysis
Distribution of Listings by Minimum Night Requirement
1 Night
11 listings
26.8% of total
2 Nights
12 listings
29.3% of total
3 Nights
5 listings
12.2% of total
4-6 Nights
9 listings
22% of total
7-29 Nights
1 listings
2.4% of total
30+ Nights
3 listings
7.3% of total
Key Insights
- The most prevalent minimum stay requirement in Rochester is 2 Nights, adopted by 29.3% of listings. This highlights the market's preference for shorter, flexible bookings.
Recommendations
- Align with the market by considering a 2 Nights minimum stay, as 29.3% of Rochester hosts use this setting.
- If feasible, allowing 1-night stays, especially midweek or during low season, could capture last-minute bookings, as only 26.8% currently do.
- Explore offering discounts for stays of 30+ nights to attract the 7.3% of the market seeking extended stays.
- Adjust minimum nights based on seasonality – potentially shorter during low season and longer during peak demand periods in Rochester.
Rochester Airbnb Cancellation Policy Trends Analysis (2025)
Super Strict 60 Days
3 listings
8.3% of total
Flexible
7 listings
19.4% of total
Moderate
5 listings
13.9% of total
Firm
11 listings
30.6% of total
Strict
10 listings
27.8% of total
Cancellation Policy Insights for Rochester
- The prevailing Airbnb cancellation policy trend in Rochester is Firm, used by 30.6% of listings.
- A majority (58.4%) of hosts in Rochester utilize Firm or Strict policies, indicating a market where hosts prioritize booking security.
Recommendations for Hosts
- Consider adopting a Firm policy to align with the 30.6% market standard in Rochester.
- Regularly review your cancellation policy against competitors and market demand shifts in Rochester.
Rochester STR Booking Lead Time Analysis (2025)
Average Booking Lead Time by Month
Booking Lead Time Insights for Rochester
- The overall average booking lead time for vacation rentals in Rochester is 48 days.
- Guests book furthest in advance for stays during October (average 82 days), likely coinciding with peak travel demand or local events.
- The shortest booking windows occur for stays in January (average 22 days), indicating more last-minute travel plans during this time.
- Seasonally, Summer (69 days avg.) sees the longest lead times, while Winter (35 days avg.) has the shortest, reflecting typical travel planning cycles.
Recommendations for Hosts
- Use the overall average lead time (48 days) as a baseline for your pricing and availability strategy in Rochester.
- For October stays, consider implementing length-of-stay discounts or slightly higher rates for bookings made less than 82 days out to capitalize on advance planning.
- Target marketing efforts for the Summer season well in advance (at least 69 days) to capture early planners.
- Monitor your own booking lead times against these Rochester averages to identify opportunities for dynamic pricing adjustments.
Popular & Essential Airbnb Amenities in Rochester (2025)
Amenity Prevalence
Amenity Insights for Rochester
- Essential amenities in Rochester that guests expect include: Smoke alarm, Wifi, Heating, Washer. Lacking these (any) could significantly impact bookings.
- Popular amenities like Kitchen, Carbon monoxide alarm, TV are common but not universal. Offering these can provide a competitive edge.
Recommendations for Hosts
- Ensure your listing includes all essential amenities for Rochester: Smoke alarm, Wifi, Heating, Washer.
- Prioritize adding missing essentials: Heating, Washer.
- Consider adding popular differentiators like Kitchen or Carbon monoxide alarm to increase appeal.
- Highlight unique or less common amenities you offer (e.g., hot tub, dedicated workspace, EV charger) in your listing description and photos.
- Regularly check competitor amenities in Rochester to stay competitive.
Rochester Airbnb Guest Demographics & Profile Analysis (2025)
Guest Profile Summary for Rochester
- The typical guest profile for Airbnb in Rochester consists of primarily domestic travelers (78%), often arriving from nearby England, typically belonging to the Post-2000s (Gen Z/Alpha) group (50%), primarily speaking English or French.
- Domestic travelers account for 77.5% of guests.
- Key international markets include United Kingdom (77.5%) and United States (4.8%).
- Top languages spoken are English (52.1%) followed by French (9.7%).
- A significant demographic segment is the Post-2000s (Gen Z/Alpha) group, representing 50% of guests.
Recommendations for Hosts
- Target domestic marketing efforts towards travelers from England and London.
- Tailor amenities and listing descriptions to appeal to the dominant Post-2000s (Gen Z/Alpha) demographic (e.g., highlight fast WiFi, smart home features, local guides).
- Highlight unique local experiences or amenities relevant to the primary guest profile.
- Consider seasonal promotions aligned with peak travel times for key origin markets.
Nearby Short-Term Rental Market Comparison
How does the Rochester Airbnb market stack up against its neighbors? Compare key performance metrics like average monthly revenue, ADR, and occupancy rates in surrounding areas to understand the broader regional STR landscape.
| Market | Active Properties | Monthly Revenue | Daily Rate | Avg. Occupancy |
|---|---|---|---|---|
| Dorney | 12 | $8,335 | $622.48 | 45% |
| City of Westminster | 1,327 | $6,043 | $486.66 | 52% |
| Wraysbury | 14 | $4,719 | $396.18 | 46% |
| Old Windsor | 22 | $4,655 | $347.12 | 54% |
| Iver Heath | 17 | $3,761 | $226.81 | 49% |
| Binfield | 14 | $3,579 | $370.51 | 43% |
| Bray | 35 | $3,508 | $370.24 | 45% |
| Roedean | 47 | $3,494 | $257.09 | 47% |
| Sunninghill | 11 | $3,456 | $398.67 | 45% |
| Hambleden | 23 | $3,394 | $350.08 | 41% |