Porchfield Airbnb Market Analysis 2025: Short Term Rental Data & Vacation Rental Statistics in England, United Kingdom
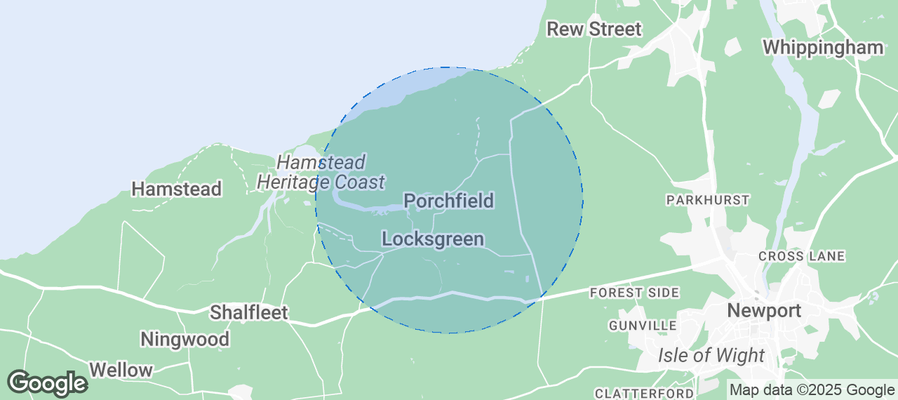
Is Airbnb profitable in Porchfield in 2025? Explore comprehensive Airbnb analytics for Porchfield, England, United Kingdom to uncover income potential. This 2025 STR market report for Porchfield, based on AirROI data from April 2024 to March 2025, reveals key trends in the niche market of 37 active listings.
Whether you're considering an Airbnb investment in Porchfield, optimizing your existing vacation rental, or exploring rental arbitrage opportunities, understanding the Porchfield Airbnb data is crucial. Leveraging the low regulation environment is key to maximizing your short term rental income potential. Let's dive into the specifics.
Key Porchfield Airbnb Performance Metrics Overview
Monthly Airbnb Revenue Variations & Income Potential in Porchfield (2025)
Understanding the monthly revenue variations for Airbnb listings in Porchfield is key to maximizing your short term rental income potential. Seasonality significantly impacts earnings. Our analysis, based on data from the past 12 months, shows that the peak revenue month for STRs in Porchfield is typically August, while March often presents the lowest earnings, highlighting opportunities for strategic pricing adjustments during shoulder and low seasons. Explore the typical Airbnb income in Porchfield across different performance tiers:
- Best-in-class properties (Top 10%) achieve $4,434+ monthly, often utilizing dynamic pricing and superior guest experiences.
- Strong performing properties (Top 25%) earn $2,758 or more, indicating effective management and desirable locations/amenities.
- Typical properties (Median) generate around $1,598 per month, representing the average market performance.
- Entry-level properties (Bottom 25%) see earnings around $840, often with potential for optimization.
Average Monthly Airbnb Earnings Trend in Porchfield
Porchfield Airbnb Occupancy Rate Trends (2025)
Maximize your bookings by understanding the Porchfield STR occupancy trends. Seasonal demand shifts significantly influence how often properties are booked. Typically, Augustsees the highest demand (peak season occupancy), while January experiences the lowest (low season). Effective strategies, like adjusting minimum stays or offering promotions, can boost occupancy during slower periods. Here's how different property tiers perform in Porchfield:
- Best-in-class properties (Top 10%) achieve 75%+ occupancy, indicating high desirability and potentially optimized availability.
- Strong performing properties (Top 25%) maintain 60% or higher occupancy, suggesting good market fit and guest satisfaction.
- Typical properties (Median) have an occupancy rate around 37%.
- Entry-level properties (Bottom 25%) average 21% occupancy, potentially facing higher vacancy.
Average Monthly Occupancy Rate Trend in Porchfield
Average Daily Rate (ADR) Airbnb Trends in Porchfield (2025)
Effective short term rental pricing strategy in Porchfield involves understanding monthly ADR fluctuations. The Average Daily Rate (ADR) for Airbnb in Porchfield typically peaks in December and dips lowest during October. Leveraging Airbnb dynamic pricing tools or strategies based on this seasonality can significantly boost revenue. Here's a look at the typical nightly rates achieved:
- Best-in-class properties (Top 10%) command rates of $251+ per night, often due to premium features or locations.
- Strong performing properties (Top 25%) achieve nightly rates of $183 or more.
- Typical properties (Median) charge around $138 per night.
- Entry-level properties (Bottom 25%) earn around $107 per night.
Average Daily Rate (ADR) Trend by Month in Porchfield
Get Live Porchfield Market Intelligence 👇
Explore Real-time Analytics
Airbnb Seasonality Analysis & Trends in Porchfield (2025)
Peak Season (August, July, May)
- Revenue averages $3,260 per month
- Occupancy rates average 56.7%
- Daily rates average $178
Shoulder Season
- Revenue averages $2,149 per month
- Occupancy maintains around 40.6%
- Daily rates hold near $177
Low Season (January, February, March)
- Revenue drops to average $908 per month
- Occupancy decreases to average 26.1%
- Daily rates adjust to average $181
Seasonality Insights for Porchfield
- The Airbnb seasonality in Porchfield shows highly seasonal trends requiring careful strategy. While the sections above show seasonal averages, it's also insightful to look at the extremes:
- During the high season, the absolute peak month showcases Porchfield's highest earning potential, with monthly revenues capable of climbing to $3,613, occupancy reaching a high of 67.6%, and ADRs peaking at $189.
- Conversely, the slowest single month of the year, typically falling within the low season, marks the market's lowest point. In this month, revenue might dip to $793, occupancy could drop to 23.9%, and ADRs may adjust down to $168.
- Understanding both the seasonal averages and these monthly peaks and troughs in revenue, occupancy, and ADR is crucial for maximizing your Airbnb profit potential in Porchfield.
Seasonal Strategies for Maximizing Profit
- Peak Season: Maximize revenue through premium pricing and potentially longer minimum stays. Ensure high availability.
- Low Season: Offer competitive pricing, special promotions (e.g., extended stay discounts), and flexible cancellation policies. Target off-season travelers like remote workers or budget-conscious guests.
- Shoulder Seasons: Implement dynamic pricing that balances peak and low rates. Target weekend travelers or specific events. Offer slightly more flexible terms than peak season.
- Regularly analyze your own performance against these Porchfield seasonality benchmarks and adjust your pricing and availability strategy accordingly.
Best Areas for Airbnb Investment in Porchfield (2025)
Exploring the top neighborhoods for short-term rentals in Porchfield? This section highlights key areas, outlining why they are attractive for hosts and guests, along with notable local attractions. Consider these locations based on your target guest profile and investment strategy.
| Neighborhood / Area | Why Host Here? (Target Guests & Appeal) | Key Attractions & Landmarks |
|---|---|---|
| Shanklin | A popular seaside resort on the Isle of Wight known for its beautiful beach, picturesque old village, and family-friendly attractions. Ideal for summer vacationers looking for a classic British seaside experience. | Shanklin Beach, Shanklin Chine, Amazon World Zoo Park, Isle of Wight Donkey Sanctuary, Shanklin Theatre |
| Cowes | Famous for its sailing regattas and yachting events, Cowes attracts sailing enthusiasts and tourists. The towns vibrant marina and waterfront are essential for visitors. | Cowes Maritime Museum, Northwood Park, Egypt Point, Cowes Week, Sailing heritage |
| Ventnor | Nestled on the southern coast, Ventnor is renowned for its subtropical climate and beautiful botanical gardens. Attracts nature lovers and those seeking relaxation by the sea. | Ventnor Botanic Garden, Ventnor Beach, The Old Village, St. Boniface Down, The Needles |
| Ryde | As the largest town on the Isle of Wight, Ryde offers a mix of beach, history, and shopping. It has easy ferry access to the mainland, making it appealing for short stays. | Ryde Beach, Ryde Pier, Appley Park, The Isle of Wight Model Village, Ryde Castle |
| Newport | The county town of the Isle of Wight, Newport is the central hub for shopping, culture, and history, making it a strategic location for Airbnb. | Carisbrooke Castle, Newport Roman Villa, Quay Arts Centre, The Isle of Wight Festival, Newport Priory |
| Sandown | With its extensive sandy beach, amusement parks, and family-friendly environment, Sandown is perfect for families and tourists seeking fun activities. | Sandown Beach, Zoological Gardens, Dinosaur Isle, Sandown Pier, The Esplanade |
| West Cowes | Part of the Cowes area, West Cowes boasts stunning waterfront views and a vibrant dining scene. It's popular for both sailing and waterfront activities. | Cowes Harbour, West Cowes Beach, Appley Park, Royal Yacht Squadron, Maritime Museum |
| Seaview | A quaint coastal village that offers a quieter alternative to busier areas, Seaview is known for its picturesque beach and charming atmosphere. | Seaview Beach, Seaview Wildlife Encounter, Seaview Marina, The Old Church, The Seaview Hotel |
Understanding Airbnb License Requirements & STR Laws in Porchfield (2025)
While Porchfield, England, United Kingdom currently shows low STR regulations, specific Airbnb license requirements might still exist or change. Always verify the latest short term rental regulations and Airbnb license requirements directly with local government authorities for Porchfield to ensure full compliance before hosting.
(Source: AirROI data, 2025, finding no licensed listings among those analyzed)
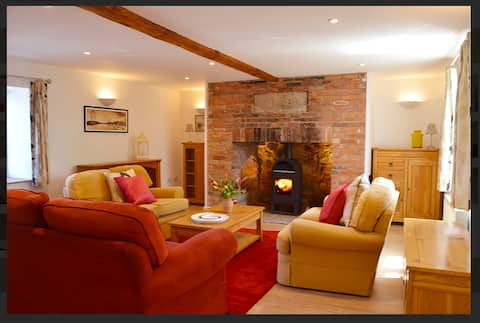
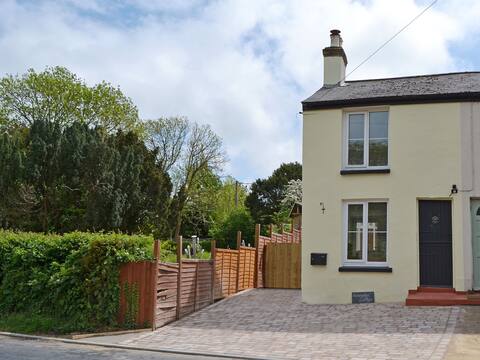
Top Performing Airbnb Properties in Porchfield (2025)
Benchmark your potential! Explore examples of top-performing Airbnb properties in Porchfieldbased on Trailing Twelve Month (TTM) revenue. Analyze their characteristics, revenue, occupancy rate, and ADR to understand what drives success in this market.

Colemans Retreat
Entire Place • 4 bedrooms

Finest Retreats | Ocean View
Entire Place • 2 bedrooms
The Old Cottage
Entire Place • 3 bedrooms

Our Luxury yurt in peaceful setting close to Cowes
Entire Place • 2 bedrooms

2 bedroom first floor apartment
Entire Place • 2 bedrooms
Horseshoe Cottage
Entire Place • 2 bedrooms
Note: Performance varies based on location, size, amenities, seasonality, and management quality. Data reflects the past 12 months.
Top Performing Airbnb Hosts in Porchfield (2025)
Learn from the best! This table showcases top-performing Airbnb hosts in Porchfield based on the number of properties managed and estimated total revenue over the past year. Analyze their scale and performance metrics.
| Host Name | Properties | Grossing Revenue | Stay Reviews | Avg Rating |
|---|---|---|---|---|
| Ashley | 1 | $79,157 | 32 | 5.00/5.0 |
| Charlotte | 2 | $76,881 | 385 | 4.96/5.0 |
| Finest Retreats | 1 | $61,282 | 6 | 4.33/5.0 |
| Cottages | 4 | $37,796 | 12 | 1.15/5.0 |
| Antony | 1 | $28,590 | 24 | 5.00/5.0 |
| Louise | 1 | $23,995 | 192 | 4.62/5.0 |
| Kelly | 1 | $22,815 | 4 | 5.00/5.0 |
| Beccie And Tim | 1 | $21,097 | 94 | 4.83/5.0 |
| Steven | 1 | $20,811 | 66 | 4.67/5.0 |
| Host #199055975 | 1 | $20,583 | 2 | 0.00/5.0 |
Analyzing the strategies of top hosts, such as their property selection, pricing, and guest communication, can offer valuable lessons for optimizing your own Airbnb operations in Porchfield.
Dive Deeper: Advanced Porchfield STR Market Data (2025)
Ready to unlock more insights? AirROI provides access to advanced metrics and comprehensive Airbnb data for Porchfield. Explore detailed analytics beyond this report to refine your investment strategy, optimize pricing, and maximize your vacation rental profits.
Explore Advanced MetricsPorchfield Short-Term Rental Market Composition (2025): Property & Room Types
Room Type Distribution
Property Type Distribution
Market Composition Insights for Porchfield
- The Porchfield Airbnb market composition is heavily skewed towards Entire Home/Apt listings, which make up 100% of the 37 active rentals. This indicates strong guest preference for privacy and space.
- Looking at the property type distribution in Porchfield, House properties are the most common (43.2%), reflecting the local real estate landscape.
- Houses represent a significant 43.2% portion, catering likely to families or larger groups.
- Smaller segments like hotel/boutique, apartment/condo (combined 5.4%) offer potential for unique stay experiences.
Porchfield Airbnb Room Capacity Analysis (2025): Bedroom Distribution
Distribution of Listings by Number of Bedrooms
Room Capacity Insights for Porchfield
- The dominant room capacity in Porchfield is 2 bedrooms listings, making up 59.5% of the market. This suggests a strong demand for properties suitable for couples or solo travelers.
- Together, 2 bedrooms and 3 bedrooms properties represent 89.2% of the active Airbnb listings in Porchfield, indicating a high concentration in these sizes.
- A significant 35.1% of listings offer 3+ bedrooms, catering to larger groups and families seeking more space in Porchfield.
Porchfield Vacation Rental Guest Capacity Trends (2025)
Distribution of Listings by Guest Capacity
Guest Capacity Insights for Porchfield
- The most common guest capacity trend in Porchfield vacation rentals is listings accommodating 6 guests (43.2%). This suggests the primary traveler segment is likely larger groups.
- Properties designed for 6 guests and 4 guests dominate the Porchfield STR market, accounting for 70.2% of listings.
- 59.4% of properties accommodate 6+ guests, serving the market segment for larger families or group travel in Porchfield.
- On average, properties in Porchfield are equipped to host 5.5 guests.
Porchfield Airbnb Booking Patterns (2025): Available vs. Booked Days
Available Days Distribution
Booked Days Distribution
Booking Pattern Insights for Porchfield
- The most common availability pattern in Porchfield falls within the 271-366 days range, representing 43.2% of listings. This suggests many properties have significant open periods on their calendars.
- Approximately 78.3% of listings show high availability (181+ days open annually), indicating potential for increased bookings or specific owner usage patterns.
- For booked days, the 91-180 days range is most frequent in Porchfield (35.1%), reflecting common guest stay durations or potential owner blocking patterns.
- A notable 24.3% of properties secure long booking periods (181+ days booked per year), highlighting successful long-term rental strategies or significant owner usage.
Porchfield Airbnb Minimum Stay Requirements Analysis
Distribution of Listings by Minimum Night Requirement
1 Night
5 listings
15.6% of total
2 Nights
7 listings
21.9% of total
3 Nights
11 listings
34.4% of total
4-6 Nights
2 listings
6.3% of total
7-29 Nights
2 listings
6.3% of total
30+ Nights
5 listings
15.6% of total
Key Insights
- The most prevalent minimum stay requirement in Porchfield is 3 Nights, adopted by 34.4% of listings. This highlights the market's preference for longer commitments.
- A significant segment (15.6%) caters to monthly stays (30+ nights) in Porchfield, pointing to opportunities in the extended-stay market.
Recommendations
- Align with the market by considering a 3 Nights minimum stay, as 34.4% of Porchfield hosts use this setting.
- If feasible, allowing 1-night stays, especially midweek or during low season, could capture last-minute bookings, as only 15.6% currently do.
- Explore offering discounts for stays of 30+ nights to attract the 15.6% of the market seeking extended stays.
- Adjust minimum nights based on seasonality – potentially shorter during low season and longer during peak demand periods in Porchfield.
Porchfield Airbnb Cancellation Policy Trends Analysis (2025)
Super Strict 60 Days
1 listings
3.8% of total
Refundable
1 listings
3.8% of total
Flexible
1 listings
3.8% of total
Moderate
8 listings
30.8% of total
Firm
11 listings
42.3% of total
Strict
4 listings
15.4% of total
Cancellation Policy Insights for Porchfield
- The prevailing Airbnb cancellation policy trend in Porchfield is Firm, used by 42.3% of listings.
- A majority (57.7%) of hosts in Porchfield utilize Firm or Strict policies, indicating a market where hosts prioritize booking security.
Recommendations for Hosts
- Consider adopting a Firm policy to align with the 42.3% market standard in Porchfield.
- Regularly review your cancellation policy against competitors and market demand shifts in Porchfield.
Porchfield STR Booking Lead Time Analysis (2025)
Average Booking Lead Time by Month
Booking Lead Time Insights for Porchfield
- The overall average booking lead time for vacation rentals in Porchfield is 62 days.
- Guests book furthest in advance for stays during June (average 132 days), likely coinciding with peak travel demand or local events.
- The shortest booking windows occur for stays in March (average 32 days), indicating more last-minute travel plans during this time.
- Seasonally, Summer (109 days avg.) sees the longest lead times, while Fall (53 days avg.) has the shortest, reflecting typical travel planning cycles.
Recommendations for Hosts
- Use the overall average lead time (62 days) as a baseline for your pricing and availability strategy in Porchfield.
- For June stays, consider implementing length-of-stay discounts or slightly higher rates for bookings made less than 132 days out to capitalize on advance planning.
- Target marketing efforts for the Summer season well in advance (at least 109 days) to capture early planners.
- Monitor your own booking lead times against these Porchfield averages to identify opportunities for dynamic pricing adjustments.
Popular & Essential Airbnb Amenities in Porchfield (2025)
Amenity Prevalence
Amenity Insights for Porchfield
- Essential amenities in Porchfield that guests expect include: Kitchen, Smoke alarm, Free parking on premises, TV, Heating. Lacking these (any) could significantly impact bookings.
- Popular amenities like Carbon monoxide alarm, Fire extinguisher, Bed linens are common but not universal. Offering these can provide a competitive edge.
Recommendations for Hosts
- Ensure your listing includes all essential amenities for Porchfield: Kitchen, Smoke alarm, Free parking on premises, TV, Heating.
- Prioritize adding missing essentials: Heating.
- Consider adding popular differentiators like Carbon monoxide alarm or Fire extinguisher to increase appeal.
- Highlight unique or less common amenities you offer (e.g., hot tub, dedicated workspace, EV charger) in your listing description and photos.
- Regularly check competitor amenities in Porchfield to stay competitive.
Porchfield Airbnb Guest Demographics & Profile Analysis (2025)
Guest Profile Summary for Porchfield
- The typical guest profile for Airbnb in Porchfield consists of primarily domestic travelers (96%), often arriving from nearby England, typically belonging to the Post-2000s (Gen Z/Alpha) group (50%), primarily speaking English or Spanish.
- Domestic travelers account for 95.5% of guests.
- Key international markets include United Kingdom (95.5%) and United States (0.7%).
- Top languages spoken are English (70.7%) followed by Spanish (4.7%).
- A significant demographic segment is the Post-2000s (Gen Z/Alpha) group, representing 50% of guests.
Recommendations for Hosts
- Target domestic marketing efforts towards travelers from England and London.
- Tailor amenities and listing descriptions to appeal to the dominant Post-2000s (Gen Z/Alpha) demographic (e.g., highlight fast WiFi, smart home features, local guides).
- Highlight unique local experiences or amenities relevant to the primary guest profile.
- Consider seasonal promotions aligned with peak travel times for key origin markets.
Nearby Short-Term Rental Market Comparison
How does the Porchfield Airbnb market stack up against its neighbors? Compare key performance metrics like average monthly revenue, ADR, and occupancy rates in surrounding areas to understand the broader regional STR landscape.
| Market | Active Properties | Monthly Revenue | Daily Rate | Avg. Occupancy |
|---|---|---|---|---|
| Englishcombe | 13 | $8,558 | $573.69 | 49% |
| Dorney | 12 | $8,335 | $622.48 | 45% |
| Chew Magna | 14 | $6,649 | $399.59 | 46% |
| Lambourn | 11 | $6,081 | $669.47 | 28% |
| City of Westminster | 1,327 | $6,043 | $486.66 | 52% |
| Long Sutton | 17 | $5,726 | $383.88 | 46% |
| Stoke St. Michael | 10 | $5,277 | $424.04 | 42% |
| Winsham | 10 | $5,154 | $484.22 | 52% |
| Oldland Common | 13 | $5,093 | $355.47 | 43% |
| Wraysbury | 14 | $4,719 | $396.18 | 46% |