Poole Airbnb Market Analysis 2025: Short Term Rental Data & Vacation Rental Statistics in England, United Kingdom
Is Airbnb profitable in Poole in 2025? Explore comprehensive Airbnb analytics for Poole, England, United Kingdom to uncover income potential. This 2025 STR market report for Poole, based on AirROI data from April 2024 to March 2025, reveals key trends in the market of 579 active listings.
Whether you're considering an Airbnb investment in Poole, optimizing your existing vacation rental, or exploring rental arbitrage opportunities, understanding the Poole Airbnb data is crucial. Leveraging the low regulation environment is key to maximizing your short term rental income potential. Let's dive into the specifics.
Key Poole Airbnb Performance Metrics Overview
Monthly Airbnb Revenue Variations & Income Potential in Poole (2025)
Understanding the monthly revenue variations for Airbnb listings in Poole is key to maximizing your short term rental income potential. Seasonality significantly impacts earnings. Our analysis, based on data from the past 12 months, shows that the peak revenue month for STRs in Poole is typically August, while March often presents the lowest earnings, highlighting opportunities for strategic pricing adjustments during shoulder and low seasons. Explore the typical Airbnb income in Poole across different performance tiers:
- Best-in-class properties (Top 10%) achieve $6,736+ monthly, often utilizing dynamic pricing and superior guest experiences.
- Strong performing properties (Top 25%) earn $4,271 or more, indicating effective management and desirable locations/amenities.
- Typical properties (Median) generate around $2,441 per month, representing the average market performance.
- Entry-level properties (Bottom 25%) see earnings around $1,152, often with potential for optimization.
Average Monthly Airbnb Earnings Trend in Poole
Poole Airbnb Occupancy Rate Trends (2025)
Maximize your bookings by understanding the Poole STR occupancy trends. Seasonal demand shifts significantly influence how often properties are booked. Typically, Augustsees the highest demand (peak season occupancy), while March experiences the lowest (low season). Effective strategies, like adjusting minimum stays or offering promotions, can boost occupancy during slower periods. Here's how different property tiers perform in Poole:
- Best-in-class properties (Top 10%) achieve 84%+ occupancy, indicating high desirability and potentially optimized availability.
- Strong performing properties (Top 25%) maintain 68% or higher occupancy, suggesting good market fit and guest satisfaction.
- Typical properties (Median) have an occupancy rate around 44%.
- Entry-level properties (Bottom 25%) average 21% occupancy, potentially facing higher vacancy.
Average Monthly Occupancy Rate Trend in Poole
Average Daily Rate (ADR) Airbnb Trends in Poole (2025)
Effective short term rental pricing strategy in Poole involves understanding monthly ADR fluctuations. The Average Daily Rate (ADR) for Airbnb in Poole typically peaks in August and dips lowest during November. Leveraging Airbnb dynamic pricing tools or strategies based on this seasonality can significantly boost revenue. Here's a look at the typical nightly rates achieved:
- Best-in-class properties (Top 10%) command rates of $597+ per night, often due to premium features or locations.
- Strong performing properties (Top 25%) achieve nightly rates of $317 or more.
- Typical properties (Median) charge around $188 per night.
- Entry-level properties (Bottom 25%) earn around $120 per night.
Average Daily Rate (ADR) Trend by Month in Poole
Get Live Poole Market Intelligence 👇

Explore Real-time Analytics
Airbnb Seasonality Analysis & Trends in Poole (2025)
Peak Season (August, July, June)
- Revenue averages $4,808 per month
- Occupancy rates average 55.2%
- Daily rates average $292
Shoulder Season
- Revenue averages $3,226 per month
- Occupancy maintains around 43.7%
- Daily rates hold near $275
Low Season (February, March, November)
- Revenue drops to average $2,089 per month
- Occupancy decreases to average 37.6%
- Daily rates adjust to average $254
Seasonality Insights for Poole
- The Airbnb seasonality in Poole shows highly seasonal trends requiring careful strategy. While the sections above show seasonal averages, it's also insightful to look at the extremes:
- During the high season, the absolute peak month showcases Poole's highest earning potential, with monthly revenues capable of climbing to $5,172, occupancy reaching a high of 62.7%, and ADRs peaking at $297.
- Conversely, the slowest single month of the year, typically falling within the low season, marks the market's lowest point. In this month, revenue might dip to $1,834, occupancy could drop to 31.7%, and ADRs may adjust down to $252.
- Understanding both the seasonal averages and these monthly peaks and troughs in revenue, occupancy, and ADR is crucial for maximizing your Airbnb profit potential in Poole.
Seasonal Strategies for Maximizing Profit
- Peak Season: Maximize revenue through premium pricing and potentially longer minimum stays. Ensure high availability.
- Low Season: Offer competitive pricing, special promotions (e.g., extended stay discounts), and flexible cancellation policies. Target off-season travelers like remote workers or budget-conscious guests.
- Shoulder Seasons: Implement dynamic pricing that balances peak and low rates. Target weekend travelers or specific events. Offer slightly more flexible terms than peak season.
- Regularly analyze your own performance against these Poole seasonality benchmarks and adjust your pricing and availability strategy accordingly.
Best Areas for Airbnb Investment in Poole (2025)
Exploring the top neighborhoods for short-term rentals in Poole? This section highlights key areas, outlining why they are attractive for hosts and guests, along with notable local attractions. Consider these locations based on your target guest profile and investment strategy.
| Neighborhood / Area | Why Host Here? (Target Guests & Appeal) | Key Attractions & Landmarks |
|---|---|---|
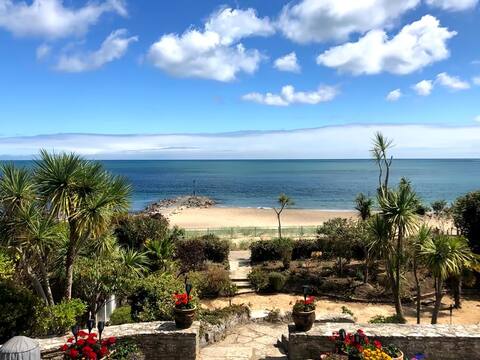
| Sandbanks | Renowned for its millionaire properties and stunning beach, Sandbanks is a prime tourist destination that attracts visitors looking for luxury and scenic views. | Sandbanks Beach, Brownsea Island, Studland Bay, Poole Harbour, The Sandbanks Ferry |
| Poole Quay | A vibrant harbour area with a variety of restaurants, shops, and attractions. Perfect for those wanting to experience the seaside charm and local events. | Poole Museum, RNLI College, Harbour Cruises, Restaurants and bars along the Quay, Poole Park |
| Studland | A picturesque village with stunning natural beauty and outdoor activities. Ideal for nature lovers and those looking for a serene getaway. | Studland Beach, Old Harry Rocks, Durlston Country Park, Studland Nature Reserve, Corfe Castle |
| Old Town Poole | Full of history and character, the Old Town offers a glimpse into Poole's maritime past, making it appealing to tourists interested in heritage. | Poole Old Town, Poole Bridge, The Dolphin Centre, St James' Church, National Trust's Brownsea Island |
| Hamworthy | A quieter area with good local amenities and proximity to the beach, perfect for families and those seeking a relaxed stay. | Hamworthy Park, Poole Park, The Poole Pottery, Lifeboat Museum, Harbour views |
| Canford Cliffs | An upmarket residential area with beautiful beaches and parks, attracting visitors looking for a more exclusive and peaceful atmosphere. | Canford Cliffs Beach, Branksome Chine, Compton Acres, Local boutiques and cafes, The beaches |
| Ashley Cross | A popular suburb known for its village feel, trendy cafes, and proximity to the beach. Ideal for younger visitors and families. | Ashley Cross Green, Local pubs and restaurants, Poole Park, Dolphin Shopping Centre, Nearby beaches |
| Lilliput | A charming residential area close to the water, great for families and those who appreciate a quieter community feel with easy access to attractions. | Lilliput Park, Poole Yacht Club, Local cafes, Compton Acres, Baiter Park |
Understanding Airbnb License Requirements & STR Laws in Poole (2025)
While Poole, England, United Kingdom currently shows low STR regulations, specific Airbnb license requirements might still exist or change. Always verify the latest short term rental regulations and Airbnb license requirements directly with local government authorities for Poole to ensure full compliance before hosting.
(Source: AirROI data, 2025, based on 0% licensed listings)
Top Performing Airbnb Properties in Poole (2025)
Benchmark your potential! Explore examples of top-performing Airbnb properties in Poolebased on Trailing Twelve Month (TTM) revenue. Analyze their characteristics, revenue, occupancy rate, and ADR to understand what drives success in this market.
Stunning Sandbanks luxury beach front villa
Entire Place • 8 bedrooms
Feb&MarchOffer/LuxuryVilla/Hot Tub/Football Court
Entire Place • 6 bedrooms

To the manor born… cinema, pool table, hot tub
Entire Place • 7 bedrooms
Windward, Sandbanks
Entire Place • 4 bedrooms
Luxury waterfront 5 bed house
Entire Place • 5 bedrooms
Family Home in Poole, Dorset
Entire Place • 4 bedrooms
Note: Performance varies based on location, size, amenities, seasonality, and management quality. Data reflects the past 12 months.
Top Performing Airbnb Hosts in Poole (2025)
Learn from the best! This table showcases top-performing Airbnb hosts in Poole based on the number of properties managed and estimated total revenue over the past year. Analyze their scale and performance metrics.
| Host Name | Properties | Grossing Revenue | Stay Reviews | Avg Rating |
|---|---|---|---|---|
| Joe | 24 | $895,839 | 809 | 4.74/5.0 |
| Grandeur Property | 24 | $827,163 | 508 | 4.35/5.0 |
| Quay Holidays LLP | 35 | $726,342 | 178 | 2.87/5.0 |
| Harbour Escapes | 6 | $415,541 | 130 | 4.90/5.0 |
| Tricia | 21 | $282,845 | 172 | 3.18/5.0 |
| Annabelle | 1 | $275,035 | 98 | 4.96/5.0 |
| Luke | 1 | $267,172 | 26 | 5.00/5.0 |
| Nicholas | 3 | $260,310 | 483 | 4.86/5.0 |
| Sherrill | 1 | $252,845 | 55 | 4.98/5.0 |
| Cottages | 7 | $245,895 | 40 | 2.62/5.0 |
Analyzing the strategies of top hosts, such as their property selection, pricing, and guest communication, can offer valuable lessons for optimizing your own Airbnb operations in Poole.
Dive Deeper: Advanced Poole STR Market Data (2025)
Ready to unlock more insights? AirROI provides access to advanced metrics and comprehensive Airbnb data for Poole. Explore detailed analytics beyond this report to refine your investment strategy, optimize pricing, and maximize your vacation rental profits.
Explore Advanced MetricsPoole Short-Term Rental Market Composition (2025): Property & Room Types
Room Type Distribution
Property Type Distribution
Market Composition Insights for Poole
- The Poole Airbnb market composition is heavily skewed towards Entire Home/Apt listings, which make up 86.9% of the 579 active rentals. This indicates strong guest preference for privacy and space.
- Looking at the property type distribution in Poole, House properties are the most common (53.2%), reflecting the local real estate landscape.
- Houses represent a significant 53.2% portion, catering likely to families or larger groups.
- Smaller segments like hotel/boutique (combined 2.9%) offer potential for unique stay experiences.
Poole Airbnb Room Capacity Analysis (2025): Bedroom Distribution
Distribution of Listings by Number of Bedrooms
Room Capacity Insights for Poole
- The dominant room capacity in Poole is 2 bedrooms listings, making up 34.4% of the market. This suggests a strong demand for properties suitable for couples or solo travelers.
- Together, 2 bedrooms and 1 bedroom properties represent 57.2% of the active Airbnb listings in Poole, indicating a high concentration in these sizes.
- A significant 32.8% of listings offer 3+ bedrooms, catering to larger groups and families seeking more space in Poole.
Poole Vacation Rental Guest Capacity Trends (2025)
Distribution of Listings by Guest Capacity
Guest Capacity Insights for Poole
- The most common guest capacity trend in Poole vacation rentals is listings accommodating 4 guests (27.8%). This suggests the primary traveler segment is likely small families or groups.
- Properties designed for 4 guests and 6 guests dominate the Poole STR market, accounting for 48.0% of listings.
- 37.5% of properties accommodate 6+ guests, serving the market segment for larger families or group travel in Poole.
- On average, properties in Poole are equipped to host 4.4 guests.
Poole Airbnb Booking Patterns (2025): Available vs. Booked Days
Available Days Distribution
Booked Days Distribution
Booking Pattern Insights for Poole
- The most common availability pattern in Poole falls within the 271-366 days range, representing 40.4% of listings. This suggests many properties have significant open periods on their calendars.
- Approximately 70.8% of listings show high availability (181+ days open annually), indicating potential for increased bookings or specific owner usage patterns.
- For booked days, the 91-180 days range is most frequent in Poole (30.2%), reflecting common guest stay durations or potential owner blocking patterns.
- A notable 31.0% of properties secure long booking periods (181+ days booked per year), highlighting successful long-term rental strategies or significant owner usage.
Poole Airbnb Minimum Stay Requirements Analysis
Distribution of Listings by Minimum Night Requirement
1 Night
129 listings
24.8% of total
2 Nights
170 listings
32.7% of total
3 Nights
91 listings
17.5% of total
4-6 Nights
32 listings
6.2% of total
7-29 Nights
25 listings
4.8% of total
30+ Nights
73 listings
14% of total
Key Insights
- The most prevalent minimum stay requirement in Poole is 2 Nights, adopted by 32.7% of listings. This highlights the market's preference for shorter, flexible bookings.
- A significant segment (14%) caters to monthly stays (30+ nights) in Poole, pointing to opportunities in the extended-stay market.
Recommendations
- Align with the market by considering a 2 Nights minimum stay, as 32.7% of Poole hosts use this setting.
- If feasible, allowing 1-night stays, especially midweek or during low season, could capture last-minute bookings, as only 24.8% currently do.
- Explore offering discounts for stays of 30+ nights to attract the 14% of the market seeking extended stays.
- Adjust minimum nights based on seasonality – potentially shorter during low season and longer during peak demand periods in Poole.
Poole Airbnb Cancellation Policy Trends Analysis (2025)
Super Strict 60 Days
8 listings
1.6% of total
Flexible
75 listings
15.5% of total
Moderate
149 listings
30.7% of total
Firm
148 listings
30.5% of total
Strict
105 listings
21.6% of total
Cancellation Policy Insights for Poole
- The prevailing Airbnb cancellation policy trend in Poole is Moderate, used by 30.7% of listings.
- A majority (52.1%) of hosts in Poole utilize Firm or Strict policies, indicating a market where hosts prioritize booking security.
Recommendations for Hosts
- Consider adopting a Moderate policy to align with the 30.7% market standard in Poole.
- Regularly review your cancellation policy against competitors and market demand shifts in Poole.
Poole STR Booking Lead Time Analysis (2025)
Average Booking Lead Time by Month
Booking Lead Time Insights for Poole
- The overall average booking lead time for vacation rentals in Poole is 49 days.
- Guests book furthest in advance for stays during July (average 84 days), likely coinciding with peak travel demand or local events.
- The shortest booking windows occur for stays in March (average 38 days), indicating more last-minute travel plans during this time.
- Seasonally, Summer (74 days avg.) sees the longest lead times, while Winter (45 days avg.) has the shortest, reflecting typical travel planning cycles.
Recommendations for Hosts
- Use the overall average lead time (49 days) as a baseline for your pricing and availability strategy in Poole.
- For July stays, consider implementing length-of-stay discounts or slightly higher rates for bookings made less than 84 days out to capitalize on advance planning.
- Target marketing efforts for the Summer season well in advance (at least 74 days) to capture early planners.
- Monitor your own booking lead times against these Poole averages to identify opportunities for dynamic pricing adjustments.
Popular & Essential Airbnb Amenities in Poole (2025)
Amenity Prevalence
Amenity Insights for Poole
- Essential amenities in Poole that guests expect include: Smoke alarm, Heating, TV. Lacking these (any) could significantly impact bookings.
- Popular amenities like Wifi, Hot water, Kitchen are common but not universal. Offering these can provide a competitive edge.
- Warning: Wifi is not universally provided but is considered essential globally. Ensure reliable Wifi is offered.
Recommendations for Hosts
- Ensure your listing includes all essential amenities for Poole: Smoke alarm, Heating, TV.
- Prioritize adding missing essentials: Smoke alarm, Heating, TV.
- Consider adding popular differentiators like Wifi or Hot water to increase appeal.
- Highlight unique or less common amenities you offer (e.g., hot tub, dedicated workspace, EV charger) in your listing description and photos.
- Regularly check competitor amenities in Poole to stay competitive.
Poole Airbnb Guest Demographics & Profile Analysis (2025)
Guest Profile Summary for Poole
- The typical guest profile for Airbnb in Poole consists of primarily domestic travelers (88%), often arriving from nearby England, typically belonging to the Post-2000s (Gen Z/Alpha) group (50%), primarily speaking English or French.
- Domestic travelers account for 88.4% of guests.
- Key international markets include United Kingdom (88.4%) and United States (2.2%).
- Top languages spoken are English (66.8%) followed by French (7.8%).
- A significant demographic segment is the Post-2000s (Gen Z/Alpha) group, representing 50% of guests.
Recommendations for Hosts
- Target domestic marketing efforts towards travelers from England and London.
- Tailor amenities and listing descriptions to appeal to the dominant Post-2000s (Gen Z/Alpha) demographic (e.g., highlight fast WiFi, smart home features, local guides).
- Highlight unique local experiences or amenities relevant to the primary guest profile.
- Consider seasonal promotions aligned with peak travel times for key origin markets.
Nearby Short-Term Rental Market Comparison
How does the Poole Airbnb market stack up against its neighbors? Compare key performance metrics like average monthly revenue, ADR, and occupancy rates in surrounding areas to understand the broader regional STR landscape.
| Market | Active Properties | Monthly Revenue | Daily Rate | Avg. Occupancy |
|---|---|---|---|---|
| Englishcombe | 13 | $8,558 | $573.69 | 49% |
| Dorney | 12 | $8,335 | $622.48 | 45% |
| Chew Magna | 14 | $6,649 | $399.59 | 46% |
| Lambourn | 11 | $6,081 | $669.47 | 28% |
| City of Westminster | 1,327 | $6,043 | $486.66 | 52% |
| Long Sutton | 17 | $5,726 | $383.88 | 46% |
| Stoke St. Michael | 10 | $5,277 | $424.04 | 42% |
| Winsham | 10 | $5,154 | $484.22 | 52% |
| Oldland Common | 13 | $5,093 | $355.47 | 43% |
| Wraysbury | 14 | $4,719 | $396.18 | 46% |