Penzance Airbnb Market Analysis 2025: Short Term Rental Data & Vacation Rental Statistics in England, United Kingdom
Is Airbnb profitable in Penzance in 2025? Explore comprehensive Airbnb analytics for Penzance, England, United Kingdom to uncover income potential. This 2025 STR market report for Penzance, based on AirROI data from April 2024 to March 2025, reveals key trends in the market of 521 active listings.
Whether you're considering an Airbnb investment in Penzance, optimizing your existing vacation rental, or exploring rental arbitrage opportunities, understanding the Penzance Airbnb data is crucial. Leveraging the low regulation environment is key to maximizing your short term rental income potential. Let's dive into the specifics.
Key Penzance Airbnb Performance Metrics Overview
Monthly Airbnb Revenue Variations & Income Potential in Penzance (2025)
Understanding the monthly revenue variations for Airbnb listings in Penzance is key to maximizing your short term rental income potential. Seasonality significantly impacts earnings. Our analysis, based on data from the past 12 months, shows that the peak revenue month for STRs in Penzance is typically August, while February often presents the lowest earnings, highlighting opportunities for strategic pricing adjustments during shoulder and low seasons. Explore the typical Airbnb income in Penzance across different performance tiers:
- Best-in-class properties (Top 10%) achieve $5,022+ monthly, often utilizing dynamic pricing and superior guest experiences.
- Strong performing properties (Top 25%) earn $3,412 or more, indicating effective management and desirable locations/amenities.
- Typical properties (Median) generate around $2,182 per month, representing the average market performance.
- Entry-level properties (Bottom 25%) see earnings around $1,257, often with potential for optimization.
Average Monthly Airbnb Earnings Trend in Penzance
Penzance Airbnb Occupancy Rate Trends (2025)
Maximize your bookings by understanding the Penzance STR occupancy trends. Seasonal demand shifts significantly influence how often properties are booked. Typically, Augustsees the highest demand (peak season occupancy), while January experiences the lowest (low season). Effective strategies, like adjusting minimum stays or offering promotions, can boost occupancy during slower periods. Here's how different property tiers perform in Penzance:
- Best-in-class properties (Top 10%) achieve 80%+ occupancy, indicating high desirability and potentially optimized availability.
- Strong performing properties (Top 25%) maintain 63% or higher occupancy, suggesting good market fit and guest satisfaction.
- Typical properties (Median) have an occupancy rate around 45%.
- Entry-level properties (Bottom 25%) average 25% occupancy, potentially facing higher vacancy.
Average Monthly Occupancy Rate Trend in Penzance
Average Daily Rate (ADR) Airbnb Trends in Penzance (2025)
Effective short term rental pricing strategy in Penzance involves understanding monthly ADR fluctuations. The Average Daily Rate (ADR) for Airbnb in Penzance typically peaks in August and dips lowest during January. Leveraging Airbnb dynamic pricing tools or strategies based on this seasonality can significantly boost revenue. Here's a look at the typical nightly rates achieved:
- Best-in-class properties (Top 10%) command rates of $315+ per night, often due to premium features or locations.
- Strong performing properties (Top 25%) achieve nightly rates of $218 or more.
- Typical properties (Median) charge around $156 per night.
- Entry-level properties (Bottom 25%) earn around $110 per night.
Average Daily Rate (ADR) Trend by Month in Penzance
Get Live Penzance Market Intelligence 👇

Explore Real-time Analytics
Airbnb Seasonality Analysis & Trends in Penzance (2025)
Peak Season (August, July, June)
- Revenue averages $4,121 per month
- Occupancy rates average 63.2%
- Daily rates average $200
Shoulder Season
- Revenue averages $2,541 per month
- Occupancy maintains around 43.5%
- Daily rates hold near $184
Low Season (January, February, March)
- Revenue drops to average $1,364 per month
- Occupancy decreases to average 29.5%
- Daily rates adjust to average $173
Seasonality Insights for Penzance
- The Airbnb seasonality in Penzance shows highly seasonal trends requiring careful strategy. While the sections above show seasonal averages, it's also insightful to look at the extremes:
- During the high season, the absolute peak month showcases Penzance's highest earning potential, with monthly revenues capable of climbing to $4,602, occupancy reaching a high of 70.9%, and ADRs peaking at $204.
- Conversely, the slowest single month of the year, typically falling within the low season, marks the market's lowest point. In this month, revenue might dip to $1,343, occupancy could drop to 27.6%, and ADRs may adjust down to $172.
- Understanding both the seasonal averages and these monthly peaks and troughs in revenue, occupancy, and ADR is crucial for maximizing your Airbnb profit potential in Penzance.
Seasonal Strategies for Maximizing Profit
- Peak Season: Maximize revenue through premium pricing and potentially longer minimum stays. Ensure high availability.
- Low Season: Offer competitive pricing, special promotions (e.g., extended stay discounts), and flexible cancellation policies. Target off-season travelers like remote workers or budget-conscious guests.
- Shoulder Seasons: Implement dynamic pricing that balances peak and low rates. Target weekend travelers or specific events. Offer slightly more flexible terms than peak season.
- Regularly analyze your own performance against these Penzance seasonality benchmarks and adjust your pricing and availability strategy accordingly.
Best Areas for Airbnb Investment in Penzance (2025)
Exploring the top neighborhoods for short-term rentals in Penzance? This section highlights key areas, outlining why they are attractive for hosts and guests, along with notable local attractions. Consider these locations based on your target guest profile and investment strategy.
| Neighborhood / Area | Why Host Here? (Target Guests & Appeal) | Key Attractions & Landmarks |
|---|---|---|
| Mousehole | Charming fishing village with picturesque scenery and rich maritime history. Ideal for those seeking a quiet retreat near the coast, perfect for families and couples. | Mousehole Harbour, The Old Pilchard Press, Mousehole Christmas Lights, St. Clement's Church, Trengwainton Garden |
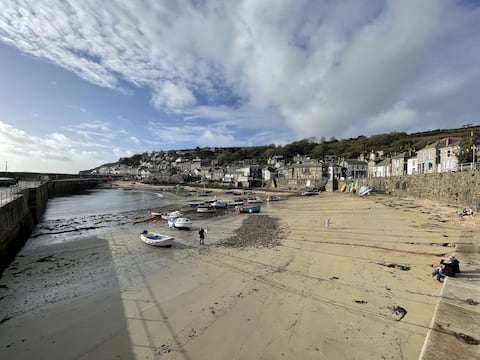
| Penzance Promenade | Scenic waterfront area known for its stunning views and long promenade. Popular with tourists for walking and cycling, offering direct access to local beaches and cafes. | Morrab Gardens, The Jubilee Pool, Penzance Harbour, Penlee House Gallery and Museum, The Pirate Inn |
| Newlyn | Vibrant fishing port known for its art community and seafood. Attracts artists and food lovers, making it an appealing spot for short-term rentals. | Newlyn Art Gallery, Newlyn Harbour, Mousehole to Newlyn coastal walk, The Tolcarne Inn, The Newlyn Fish Market |
| Marazion | Historic town with beautiful beaches and views of St. Michael's Mount. Great for families and beachgoers, offering a unique cultural experience. | St. Michael's Mount, Marazion Beach, RSPB Marazion Marsh, The Marazion Gallery, The Godolphin Arms |
| Holywell Bay | Lovely beach area with golden sands and surf opportunities. Perfect for families and beach enthusiasts looking for a seaside getaway. | Holywell Beach, The Holywell Bay Fun Park, The South West Coast Path, Perranporth Beach nearby, Holywell Cave |
| Lamorna Cove | Stunning cove that offers a peaceful retreat with its unspoiled beauty. Attracts nature lovers and hikers seeking tranquility and picturesque landscapes. | Lamorna Cove, The South West Coast Path, Lamorna Wink pub, Nearby coastal walks, Wildflower gardens |
| Goldsithney | Quaint village close to Penzance and its amenities. Popular for those seeking a rural experience while being close to the coast and attractions. | Goldsithney Village Hall, Nearby beaches, Local pubs, Cycle routes, Walking paths |
| St. Just | Historic town with rich mining heritage and proximity to the coast. Attracts visitors interested in culture and history, offering scenic walks. | Cape Cornwall, The miners' chapel, St. Just's local shops, The Land's End peninsula, Nearby coastal walks |
Understanding Airbnb License Requirements & STR Laws in Penzance (2025)
While Penzance, England, United Kingdom currently shows low STR regulations, specific Airbnb license requirements might still exist or change. Always verify the latest short term rental regulations and Airbnb license requirements directly with local government authorities for Penzance to ensure full compliance before hosting.
(Source: AirROI data, 2025, based on 0% licensed listings)
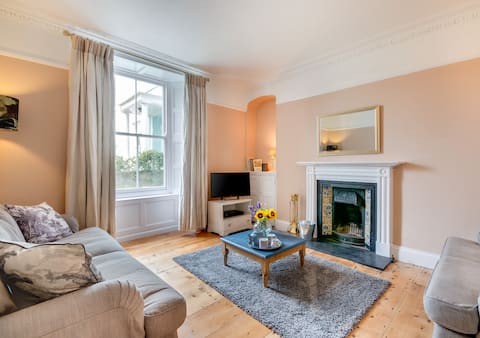
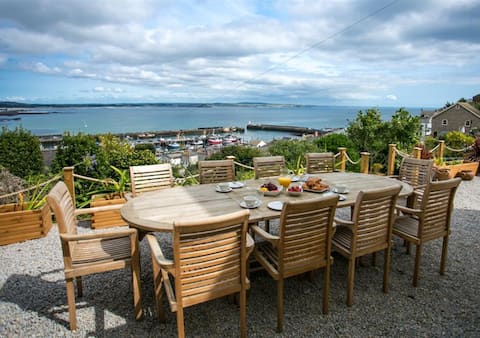
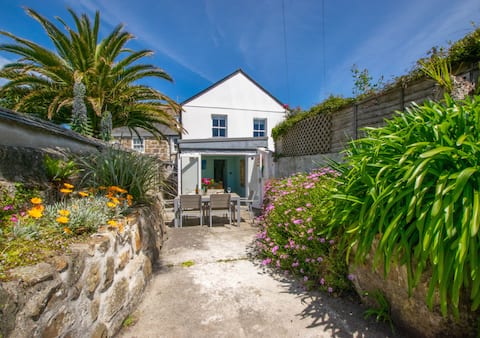
Top Performing Airbnb Properties in Penzance (2025)
Benchmark your potential! Explore examples of top-performing Airbnb properties in Penzancebased on Trailing Twelve Month (TTM) revenue. Analyze their characteristics, revenue, occupancy rate, and ADR to understand what drives success in this market.
The Old Post Office - Mousehole
Entire Place • 2 bedrooms
The Blue House, Penzance
Entire Place • 3 bedrooms

Fantastic family beach house by the sea
Entire Place • 4 bedrooms
Orchard Cottage
Entire Place • 4 bedrooms
26 Chapel Street
Entire Place • 3 bedrooms
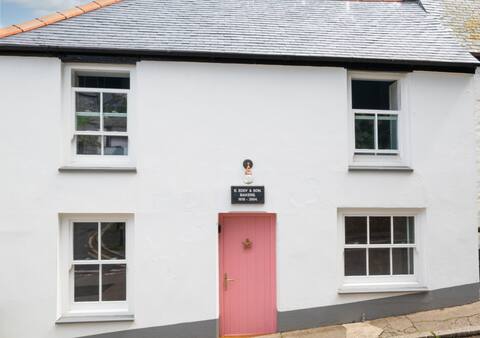
The Old Bakery
Entire Place • 2 bedrooms
Note: Performance varies based on location, size, amenities, seasonality, and management quality. Data reflects the past 12 months.
Top Performing Airbnb Hosts in Penzance (2025)
Learn from the best! This table showcases top-performing Airbnb hosts in Penzance based on the number of properties managed and estimated total revenue over the past year. Analyze their scale and performance metrics.
| Host Name | Properties | Grossing Revenue | Stay Reviews | Avg Rating |
|---|---|---|---|---|
| Host My Home | 23 | $888,769 | 737 | 4.41/5.0 |
| Cornish Horizons | 19 | $846,236 | 111 | 3.58/5.0 |
| The Cornish Way Ltd | 10 | $394,179 | 318 | 4.92/5.0 |
| Emma | 7 | $363,585 | 1044 | 4.95/5.0 |
| Cottages | 13 | $349,348 | 148 | 3.23/5.0 |
| Luxury Coastal | 11 | $257,415 | 225 | 4.77/5.0 |
| Jasmin | 6 | $215,172 | 912 | 4.86/5.0 |
| Nini | 3 | $200,435 | 174 | 4.96/5.0 |
| Hannah | 5 | $179,912 | 81 | 4.81/5.0 |
| Andrew | 1 | $149,150 | 6 | 4.83/5.0 |
Analyzing the strategies of top hosts, such as their property selection, pricing, and guest communication, can offer valuable lessons for optimizing your own Airbnb operations in Penzance.
Dive Deeper: Advanced Penzance STR Market Data (2025)
Ready to unlock more insights? AirROI provides access to advanced metrics and comprehensive Airbnb data for Penzance. Explore detailed analytics beyond this report to refine your investment strategy, optimize pricing, and maximize your vacation rental profits.
Explore Advanced MetricsPenzance Short-Term Rental Market Composition (2025): Property & Room Types
Room Type Distribution
Property Type Distribution
Market Composition Insights for Penzance
- The Penzance Airbnb market composition is heavily skewed towards Entire Home/Apt listings, which make up 86% of the 521 active rentals. This indicates strong guest preference for privacy and space.
- Looking at the property type distribution in Penzance, House properties are the most common (62.8%), reflecting the local real estate landscape.
- Houses represent a significant 62.8% portion, catering likely to families or larger groups.
- The presence of 6.3% Hotel/Boutique listings indicates integration with traditional hospitality.
- Smaller segments like others, outdoor/unique, unique stays (combined 6.3%) offer potential for unique stay experiences.
Penzance Airbnb Room Capacity Analysis (2025): Bedroom Distribution
Distribution of Listings by Number of Bedrooms
Room Capacity Insights for Penzance
- The dominant room capacity in Penzance is 2 bedrooms listings, making up 32.6% of the market. This suggests a strong demand for properties suitable for couples or solo travelers.
- Together, 2 bedrooms and 1 bedroom properties represent 65.2% of the active Airbnb listings in Penzance, indicating a high concentration in these sizes.
- A significant 24.3% of listings offer 3+ bedrooms, catering to larger groups and families seeking more space in Penzance.
Penzance Vacation Rental Guest Capacity Trends (2025)
Distribution of Listings by Guest Capacity
Guest Capacity Insights for Penzance
- The most common guest capacity trend in Penzance vacation rentals is listings accommodating 4 guests (29.9%). This suggests the primary traveler segment is likely small families or groups.
- Properties designed for 4 guests and 2 guests dominate the Penzance STR market, accounting for 57.2% of listings.
- 19.0% of properties accommodate 6+ guests, serving the market segment for larger families or group travel in Penzance.
- On average, properties in Penzance are equipped to host 3.6 guests.
Penzance Airbnb Booking Patterns (2025): Available vs. Booked Days
Available Days Distribution
Booked Days Distribution
Booking Pattern Insights for Penzance
- The most common availability pattern in Penzance falls within the 181-270 days range, representing 40.3% of listings. This suggests many properties have significant open periods on their calendars.
- Approximately 70.6% of listings show high availability (181+ days open annually), indicating potential for increased bookings or specific owner usage patterns.
- For booked days, the 91-180 days range is most frequent in Penzance (39.9%), reflecting common guest stay durations or potential owner blocking patterns.
- A notable 31.1% of properties secure long booking periods (181+ days booked per year), highlighting successful long-term rental strategies or significant owner usage.
Penzance Airbnb Minimum Stay Requirements Analysis
Distribution of Listings by Minimum Night Requirement
1 Night
105 listings
21.4% of total
2 Nights
95 listings
19.3% of total
3 Nights
131 listings
26.7% of total
4-6 Nights
49 listings
10% of total
7-29 Nights
25 listings
5.1% of total
30+ Nights
86 listings
17.5% of total
Key Insights
- The most prevalent minimum stay requirement in Penzance is 3 Nights, adopted by 26.7% of listings. This highlights the market's preference for longer commitments.
- A significant segment (17.5%) caters to monthly stays (30+ nights) in Penzance, pointing to opportunities in the extended-stay market.
Recommendations
- Align with the market by considering a 3 Nights minimum stay, as 26.7% of Penzance hosts use this setting.
- If feasible, allowing 1-night stays, especially midweek or during low season, could capture last-minute bookings, as only 21.4% currently do.
- Explore offering discounts for stays of 30+ nights to attract the 17.5% of the market seeking extended stays.
- Adjust minimum nights based on seasonality – potentially shorter during low season and longer during peak demand periods in Penzance.
Penzance Airbnb Cancellation Policy Trends Analysis (2025)
Refundable
1 listings
0.2% of total
Super Strict 60 Days
37 listings
7.7% of total
Super Strict 30 Days
1 listings
0.2% of total
Flexible
65 listings
13.5% of total
Moderate
121 listings
25.1% of total
Firm
121 listings
25.1% of total
Strict
136 listings
28.2% of total
Cancellation Policy Insights for Penzance
- The prevailing Airbnb cancellation policy trend in Penzance is Strict, used by 28.2% of listings.
- A majority (53.3%) of hosts in Penzance utilize Firm or Strict policies, indicating a market where hosts prioritize booking security.
Recommendations for Hosts
- Consider adopting a Strict policy to align with the 28.2% market standard in Penzance.
- Regularly review your cancellation policy against competitors and market demand shifts in Penzance.
Penzance STR Booking Lead Time Analysis (2025)
Average Booking Lead Time by Month
Booking Lead Time Insights for Penzance
- The overall average booking lead time for vacation rentals in Penzance is 65 days.
- Guests book furthest in advance for stays during July (average 101 days), likely coinciding with peak travel demand or local events.
- The shortest booking windows occur for stays in March (average 47 days), indicating more last-minute travel plans during this time.
- Seasonally, Summer (92 days avg.) sees the longest lead times, while Winter (57 days avg.) has the shortest, reflecting typical travel planning cycles.
Recommendations for Hosts
- Use the overall average lead time (65 days) as a baseline for your pricing and availability strategy in Penzance.
- For July stays, consider implementing length-of-stay discounts or slightly higher rates for bookings made less than 101 days out to capitalize on advance planning.
- Target marketing efforts for the Summer season well in advance (at least 92 days) to capture early planners.
- Monitor your own booking lead times against these Penzance averages to identify opportunities for dynamic pricing adjustments.
Popular & Essential Airbnb Amenities in Penzance (2025)
Amenity Prevalence
Amenity Insights for Penzance
- Essential amenities in Penzance that guests expect include: Wifi, Heating, Smoke alarm. Lacking these (any) could significantly impact bookings.
- Popular amenities like Essentials, TV, Kitchen are common but not universal. Offering these can provide a competitive edge.
Recommendations for Hosts
- Ensure your listing includes all essential amenities for Penzance: Wifi, Heating, Smoke alarm.
- Prioritize adding missing essentials: Wifi, Heating, Smoke alarm.
- Consider adding popular differentiators like Essentials or TV to increase appeal.
- Highlight unique or less common amenities you offer (e.g., hot tub, dedicated workspace, EV charger) in your listing description and photos.
- Regularly check competitor amenities in Penzance to stay competitive.
Penzance Airbnb Guest Demographics & Profile Analysis (2025)
Guest Profile Summary for Penzance
- The typical guest profile for Airbnb in Penzance consists of primarily domestic travelers (75%), often arriving from nearby England, typically belonging to the Post-2000s (Gen Z/Alpha) group (50%), primarily speaking English or French.
- Domestic travelers account for 74.8% of guests.
- Key international markets include United Kingdom (74.8%) and United States (5.7%).
- Top languages spoken are English (56.6%) followed by French (9.5%).
- A significant demographic segment is the Post-2000s (Gen Z/Alpha) group, representing 50% of guests.
Recommendations for Hosts
- Target domestic marketing efforts towards travelers from England and London.
- Tailor amenities and listing descriptions to appeal to the dominant Post-2000s (Gen Z/Alpha) demographic (e.g., highlight fast WiFi, smart home features, local guides).
- Highlight unique local experiences or amenities relevant to the primary guest profile.
- Consider seasonal promotions aligned with peak travel times for key origin markets.
Nearby Short-Term Rental Market Comparison
How does the Penzance Airbnb market stack up against its neighbors? Compare key performance metrics like average monthly revenue, ADR, and occupancy rates in surrounding areas to understand the broader regional STR landscape.
| Market | Active Properties | Monthly Revenue | Daily Rate | Avg. Occupancy |
|---|---|---|---|---|
| Llanrhidian | 15 | $4,842 | $386.18 | 53% |
| Trenance | 19 | $4,795 | $428.63 | 43% |
| Angle | 13 | $4,602 | $384.81 | 42% |
| Ludchurch | 15 | $4,354 | $291.87 | 43% |
| Redberth | 29 | $4,103 | $223.37 | 59% |
| Higher Crackington | 17 | $3,731 | $340.74 | 37% |
| Perranuthnoe | 24 | $3,421 | $352.15 | 37% |
| St. John | 44 | $3,354 | $233.49 | 50% |
| Llanboidy | 10 | $3,280 | $260.08 | 45% |
| Llangennith | 32 | $3,271 | $251.71 | 52% |